First Science Observations with SOFIA/FORCAST: Properties of Intermediate-Luminosity Protostars and Circumstellar Disks in OMC-2
Abstract
We examine eight young stellar objects in the OMC-2 star forming region based on observations from the SOFIA/FORCAST early science phase, the Spitzer Space Telescope, the Herschel Space Observatory, 2MASS, APEX, and other results in the literature. We show the spectral energy distributions of these objects from near-infrared to millimeter wavelengths, and compare the SEDs with those of sheet collapse models of protostars and circumstellar disks. Four of the objects can be modelled as protostars with infalling envelopes, two as young stars surrounded by disks, and the remaining two objects have double-peaked SEDs. We model the double-peaked sources as binaries containing a young star with a disk and a protostar. The six most luminous sources are found in a dense group within a pc region; these sources have luminosities ranging from 300 to 20 . The most embedded source (OMC-2 FIR 4) can be fit by a class 0 protostar model having a luminosity of and mass infall rate of .
1 INTRODUCTION
OMC-2 is a star forming region embedded in the molecular filament stretching northward of the Orion Nebula and is one of the most luminous regions in the Orion A molecular cloud. Recent distance estimates place it at pc (Hirota et al. 2007, Jeffries 2007, Menten et al. 2007, Sandstrom et al. 2007). As a site of star formation activity, it contains a large number of protostars and pre-main sequence stars with dusty circumstellar disks (Peterson & Megeath 2008). Therefore, OMC-2 represents a laboratory for the investigation of the detailed properties of protostars and disks which are forming in an active environment.
Gatley et al. (1974) first identified OMC-2 as a complex of pre-main sequence objects associated with nearby CO emission. Thronson et al. (1978) measured the infrared luminosity of OMC-2 to be 2100 , but did not resolve the far-IR components of IRS 3 and IRS 4 and thus could not provide a measurement of their individual SEDs. Later work expanded the coverage of OMC-2 to higher resolution at the longer wavelengths. Chini et al. (1997) conducted a millimeter study that resolved several cold (20 K) dusty cores throughout OMC-2/3. In OMC-2, these cores are associated with submillimeter continuum emission (Lis et al. 1998). The detection of centimeter sources with the VLA established many of the cores as bona fide protostars (Reipurth, Rodríguez & Chini 1999). Recent studies have included high resolution, ground-based observations to further examine both the stellar component and the dusty cores (Nielbock, Chini & Müller 2003, Shimajiri et al. 2008). These studies revealed several stellar sources associated with the dusty cores and substructure in the cold dust of FIR 4.
While previous studies include high resolution observations at 10 and 20 m, submillimeter, and millimeter wavelengths, there is a lack of data at high spatial resolution in the m range which is critical for constraining models of protostellar envelopes and for characterizing any external heating of both dusty disks and envelopes. During its early science phase, SOFIA (Young et al. 2012) observed the Orion Nebula Cluster and OMC-2 with the FORCAST mid-IR camera (Adams et al. 2010, Herter et al. 2012) and detected eight intermediate-luminosity protostars and disks in OMC-2. We combine these data with data from the 2MASS near-infrared survey (Skrutskie et al. 2006), the Spitzer Orion Molecular Cloud Survey (Megeath et al. 2005), the Herschel Orion Protostar Survey (HOPS; Fischer et al. 2010), submillimeter data from APEX, and other published data in the literature to produce complete SEDs of these objects from near-IR to millimeter wavelengths. Finally, we compare the SEDs to those of model protostars and disks in order to derive the physical properties of these objects.
2 OBSERVATIONS
2.1 SOFIA/FORCAST Observations
SOFIA/FORCAST observed OMC-2 during the SOFIA short science phase on December 1 and December 8, 2010, at an altitude of m. Two pointings were used: ( , ) and ( , ). Each pointing covered , with a (rectified) pixel scale of /pixel. The first pointing was observed at 19.7 m and 37.1 m (with the dichroic beamsplitter). The second pointing was observed at 19.7 m and 31.4 m (with the dichroic), and 37.1 m (without the dichroic). Observing modes C2N and C2NC2 (Herter et al. 2012) were used. A large () asymmetric chop throw was used to chop off nearby nebulosity and minimize off-axis coma in the on-source beam. The chop frequency was Hz and the nod amplitude was approximately . A 5-point, step dither pattern was performed to reject bad pixels during post-processing. The integration time in each dither position was approximately 30 sec.
The data were processed with the reduction steps described in Herter et al. (2012). Point source photometry was performed on sources in the images using two-dimensional Gaussian fits to their radial brightness profiles. Typical FWHM image quality values were and at 19.7 and 37.1 m, respectively. During the December 8 flight, some elongation of the PSF was seen in the cross-elevation direction, resulting in image quality of and in the cross-elevation and elevation direction, respectively, in the second pointing field at 31.4 m. Photometric signal-to-noise was consistent with the mean point source sensitivity over 3 short science flights (Herter et al. 2012).
The extracted photometric fluxes were calibrated to a flux density using a standard instrument response derived from measurements of standard stars and solar system objects over several short science and basic science flights (Herter et al. 2012). We applied small () color corrections to each source, since the standard instrument response represents the response to a flat spectrum ( constant) source. The estimated uncertainty in the calibration due to variations in flat field, water vapor burden, and altitude is approximately .
2.2 Spitzer Observations
Spitzer/IRAC images were taken in two epochs in 2004 March 09 and October 10 as part of program PID 43. The reported photometry is the median value obtained from four 10.4 second high dynamic range mode frames. The magnitudes of the sources were extracted with aperture photometry from the Basic Calibrated Data using the IDL aper.pro program (Landsman 1993). A 2 pixel radius and 2 to 6 pixel background annulus was used (Megeath et al. in prep.), and a standard calibration was adopted (see Gutermuth et al. 2009 and Reach et al. 2005). The MIPS scan map was made in 2004 March 20 with the fast rate and cross scan offset as part of program PID 58, resulting in 30 seconds of integration time per pixel. The data were reduced with the MIPS instrument team’s Data Analysis Tool (Gordon et al. 2005), and photometry was obtained using a the IDL implementation of DAOPHOT (Landsman 1993). DAOPHOT was modified to ignore saturated pixels (Kruykova et al. submitted). The calibration of Engelbracht et al. (2007) was adopted. The magnitudes were computed to flux densities using the zero fluxes given in Reach et al. (2005) for IRAC and Engelbracht et al. (2007) for MIPS. Given the relatively insensitivity of the fluxes to the spectral shape, color corrections were not applied.
Spitzer/IRS spectra were acquired for two sources (MIR 29 and MIR 31+32; Nielobock et al. 2003) in the SOFIA/FORCAST fields-of-view. These m spectra were obtained with the short-low and long-low modules (PIDs 30859 and 50734). We follow the method described in Poteet et al. (2011) to extract and calibrate the spectra.
2.3 Herschel Observations
The Herschel Space Observatory observed an square field encompassing HOPS 59, 60, 108, 368, 369, and 370 on 2010 September 28 (observing day 502, observation IDs 1342205228 and 1342205229) in the 70 m and 160 m bands of the PACS instrument (Poglitsch et al. 2010) as part of the HOPS Open Time Key Program. These data have angular resolutions of and , respectively. The target field was observed with homogeneous coverage using two orthogonal scanning directions and a scan speed of /s, with each scan repeated 8 times for a total observation time of 3290 s. To facilitate point source photometry, a high-pass filter was applied to the data to minimize the effects of drift (Fischer et al. 2010).
The aperture photometry was obtained using a aperture at 70 m and a aperture at 160 m with a background annulus extending from the aperture limit to twice that value in both channels. The results were corrected with the encircled energy fraction provided by the PACS consortium (priv. comm.). The error estimate, which is dominated by calibration uncertainties, is estimated to be 5% at both wavelengths.
2.4 APEX Data
We include 350 and 870 m photometry acquired at APEX with SABOCA and LABOCA, respectively (proposal ID 088.C-0994). Stanke et al. (2010) describe the observing and data reduction procedures for the APEX data. The beam sizes of the final reduced maps are and for the SABOCA and LABOCA observations respectively. We measured the flux density per beam at the position of the source initially using the coordinates from the HOPS survey 70 m point source photometry. If the source is well–detected, we re-centered the coordinates and measure the flux centered on the source in order to account for possible pointing offsets between data sets. Otherwise, we adopt the PACS 70 m coordinates and measure a flux which we can consider an upper limit on the source flux at the wavelength of interest. The errors are dominated by the calibration uncertainty and are therefore adopted to be 40% of the measured flux at both wavelengths.
3 RESULTS
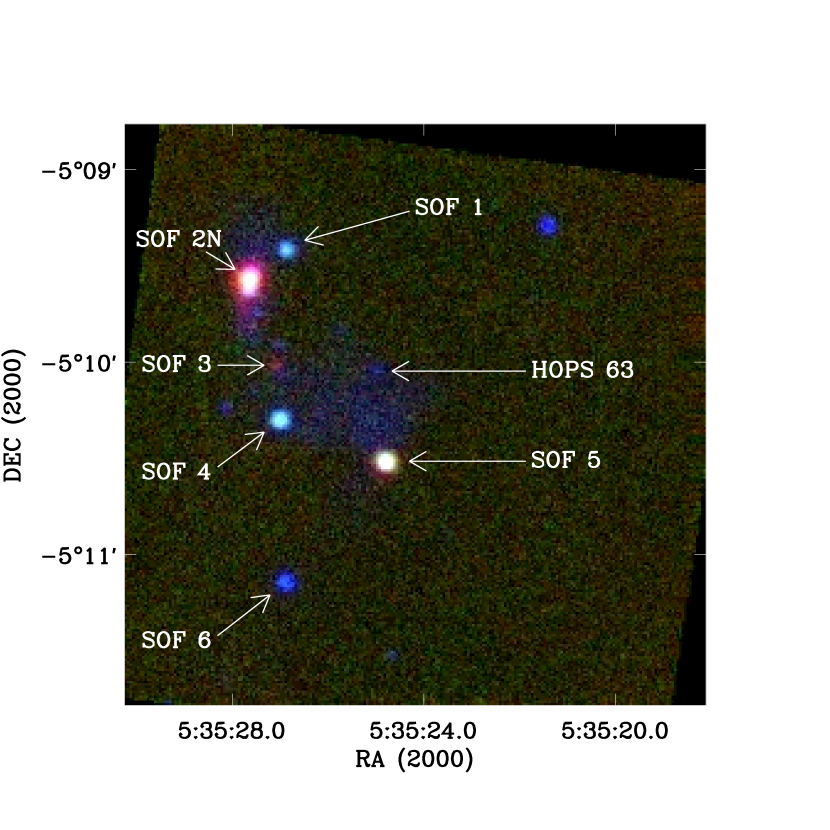
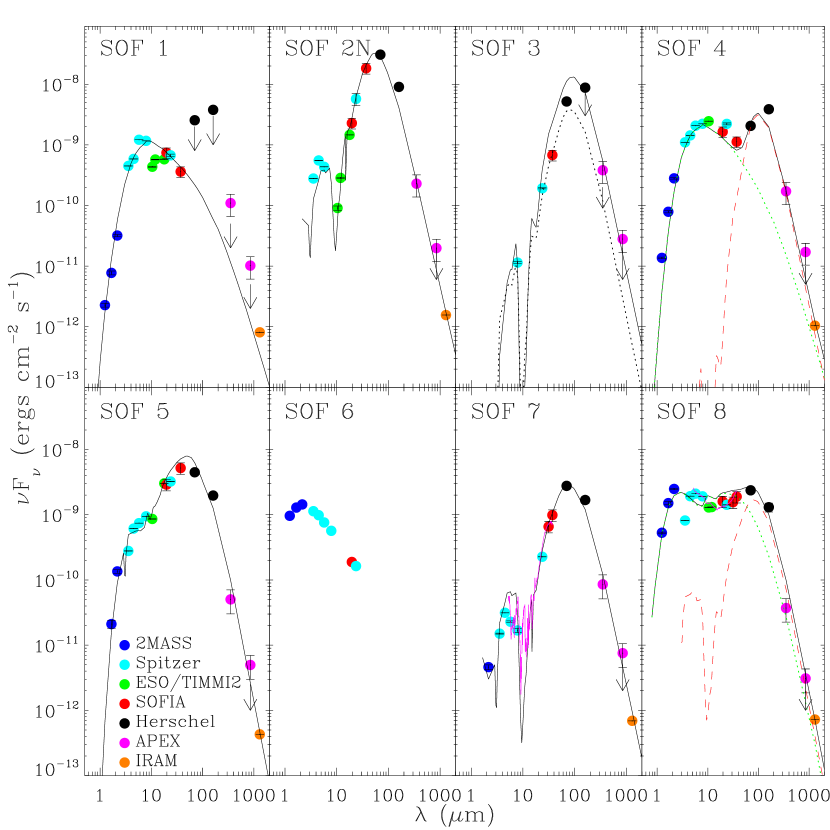
Fig. 1 shows a Spitzer/IRAC and SOFIA/FORCAST multi-wavelength false color image of the northern FORCAST field. In both FORCAST fields, SOFIA/FORCAST detected most point sources (except the faint source HOPS 63, a likely protostar, and HOPS 64, a likely young stellar object), that were present in the Herschel/PACS 70 and 160 m images, plus the source SOF 6. This field shows a relatively compact group of luminous young stellar objects, with seven sources found in a pc region. The two remaining sources, SOF 7 and SOF 8 are found to the south of the group and are not shown. In Table 1, we list the eight SOFIA/FORCAST sources detected in the field and cross-correlate this list with previous identifications. In Table 2, we present the flux densities for each source. We used these flux densities to construct a SED for each source (Fig. 2), with additional values at 1-2 m (2MASS), 10.4 m, 11.9 m, and 17.8 m (Nielbock et al. 2003), and 1.3 mm (Chini et al. 1997). Fig. 2 also shows that the Spitzer/IRS spectra for SOF 7 and SOF 8 are in excellent agreement with the FORCAST data.
4 MODELS
The physical properties of the SOFIA-detected objects were derived using models consisting of an infalling envelope and/or a star+disk system. For the envelope, we adopted the sheet collapse models developed by Hartmann, Calvet & Boss (1996, hereafter HCB96), which seem appropriate given the filamentary nature of the OMC-2 molecular emission. In these models, the envelope is flattened not only in the inner region, because of rotation, but also at large scales due to the natural elongation of the cloud. The inner region of the envelope is also partially excavated by an outflow cavity. We adopted a dust opacity law that is based on the observed class I object L1551 IRS5 (Osorio et al. 2003). The dust mixture includes graphites, silicates, troilites and water ice compounds with a standard grain-size distribution of , with a minimum and maximun size dust grains of 0.005 m and 0.3 m, respectively. The temperature distributions and SEDs were calculated using radiative codes developed by Kenyon, Calvet & Hartmann (1993) and by HCB96. In some cases, external heating of the envelope was added by using a single temperature modified blackbody (Poteet et al. 2011) of temperature K; this is expected in the OMC-2 region which is near the Orion Nebula and is likely heated by the massive stars in that regions.
For the disk component of the model, we used the flared accretion disk models developed by D’Alessio et al. (1999, 2006). In these models the disk density is given by the conservation of angular momentum flux and an uniform mass accretion rate. The temperature distribution is determined from heating by viscous dissipation and stellar irradiation. The disk radius is assumed to coincide with the centrifugal radius (which is the largest radius on the equatorial plane that receives the infalling material). The disk models also account for dust evolution given by grain growth and settling towards the disk midplane. We assumed that the dust composition and grain-size distribution is the same as in the envelope, except in the disk midplane where a maximum grain size of 1 mm is adopted.
5 DISCUSSION OF OBJECTS
The best-fitting model SEDs are overlayed with the data in Fig. 2. The constrained model parameters for seven objects are
listed in Table 3. We provide comments on each object:
SOF 1: The m fluxes of this source are considered
upper limits due to contamination from extended emission associated with
SOF 2N. Therefore, we fit this object by taking into account only the SED at m.
The best fitting model consists of a young star surrounded by a disk with a
high mass accretion rate ( yr-1).
SOF 2N: Cohen & Frogel (1977) presented near-IR images showing that IRS 4 has two
distinct components, which are flagged as confused in the 2MASS catalog.
Both components (MIR 21 and MIR 22) were resolved
by Nielbock et al. (2003) at 10.4 and 17.8 m. We
assume the northern component emits most of the flux at m,
as evidenced by the relative flux densities at m, and this is the component we model.
A high luminosity of 300 as well as some external heating is
required by our model to explain the SOFIA flux at 37 m.
Therefore, SOF 2N likely hosts an intermediate-mass protostar.
A highly flattened, nearly edge-on envelope with a large opening-angle cavity is also required to
reproduce the short wavelength data.
SOF 3: This deeply embedded source is a class 0 protostar associated with FIR 4 and was not detected by Nielbock et al. (2003) at 10.4 m. This object has a large envelope mass (2.5 - 10 ) and and dominates the submillimeter emission in this field. Two fits were obtained: one which treated the 160 micron as a detection, and one which treated 160 um as an upper limit (which would be the case if the 160 um emission were contaminated by the extended emission). The resulting luminosites range and the implied infall rates range from to ; the highest infall rates in our sample (see Table 3). Shimajiri et al. (2008) resolved several small dust clumps toward FIR 4 at 3.3 mm, but none of these clumps shows a peak that is clearly coincident with our m detections.
SOF 4: The SOFIA data reveal that the SED has a double peak.
Our attempts to model this source as a single object
failed to explain the two peaks. Rather, we interpret this source as a
double stellar system, where one of the stars (more evolved)
is surrounded only by the disk component that dominates the emission at
m. The other star (likely in an earlier
evolutionary phase) is deeply embedded into its infalling
envelope that dominates the emission at m. The best
fit to the disk source requires a high mass accretion rate
().
SOF 5: Bipolar nebulosity from this object is seen at m (Megeath et al., in prep.).
This can be used to constrain the inclination angle, resulting in a better estimate
of the luminosity and the density inferred from the modeling.
SOF 6: This is a young stellar object with a disk. It was not detected at m and we do not
model this source.
SOF 7: The model for this object requires a central luminosity of
15 and a contribution from external heating. A Spitzer/IRS spectrum shows a deep silicate absorption at 9.7 m
which is fitted by assuming a high inclination angle and a large cavity.
Inspection of the 3.6 and 4.5 m images shows a small lobe of
nebulosity extending to the northeast.
SOF 8: Nielbock et al. (2003) resolved a double
source (MIR 31 and 32) with projected separation at this location at 10.4 and 11.9 m. This
object has a nearly flat SED from m to 160 m. We
achieved a best fit to the SED using a binary system model. The best fit
model indicates that in one of the sources the emission arises from a
disk around an intermediate mass star and produces a luminosity of .
The companion was fit by a protostar model that contains a dense envelope of
irradiated by a central luminosity of .
6 CONCLUSION
We have used SOFIA early science observations to examine the detailed properties of eight intermediate-luminosity () protostars and circumstellar disks in OMC-2. Based on the model fits, it is believed that four of these objects are protostars and two are young stars with circumstellar disks, while two are likely young binary systems. This work demonstrates the potential of SOFIA to observe protostars in active, luminous star forming regions, while simultaneously complementing both space- and ground-based observations. With such observations, we can characterize in detail the properties of protostars and examine the dependence of star formation on environment.
References
- Adams et al. (2010) Adams, J. D., Herter, T. L., Gull, G. E., Schoenwald, J., Henderson, C. P., Keller, L. D., De Buizer, J. M., Stacey, G. J., Nikola, T. 2010, Proc. SPIE, 7735, 62
- Chini et al. (1997) Chini, R., Reipurth, B., Ward-Thompson, D., Bally, J., Nyman, L.-A., Sievers, A., and Billawala, Y. 1997, ApJ, 474L, 135
- Cohen & Frogel (1977) Cohen, J. G. and Frogel, J. A. 1977, ApJ, 211, 178
- D’Alessio et al. (1999) D’Alessio, P., Calvet, N., Hartmann, L., Lizano, S., and Cantó, J. 1999, ApJ, 527, 893
- D’Alessio et al. (2006) D’Alessio, P., Calvet, N., Hartmann, L., Franco-Hernández, R., and Servín, H. 2006, ApJ, 638, 314
- De Buizer, Osorio & Calvet (2005) De Buizer, J. M., Osorio, M., and Calvet, Nuria 2005, ApJ, 635, 452
- Engelbracht et al. (2007) Engelbracht, C. W., Blaylock, M., Su, K. Y. L., Rho, J., Rieke, G. H., Muzerolle, J., Padgett, D. L., Hines, D. C., Gordon, K. D., Fadda, D., Noriega-Crespo, A., Kelly, D. M., Latter, W. B., Hinz, J. L., Misselt, K. A., Morrison, J. E., Stansberry, J. A., Shupe, D. L., Stolovy, S., Wheaton, W. A., Young, E. T., Neugebauer, G., Wachter, S., Pérez-González, P. G., Frayer, D. T., and Marleau, F. R. 2007, PASP, 119, 994
- Fischer et al. (2010) Fischer, W. J., Megeath, S. T., Ali, B., Tobin, J. J., Osorio, M., Allen, L. E., Kryukova, E., Stanke, T., Stutz, A. M., Bergin, E., Calvet, N., di Francesco, J., Furlan, E., Hartmann, L., Henning, T., Krause, O., Manoj, P., Maret, S., Muzerolle, J., Myers, P., Neufeld, D., Pontoppidan, K., Poteet, C. A., Watson, D. M., and Wilson, T. 2010, A&A, 518L, 122
- Gatley et al. (1974) Gatley, I., Becklin, E. E., Matthews, K., Neugebauer, G., Penston, M. V., and Scoville, N. 1974, ApJ, 191, 121
- Gordon et al. (2005) Gordon, K. D., Rieke, G. H., Engelbracht, C. W., Muzerolle, J., Stansberry, J. A., Misselt, K. A., Morrison, J. E., Cadien, J., Young, E. T., Dole, H., Kelly, D. M., Alonso-Herrero, A., Egami, E., Su, K. Y. L., Papovich, C., Smith, P. S., Hines, D. C., Rieke, M. J., Blaylock, M., Pérez-González, P. G., Le Floc’h, E., Hinz, J. L., Latter, W. B., Hesselroth, T., Frayer, D. T., Noriega-Crespo, A., Masci, F. J., Padgett, D. L., Smylie, M. P., and Haegel, N. M. 2005, PASP, 117, 503
- Gutermuth et al. (2009) Gutermuth, R. A., Megeath, S. T., Myers, P. C., Allen, L. E., Pipher, J. L., and Fazio, G. G. 2009, ApJS, 184, 18
- Hartmann, Calvet & Boss (1996) Hartmann, L., Calvet, N., and Boss, A. 1996, ApJ, 464, 387
- Herter et al. (2012) Herter, T. L., Adams, J. D., De Buizer, J. M., Gull, G. E., Schoenwald, J., Henderson, C. P., Keller, L. D., Nikola, T., Stacey, G., and Vacca, W. D. 2012, ApJL, this issue
- Hirota et al. (2007) Hirota, T., Bushimata, T., Choi, Y. K., Honma, M., Imai, H., Iwadate, K., Jike, T., Kameno, S., Kameya, O., Kamohara, R., Kan-Ya, Y., Kawaguchi, N., Kijima, M., Kim, M. K., Kobayashi, H., Kuji, S., Kurayama, T., Manabe, S., Maruyama, K., Matsui, M., Matsumoto, N., Miyaji, T., Nagayama, T., Nakagawa, A., Nakamura, K., Oh, C. S., Omodaka, T., Oyama, T., Sakai, S., Sasao, T., Sato, K., Sato, M., Shibata, K. M., Shintani, M., Tamura, Y., Tsushima, M., and Yamashita, K. 2007, PASJ, 59, 897
- Jeffries (2007) Jeffries, R. D. 2007, MNRAS, 376, 1109
- Kenyon, Calvet & Hartmann (1993) Kenyon, S. J., Calvet, N., and Hartmann, L. 1993, ApJ, 414, 676
- Landsman (1993) Landsman, W. B. 1993, ASP Conference Series, 52, 246
- Lis et al. (1998) Lis, D. C., Serabyn, E., Keene, J., Dowell, C. D., Benford, D. J., Phillips, T. G., Hunter, T. R., and Wang, N. 1998, ApJ, 509, 299
- Megeath et al. (2005) Megeath, S. T., Flaherty, K. M., Hora, J., Allen, L. E., Fazio, G. G., Hartmann, L., Myers, P. C., Muzerolle, J., Pipher, J. L., Siegler, N., Stauffer, J. R., and Young, E. 2005, IAUS, 227, 383
- Menten et al. (2007) Menten, K. M., Reid, M. J., Forbrich, J., and Brunthaler, A. 2007, A&A, 474, 515
- Nielbock, Chini & Müller (2003) Nielbock, M., Chini, R., and Müller, S. A. H. 2003, A&A, 408, 245
- Osorio et al. (2003) Osorio, M., D’Alessio, P., Muzerolle, J., Calvet, N., and Hartmann, L. 2003, ApJ, 586, 1148
- Peterson & Megeath (2008) Peterson, D. and Megeath, S. T. 2008, Handbook of Star Forming Regions, Vol. 1, ed. Reipurth, B., p. 590
- Poglitsch et al. (2010) Poglitsch, A., Waelkens, C., Geis, N., Feuchtgruber, H., Vandenbussche, B., Rodriguez, L., Krause, O., Renotte, E., van Hoof, C., Saraceno, P., Cepa, J., Kerschbaum, F., Agnèse, P., Ali, B., Altieri, B., Andreani, P., Augueres, J.-L., Balog, Z., Barl, L., Bauer, O. H., Belbachir, N., Benedettini, M., Billot, N., Boulade, O., Bischof, H., Blommaert, J., Callut, E., Cara, C., Cerulli, R., Cesarsky, D., Contursi, A., Creten, Y., De Meester, W., Doublier, V., Doumayrou, E., Duband, L., Exter, K., Genzel, R., Gillis, J.-M., Grözinger, U., Henning, T., Herreros, J., Huygen, R., Inguscio, M., Jakob, G., Jamar, C., Jean, C., de Jong, J., Katterloher, R., Kiss, C., Klaas, U., Lemke, D., Lutz, D., Madden, S., Marquet, B., Martignac, J., Mazy, A., Merken, P., Montfort, F., Morbidelli, L., Müller, T., Nielbock, M., Okumura, K., Orfei, R., Ottensamer, R., Pezzuto, S., Popesso, P., Putzeys, J., Regibo, S., Reveret, V., Royer, P., Sauvage, M., Schreiber, J., Stegmaier, J., Schmitt, D., Schubert, J., Sturm, E., Thiel, M., Tofani, G., Vavrek, R., Wetzstein, M., Wieprecht, E., and Wiezorrek, E. 2010, A&A, 518L, 2
- Poteet et al. (2011) Poteet, C. A., Megeath, S. T., Watson, D. M., Calvet, N., Remming, I. S., McClure, M. K., Sargent, B. A., Fischer, W. J., Furlan, E., Allen, L. E., Bjorkman, J. E., Hartmann, L., Muzerolle, J., Tobin, J. J., and Ali, B. 2011, ApJ, 733, 32
- Reach et al. (2005) Reach, W. T., Megeath, S. T., Cohen, M., Hora, J., Carey, S., Surace, J., Willner, S. P., Barmby, P., Wilson, G., Glaccum, W., Lowrance, P., Marengo, M., Fazio, G. G. 2005, PASP, 117, 978
- Reipurth, Rodríguez & Chini (1999) Reipurth, B., Rodríguez, L. F., and Chini, R. 1999, AJ, 118, 983
- Sandstrom et al. (2007) Sandstrom, K. M., Peek, J. E. G., Bower, G. C., Bolatto, A. D., and Plambeck, R. L. 2007, ApJ, 667, 1161
- Shimajiri et al. (2008) Shimajiri, Y., Takahashi, S., Takakuwa, S., Saito, M., and Kawabe, R. 2008, ApJ, 683, 255
- Skrutskie et al. (2006) Skrutskie, M. F., Cutri, R. M., Stiening, R., Weinberg, M. D., Schneider, S., Carpenter, J. M., Beichman, C., Capps, R., Chester, T., Elias, J., Huchra, J., Liebert, J., Lonsdale, C., Monet, D. G., Price, S., Seitzer, P., Jarrett, T., Kirkpatrick, J. D., Gizis, J. E., Howard, E., Evans, T., Fowler, J., Fullmer, L., Hurt, R., Light, R., Kopan, E. L., Marsh, K. A., McCallon, H. L., Tam, R., Van Dyk, S., and Wheelock, S. 2006, AJ, 131, 1163
- Stanke et al. (2010) Stanke, T., Stutz, A. M., Tobin, J. J., Ali, B., Megeath, S. T., Krause, O., Linz, H., Allen, L., Bergin, E., Calvet, N., di Francesco, J., Fischer, W. J., Furlan, E., Hartmann, L., Henning, T., Manoj, P., Maret, S., Muzerolle, J., Myers, P. C., Neufeld, D., Osorio, M., Pontoppidan, K., Poteet, C. A., Watson, D. M., and Wilson, T. 2010, A&A, 518L, 94
- Thronson et al. (1978) Thronson, H. A., Jr., Harper, D. A., Keene, J., Loewenstein, R. F., Moseley, H., and Telesco, C. M. 1978, AJ, 83, 492
- Young et al. (2012) Young, E. T., Becklin, E. E., De Buizer, J. M., Herter, T. L., Güsten, R., Dunham, E. W., Sankrit, R., Andersson, B-G, Backman, D., Burgdorf, M., Casey, S. C., Erikson, E. F., Gehrz, R. D., Harper, D. A., Helton, L. A., Horner, S. D., Howard, C. D., Klein, R., Krabbe, A., Marcum, P. M., McLean, I. S., Meyer, A. W., Miles, J. W., Reach, W. T., Rho, J., Richter, M. J., Roellig, T. L.,Roeser, H-P, Sandell, G., Savage, M. L., Smith, E. C., Shuping, R. Y., Temi, P., Vacca, W. D., Vaillancourt, J. E., Wolf, J., and Zinnecker, H 2012, ApJ, this issue
| SOF | HOPS | RA (2000) | DEC (2000) | IRS | 2MASS J | MIR | FIR | CSO | VLA |
|---|---|---|---|---|---|---|---|---|---|
| 1 | 66 | 05:35:26.84 | -05:09:24.7 | 2 | 05352683-0509244 | 20 | |||
| 2N | 370 | 05:35:27.57 | -05:09:33.8 | 4N | 05352762-0509337 | 21 | 3 | 22 | 11 |
| 3 | 108 | 05:35:27.08 | -05:10:00.3 | 4 | 23 | 12 | |||
| 4 | 369 | 05:35:26.98 | -05:10:17.4 | 3 | 05352696-0510173 | 27 | 5 | 24 | |
| 5 | 368 | 05:35:24.72 | -05:10:29.9 | 1 | 05352477-0510296 | 28 | 13 | ||
| 6 | 05:35:26.89 | -05:11:07.6 | 05352686-0511076 | ||||||
| 7 | 60 | 05:35:23.39 | -05:12:02.6 | 05352341-0512023 | 29 | 6b | 25 | ||
| 8 | 59 | 05:35:20.14 | -05:13:15.7 | 05352014-0513156 | 31+32 | 6d | 30 |
| Source | ||||||||||||
|---|---|---|---|---|---|---|---|---|---|---|---|---|
| SOF 1 | ||||||||||||
| SOF 2N | ||||||||||||
| SOF 3 | ||||||||||||
| SOF 4 | ||||||||||||
| SOF 5 | ||||||||||||
| SOF 6 | ||||||||||||
| SOF 7 | ||||||||||||
| SOF 8 |
| Envelope | Disk | ||||||||||
|---|---|---|---|---|---|---|---|---|---|---|---|
| Source | bbValues are likely upper limits because of possible contamination by nearby sources of FIR/submm flux densities. | b, cb, cfootnotemark: | |||||||||
| () | (degrees) | (AU) | (degrees) | (AU) | ( g cm-3) | ( yr-1) | () | (AU) | () | ||
| SOF 1 | 60 | 40 | 40 | 1 | |||||||
| SOF 2N | 300 | 80 | 3 | 300 | 40 | 5000 | 1.5 | 3 | 0.8 | 280 | 1.6 |
| SOF 3 | 50 | 50 | 2 | 380 | 8 | 5000 | 20 | 4 | 10 | 380 | 0.6 |
| SOF 3ddFit obtained when is taken as an upper limit. | 30 | 70 | 2 | 380 | 8 | 5000 | 5 | 1 | 2.5 | 380 | 0.6 |
| SOF 4eeModeled as a double source. In one of the sources the emission is dominated by a star+envelope and in the other source it is dominated by a star+disk. | 20 | 70 | 2.5 | 100 | 0 | 5000 | 9.0 | 2 | 4 | ||
| 60 | 40 | 40 | 1.5 | ||||||||
| SOF 5 | 40 | 50 | 2.5 | 100 | 5 | 10000 | 1.5 | 3 | 2 | 100 | 0.2 |
| SOF 7 | 15 | 70 | 2.5 | 100 | 30 | 5000 | 2.0 | 4 | 1 | 100 | 0.8 |
| SOF 8eeModeled as a double source. In one of the sources the emission is dominated by a star+envelope and in the other source it is dominated by a star+disk. | 7 | 50 | 2 | 100 | 0 | 5000 | 6.0 | 1 | 3 | ||
| 130 | 30 | 100 | 0.1 | ||||||||