CRIRES-POP††thanks: Based on observations collected at the European Organisation for Astronomical Research in the Southern Hemisphere, Chile (084.D-0912, 085.D-0161, 086.D-0066, and 087.D-0195. The spectra presented in Figs. 3 to 15 are available at the CDS via anonymous ftp to cdsarc.u-strasbg.fr (130.79.128.5) or via http://cdsweb.u-strasbg.fr/cgi-bin/qcat?J/A+A/
Abstract
Context. New instrumental capabilities and the wealth of astrophysical information extractable from the near-infrared wavelength region have led to a growing interest in the field of high resolution spectroscopy at 1–5 m.
Aims. We aim to provide a library of observed high-resolution and high signal-to-noise-ratio near-infrared spectra of stars of various types throughout the Hertzsprung-Russell diagram. This is needed for the exploration of spectral features in this wavelength range and for comparison of reference targets with observations and models.
Methods. High quality spectra were obtained using the CRIRES near-infrared spectrograph at ESO’s VLT covering the range from 0.97 m to 5.3 m at high spectral resolution. Accurate wavelength calibration and correction for of telluric lines were performed by fitting synthetic transmission spectra for the Earth’s atmosphere to each spectrum individually.
Results. We describe the observational strategy and the current status and content of the library which includes 13 objects. The first examples of finally reduced spectra are presented. This publication will serve as a reference paper to introduce the library to the community and explore the extensive amount of material.
Key Words.:
Atlases - Infrared: stars - Stars: atmospheres - Line: identification - Methods: data analysis - Techniques: spectroscopic1 Introduction
After a long-term reliance on the visual spectral region, it has been clearly demonstrated in the past two decades that the near- and mid-infrared spectral ranges will play a leading role in many prime areas of astronomical research for the coming decades. This part of the spectrum enables observation of a universe of ”cool” phenomena, including disks, planets, or the extended atmospheres of evolved stars. Electronic transitions of atoms, and in the case of molecules rotation-vibration transitions, produce lines in the near-infrared (NIR), among them indicators for obtaining isotopic ratios and resonance lines of s-process and rare earth elements. For the coolest stars, the optical spectrum is dominated by molecular lines, limiting the extent to which chemical compositions can be determined owing to blending. At infrared (IR) wavelengths there are spectral windows that are relatively free of molecular absorption, where lines from heavy elements are located. Furthermore, the reduced effects of extinction in the NIR compared to the visual range allow us to access more distant stars.
To fully understand the information contained in the NIR spectral range, high-resolution spectroscopy is mandatory. Considerable progress in instrument development has been achieved over the past twenty years, resulting in the current availability of efficient spectrographs for the NIR. The lack of high quality (high spectral resolution and high signal-to-noise ratio – S/N) stellar spectra in the IR has meant that spectroscopists have concentrated their resources on the strongest features observed at lower spectral resolution in the IR or in other wavelength regions. As a result, line data for many elements, but especially the post-iron group elements, are severely lacking and those that exist are predominantly the result of theoretical calculations. The atlases of the solar spectrum (Wallace et al. Wallace96 (1996), Delbouille et al. DRN73 (1973)) and the K giant Arcturus (Hinkle et al. arcturus (1995)) illustrated the value of a stellar reference spectrum at high spectral resolution and high S/N.
At high resolving power (), an inventory of complete NIR stellar spectra across the Hertzsprung-Russell diagram (HRD) is presently unavailable. Spectra of both high spectral resolution and high S/N are key demands for a list of primary science cases in addition to the above-mentioned exploration of weak atomic lines of hardly studied elements. In the case of molecular lines, both prerequisites are needed to study isotopic ratios, which open a window to the nuclear fusion processes in the stellar intererior. Another topic that can be investigated with the help of such data are small velocity shifts between high and low excitation lines or asymmetries in the line profiles that hint towards velocity fields in a star’s atmosphere. Weak emission features that need to be clearly distinguished from absorption components are promising tools to study circumstellar material. Even for observations at lower resolution, the availability of a high resolution reference library is required to interpret the results.
We therefore started to build such a library of complete (full wavelength coverage from 1 to 5 m), high S/N NIR spectra of representatives of various parts of the HRD using the spectrograph CRIRES (CRyogenic high-resolution InfraRed Echelle Spectrograph; Käufl et al. crires (2004)) at ESO’s VLT. With our chosen setup, it will be possible to study lines fainter than 1% of the continuum in strength, and to detect line asymmetries at this level. The availability of this library provides an unprecedented database for the testing of stellar model atmopheres, the improvement of line lists of various molecules and atoms, the identification of weak lines, and the proper correction of telluric absorption features. At this point, an almost complete wavelength coverage has been secured for 13 stars. The total library will consist of about 25 objects. Further data will become available continuously via the dedicated webpage of the project111http://www.univie.ac.at/crirespop. The intention of this paper is to introduce the library to the astronomical community, discuss aspects of the data reduction, present examples, and provide a reference for future exploitation of the library spectra.
2 Observing strategy and instrument settings
CRIRES is a NIR high-resolution echelle spectrograph operating at from 0.96 to 5.3 m. An adaptive optics (AO) system using a curvature wave front sensor can be utilized during observations. The instrument works in a near-Littrow configuration. Variable entrance slit widths from 0.05 to 3.0 arcsec are offered, although in practice only the 0.2 to 0.4 arcsec slits are typically used. Active guiding on the slit image in a NIR filter (, , or , matching as close as possible the wavelength setting of the spectrograph) is part of the standard observing mode. CRIRES covers a comparably small wavelength range of a few tens of nm per observational setting (depending on the central wavelength). To observe the entire range from below 1 to above 5 m thus requires about 200 settings and a considerable amount of observing time. A complete scan of a star with mag reaching a S/N of at least 200 throughout the entire spectral range takes almost nine hours and is strongly dominated by observational overheads (close to 80 %). To achieve our goal of a library covering all main spectral types and luminosity classes, we limited the list of possible targets to rather bright sources (), and designed the project as a filler programme at the Very Large Telescope (VLT) capable of using observing time with non-photometric seeing conditions.
The selection of the targets was driven by the following criteria: they are (1) representative of a specific spectral type and luminosity class or a specific abundance pattern; (2) of sufficient brightness in the CRIRES range; (3) of very low rotational velocity (typically less than 10 km s-1); (4) found to have no large amplitude variability (less than 1 mag in ); (5) part of the UVES-POP222UVES-POP is an electronic library of high-resolution optical spectra obtained with UVES, the Ultraviolet-Visual Echelle Spectrograph at the VLT in the framework of a Paranal Observatory Project. sample (Bagnulo et al. bagnulo03 (2003)) allowing to achieve complete wavelength coverage from 300 nm to 5 m . The latter criterion could not be fulfilled in all cases owing to the lack of stars suitable for observations in the NIR range. Furthermore, no suitable target exists to represent spectral type O, or Wolf-Rayet stars at NIR wavelengths. We included targets with non-standard chemistry, such as a carbon star and a chemically peculiar Ap star. The list of stars observed to date can be found in Table 1, and a brief description of each star is given in Sect. 4. Observations continue to be performed, and a complete list of the stars in the library will be presented elsewhere at a later date.
All wavelength settings between 950 nm and 5300 nm offered by CRIRES were observed, except for those located in-between the atmospheric windows, namely 1350–1450 nm, 1800–1984 nm, 2510–3425 nm, and 4190–4620 nm. This provided a list of approximately 200 settings per target. The wavelength ranges of the settings overlapped with each other to close the gaps between the detector chips. This had the positive side effect of increasing the S/N of the final data and allowing us to check for instrumental problems. For a few hot stars, we had not yet observed the -band, because we decided to take a closer look at the -band spectrum of one hot star first and identify the most promising wavelength settings for observations. This would allow us to optimise the use of our observing time.
For CRIRES-POP, we chose a slit width of 0.2 arcsec, which gives a measured resolving power at 2172 nm of (Smoker smoker11 (2011)). The AO system was not used because the actual spectral resolution is determined by the entrance slit and does not depend on the AO correction.
A pre-dispersion prism and an intermediate slit are used within CRIRES to limit the wavelength range to a single order before light enters the high-resolution spectrograph, which consists of a 31.6 lines/mm, 63.5 degrees blaze echelle grating. The science detector is a 4x1 mosaic of Aladdin III InSb arrays. In total, 4096x512 pixels are read-out; the gap between two successive arrays is equivalent to 280 pixels. The detector has several defects, particularly a diagonal scratch on the right part of array 2, a vertical line of bad pixels near the centre of array 4, and a larger number of bad pixels at the very left of array 4. Almost all of these cosmetic defects will be corrected in the final data set by using spectra obtained at different nod positions and overlapping wavelength settings.
There is also an odd-even like pattern present that is aligned with the read-out direction. This is in the dispersion direction for arrays 1 and 4 and in cross-dispersion direction for arrays 2 and 3. The effect can be almost completely removed (with residuals in the extracted flux of 1%) by flat-fielding and applying a correction for detector non-linearity (see Smoker smoker11 (2011), Jung Jung10 (2010), Uttenthaler Uttenthaler07 (2007)).
At shorter wavelengths (typically below 1.2 m), an optical ghost is occasionally present, which is caused by a reflection from the science detector back to the grating. It often does not cancel out completely via nodding and is visible as an artificial absorption feature in extracted spectra.
Integration times were chosen in accordance with the CRIRES exposure time calculator offered by ESO to achieve a S/N of at least 200 in average seeing conditions. Observations were always done in an ABBA nodding pattern with typically a 15” nod throw to account for the background emission. Below 2.5 m, total integration times per setting were between 10 s for the brightest stars and 120 s for the faintest. In the -band, total integration times were between 60 s and 360 s. For the weaker stars, this was split into several integrations at each nodding position and up to six nodding cycles. Finally, for the -band, integration times of up to 1200 s were used, again split into several integrations and nodding cycles because of the high thermal background contribution. Between 1 and 23 wavelength settings were combined into observing blocks of 20 to 60 minutes length. We used the no-AO mode. Calibration data were taken during day time after each observing night in which our program was executed.
Since CRIRES-POP was designed as a filler programme, the various wavelength ranges of a given star were observed over up to 1.5 years. A requirement for the selection was, thus, that a target was of constant brightness, or only a mildly variable star. No airmass limit was set, although we note that only a small fraction of observations were obtained at an airmass above 2.
3 Data reduction
3.1 First step: standard CRIRES pipeline
Our CRIRES-POP observations were reduced with recipes available from the ESO CRIRES data reduction pipeline 2.0.0 (Jung Jung10 (2010)). Raw science frames were flat-fielded, and corrected for both non-linear detector response and bad pixels. Frames from different nodding positions were shifted and combined. Finally, the spectrum was extracted and wavelength calibrated. The wavelength calibration was determined from either daytime ThAr arc lamp exposures for settings below 2.4 m or sky emission lines in the science exposures (above 2.4 m). We found a few instrumental artefacts that in our data and that could not be removed during the reduction process. Neighbouring echelle orders partially overlap at shorter wavelengths, which means that part of the spectrum for a given order can be contaminated by adjacent orders. This is essentially true below 1.3 m, where data from detectors 1 and 4 cannot be used. When observing spectral regions with fully saturated telluric features, the actually observed line profiles do typically show 1-3 % of residual flux in the absorption cores. This is due to in-dispersion straylight produced by the CRIRES grating. The effect can be modelled quantitatively based on line-profiles obtained with deep integrations of neon or krypton arc calibration lamps when the entrance slit is illuminated uniformly. When observing a star, i.e. a point-like source, the spatial distribution of the scattered light flux in the cross-dispersion direction along the slit then differs from the normal spatial profile of the stellar continuum. Thus, the optimum extraction algorithm employed cannot easily extract precise fluxes from the center of absorption lines. Moreover, owing to the field-dependent tilt between straylight direction and the stellar continuum, there is no easy way to model the effect. Hence, the effect cannot be corrected for yet, regardless of whether it is caused by telluric absorption or absorption lines in the stellar atmosphere.
Wavelength calibration is a difficult task for CRIRES because of the rather small spectral ranges that are measured on each detector. Wavelength calibration was performed separately for each detector and required the availability of a sufficient number of calibration lines in the respective spectral region. This was not always the case, especially when a ThAr exposure was used for calibration. Then a default linear solution was applied. The situation, however, might have been improved by using telluric lines (see below).
Small differences in the wavelength calibration of the two nodded images resulted in a slight degradation of the spectral resolution of the combined image that depended on the nodding amplitude and specific wavelength setting. We verified on actual data that this broadening was smaller than two pixels (i.e. 5.10-3 nm/pixel at 1 m or 25.10-3 nm/pixel at 5 m) for the observing strategy used for CRIRES-POP and that the final spectral resolution was on average degraded by about 10–20% (R80 000 to 90 000). Future releases of the CRIRES-POP data will use a new CRIRES pipeline recently released by ESO (version 2.1.3), that is capable of reducing spectra from A and B nodding positions separately. In the future we will make use of this feature to reduce spectra where the degradation to the resolution introduced by the slight curvature limits the final data quality.
3.2 Second step: telluric correction using a model of Earth’s atmosphere
A general problem in almost all NIR spectra is telluric absorption lines. Traditionally, they are divided out of a science spectrum using a hot (i.e. feature-poor) ”standard” star spectrum. In the case of CRIRES-POP, observations of telluric standards would have been impractical for two reasons. First, it would have led to an enormous amount of calibration measurements, taking into account the large number of wavelength settings involved and the need to observe the target and the standard star close in time and airmass. Second, telluric standard stars contain a number of spectral features, some of them unidentified, such that they do not provide ideal ’featureless’ spectra and would compromise the spectra of our science targets. This is also a reason why we included early-type stars in our program, i.e. to explore the intrinsic features of these stars in the IR. Thus, we decided against observing telluric standard stars but chose a different approach, to model the telluric spectrum at the time of observation.
Model spectra of the telluric transmission can be calculated with freely available radiative transfer codes (e.g. the Line-by-Line Radiative Transfer Model [LBLRTM] or the Reference Forward Model [RFM]), using a database of molecular transition parameters (e.g., HITRAN, the HIgh-Resolution TRANsmission molecular absorption database) and atmospheric profiles (e.g. GDAS333Global Data Assimilation System http://ready.arl.noaa.gov/READYamet.php). The modelling of CRIRES spectra, as described in Seifahrt et al. (Sei10 (2010)) and Smette et al. (smette10 (2010)), involves the modelling of the instrumental profile, the scaling of the column densities of the trace gases in the Earth’s atmosphere, as well as a wavelength solution for each CRIRES chip as a second or third order polynomial. Hence, this approach has the additional advantage of providing us with a precise wavelength calibration that is often difficult to obtain with standard calibration techniques.
For early-type stars with a clear continuum and few spectral features, fitting of telluric absorption models is semi-automatic. Late-type stars with an abundance of stellar lines require a more restricted type of modelling and manual intervention caused by the strong blending of telluric and stellar features. In extreme cases, the instrumental profile and abundance scaling factors have to be fixed based on observations of early-type stars in the same night and only a solution of the wavelength vector and the most variable features (i.e. water vapor) can be obtained for the target. Overlapping wavelength regions on different chips obtained in neighbouring settings provide an important sanity check to the modelling in these cases.
The current standard of line data of relevant molecules in the Earth’s atmosphere is set by the HITRAN consortium (Rothman et al. Roth08 (2008)). We were able to confront the model spectra with our high-quality CRIRES spectra (of hot stars, e.g. Sco, e Vel), to test the quality of the available molecular data. Similar tests of molecular data had already been done by some of us for a few selected CRIRES wavelength settings (Seifahrt et al. Sei10 (2010); Smette et al. smette10 (2010)). With the current CRIRES-POP data base, however, it becomes feasible to test molecular data for almost the entire wavelength range between 0.97 m and 5.3 m (a few small ranges were omitted because they were affected by heavy telluric absorption). We are in contact with the HITRAN consortium to work out a procedure for a potential improvement of the line data. In a first step, the poorly-fit lines will be catalogued. If there is a line that deviates from its observed position or strength, it can be flagged as suspicious. The HITRAN list has quality indicators for each line in the database, that can be used to evaluate whether the observed deviation is expected. If the line is consistently off by more than the expected uncertainty listed in HITRAN in several observed spectra, this line deserves further scrutiny. The wealth of information contained in the CRIRES-POP database turns this effort to improve molecular line data into a considerable project of its own, which will have a large legacy value. Meanwhile, a moderate amount of back-fitting of line parameters in terms of position and strength can improve the telluric fitting for our project. For the final data set, we aim to provide telluric corrections for the entire wavelength range covered by our observations where telluric lines are detected at the 2 level. We expect the estimated performance of the correction to be at or above the level shown in Seifahrt et al. (Sei10 (2010)), especially when the discussed back-fitting of line parameters is applied.
3.3 Combining individual spectral settings
Once all individual one-dimensional (1D) spectra from a single star had been extracted (Sec. 3.1) and cleaned of telluric absorption features (Sec. 3.2), we combined those spectra into a single data product. At this step, we used the spectral overlap of the individual settings to improve the final SNR, and to exclude regions that show contamination from neighbouring orders, optical ghosts, or other data defects (e.g. bad pixels). For spectral regions that include telluric absoption lines, we used the superior wavelength calibration delivered by the telluric modelling and combine all spectra after mapping them onto a common wavelength vector. At this stage, we also took into account any velocity shifts resulting from obtaining the various parts of the spectra at different epochs. The combination of several adjacent settings into one hour observing blocks ensured that in most cases only small corrections were needed. For the final library the spectra will be shifted in wavelength to zero heliocentric velocity.
4 Library content
In the following sections, we summarised the information from the literature about the global parameters and any determined atmospheric parameters for these stars.444The latest version of the CRIRES data for these stars is available via http://www.univie.ac.at/crirespop. The final release of the data will consist of the raw, pipeline-reduced, and telluric-absorption-corrected spectra for the complete observed sample.
| HD number | other names | spectral type | RA (2000) | DE (2000) | UVES-POP?a𝑎aa𝑎ahttp://www.sc.eso.org/santiago/uvespop/ | observing | |
|---|---|---|---|---|---|---|---|
| (mag) | periods | ||||||
| 149438 | $τ$ Sco, HR 6165 | B0.2 V | 16:35:52 | 28:12:58 | 3.60 | n | 2007b𝑏bb𝑏bPart of the spectrum was obtained within proposal P79.D-0810 and was kindly provided for inclusion in the CRIRES-POP library. / 20092011 |
| 47105 | $γ$ Gem, HR 2421 | A0 IV | 06:37:42 | +16:23:57 | 1.92 | n | 2010 |
| 118022c𝑐cc𝑐cNo -band spectrum available at the present time. | Vir, HR 5105 CW Vir 78 Vir | A1p | 13:34:08 | +03:39:32 | 4.88 | y | 20102011 |
| 73634 | e Vel, HR 3426 | A6 II | 08:37:39 | 42:59:21 | 3.6 | y | 20092010 |
| 20010 | $α$ For, HR 963, LHS 1515 | F8V | 03:12:05 | 28:59:15 | 2.32 | y | 20092010 |
| 109379 | $β$ Crv, HR 4786 | G5 II | 12:34:23 | 23:23:48 | 0.8 | y | 20102011 |
| 83240 | 10 Leo, HR 3827 | K1 III | 09:37:13 | +06:50:09 | 2.66 | y | 20092010 |
| 225212 | 3 Cet, HR 9103 | K3 I | 00:04:30 | 10:30:34 | 1.4 | y | 20102011 |
| 49331 | HR 2508 | M1 I | 06:47:37 | 08:59:55 | 0.6 | y | 20102011 |
| 224935 | HR 9089, YY Psc | M3 III | 00:01:58 | 06:00:51 | -0.5 | y | 20092010 |
| Barnard’s star, GJ 699, V2500 Oph | M4 V | 17:57:48 | +04:41:36 | 4.52 | n | 20102011 | |
| 61913 | HR 2967, NZ Gem | S | 07:42:03 | +14:12:31 | 0.56 | y | 20102011 |
| 134453 | HR 5644, X TrA | C | 15:14:19 | 70:04:46 | -0.6 | y | 2010 |
4.1 Current content
4.1.1 HD 149438 ($τ$ Sco), B0.2 V
At a distance of about 150 pc, Sco (spectral type B0.2 V) is one of the brightest young massive stars of the southern Sco-Cen association. It is therefore one of the most intensely studied early-type stars, with observations reported from the X-ray regime to the radio. Notable data sets are the pioneering high-resolution spectral atlases obtained with both XMM-Newton in X-rays (Mewe et al. Meweetal03 (2003)) and with the Copernicus satellite in the UV (Rogerson & Upson RoUp77 (1977)). Unusual stellar wind characteristics and unusually hard X-ray emission have been revealed at these short wavelengths despite the star’s inconspicuousness in the optical spectrum. This is likely because of pronounced shocks arising from its clumped stellar wind (Howk et al. Howketal00 (2000)). Moreover, the star continues to offer observational surprises, such as the detection of its complex magnetic field by Donati et al. (Donatietal06 (2006)). Sco has been the subject of numerous quantitative model atmosphere analyses, starting with the first detailed spectral investigation of any star besides the Sun, by Unsöld (Unsoeld42 (1942)). A summary of stellar parameters determined in the more recent literature is given by Simón-Díaz et al. (Simon-Diazetal06 (2006)) and Nieva & Przybilla (np08 (2008)). The most comprehensive non-LTE study to date found an effective temperature of = 32 000300 K, surface gravity = 4.300.05 (cgs units), microturbulence = 51 km s-1, projected equatorial rotational velocity and macroturbulence of both 44 km s-1, and elemental abundances typical of the massive star population in the solar neighbourhood (Przybilla et al. Przybillaetal08 (2008)), close to solar values. Exceptions are the light elements carbon and nitrogen, which indicate a high degree of mixing of the surface layers with CN-processed matter from the stellar core (Przybilla et al. Przybillaetal10 (2010)).
The first global spectral synthesis modeling for Sco of an observed spectrum of high quality in the optical was presented in Nieva & Przybilla (np11 (2011)). The observed spectrum was acquired with FEROS at high resolution (R=48 000) and high S/N (800 in the -band), and the global spectrum computed assuming non-LTE covers the wavelength region from 3900 Åto 6850 Å. A study of Sco in the NIR shows very good agreement of parameter determinations in comparison with the analysis in the optical. The He I 2.058 m and 2.11 m obtained with UKIRT/CGS4 (Mountain et al. mountain (1990)) could be perfectly recovered with non-LTE techniques (Nieva & Przybilla np07 (2007)). Further quantitative analyses of CRIRES data collected in 2007666The spectra of Sco obtained in the run 079.D-0810(A) have been incorporated to the CRIRES-POP database by kind agreement of Norbert Przybilla. and corrected for telluric features following Seifahrt et al. (Sei10 (2010)) found good agreement between data and models several hydrogen and helium lines, as well as metal lines, when adopting the stellar parameters and chemical abundances derived in the optical (Nieva et al. nieva09 (2009), nieva11 (2011)).
4.1.2 HD 47105 ($γ$ Gem), A0 IV
Also known as Alhena, Gem is a nearby A0 IV star. Alhena has been found to be a wide binary from both spectroscopic (Pourbaix et al. PTB04 (2004)) and astrometric (Jancart et al. JJBP05 (2005)) measurements, that has an orbital period of 4614.5 d and an orbital eccentricity of = 0.89. The Hipparcos measurements (van Leeuwen Hipnew (2007)) inferred a distance of 33.5 pc with an uncertainty of approximately 2.5 pc. Its rotational velocity was determined to be 15 km s-1 (Royer et al. RZG07 (2007)), and its heliocentric radial velocity 12.5 km s-1 (Valdes et al. VGRSB04 (2004)). Zorec et al. (zorec09 (2009)) derived =9040280 K for this object using the bolometric flux method. Landstreet et al. (landstreet09 (2009)) used Strömgren and Geneva photometry to determine =9150 K and = 3.5. From high resolution optical spectra, they measured = 11 0.4 km s-1 with a microturbulence = 1.20.4 km s-1. According to their analysis, the iron abundance is close to the solar value. This agrees with the results of Adelman & Unsuree (AU07 (2007)), who found [Fe/H]0.110.18. No UVES-POP spectrum is available for this star, but it is part of the spectral library produced by Valdes et al. (VGRSB04 (2004)) covering the wavelength range between 3465 Å and 9450 Å at a resolution of 1 Å FWHM. Flux-calibrated low-resolution , , and band spectra of this star were presented in the catalogue of Ranade et al. (ranade07 (2007)).
4.1.3 HD 118022 ($o$ Vir), A1p
o Vir (A1p) has the distinction of being the star for which the pioneering work of Babcock (babcock47 (1947)) employed the Zeeman effect to determine the magnetic field. Its magnetic field has since been well-studied (mean magnetic field = 3.0 kG, Ryabchickova et al. RKB08 (2008)), in addition to other atmospheric phenomena. An effective temperature of 9460 K was determined by Netopil et al. (NPMNH08 (2008)) in good agreement with the value used in the analysis of Ryabchickova et al. (RKB08 (2008)). The latter also found = 4.0. Its light curve displays a small amplitude variation (0.07 mag in ), and it is classified as an CVn type variable, its variability being caused by the rotation of an inhomogeneous stellar surface. Its measured value of is 10 km s-1 (Ryabchikova et al. RKB08 (2008)), which we verified by performing a synthetic spectrum analysis of UVES and CRIRES data. The optical spectrum displays a richness caused by the rare earth elements, which appears clearly evident at NIR wavelengths as broad but shallow features. The presence of Eu ii near 1 m was noted by Wahlgren (wahlgren11 (2011)). The IR spectrum will be utilised to identify atomic lines from heavy elements, and lines for magnetic field studies in chemically peculiar stars.
4.1.4 HD 73634 (e Vel), A6 II
The bright giant e Vel (HR 3426) was proposed as a low A6 II spectral standard by Gray & Garrison (GrGa89 (1989)). The UVES-POP data illustrate the sharp-lined nature of the spectrum, along with several broader, weak emission features at red wavelengths. From our synthetic spectrum fitting of the UVES-POP spectrum, was found to be 8.50.2 km s-1. Basic data derived from standard calibrations were presented by Snow et al. (Snowetal94 (1994)), namely = 8100 K, = 2.8, and rv = 19 km s-1.
4.1.5 HD 20010 ($α$ For), F8 V
Saffe et al. (Saffe08 (2008)) derived values for and of 6094 K (6226 K) and 4.09 (3.77) dex, respectively (depending on the --colour relation used). According to these values, the metallicity [Fe/H] is 0.64 (0.62). A more comprehensive spectroscopic analysis by Gonzalez et al. (Gonzalez10 (2010)) found = 617035 K, = 3.800.08 and [Fe/H] = 0.210.03, and Bruntt et al. (Bruntt10 (2010)) derived = 6015 K, = 3.80, = 3.9 km s-1, = 3.7 km s-1, and [Fe/H] = 0.28, with the latter value also being representative of many more chemical species. A parallax of 70.24 mas was derived from Hipparcos observations (van Leeuwen Hipnew (2007)), suggesting a distance of only 14 pc. Oudmaijer et al. (oud92 (1992)) searched for possible dust around this star using IRAS data, but found only a very small IR excess.
4.1.6 HD 109379 ($β$ Crv), G5 II
The most recent determination of the parameters of this G5 II star was presented by Lyubmikov et al. (LLRRP10 (2010)), giving = 510080 K, = 2.520.03, and [Fe/H] +0.15. Using the Hipparcos parallax (van Leeuwen Hipnew (2007)), a distance of 44.6 pc was derived, and a mass of 3.70.1 determined. The study of Takeda et al. (TSM08 (2008)) found similar values of = 5145 K, = 2.56, and [Fe/H] = 0.01, in addition to log = 2.23 and M=3.31 . Older investigations (e.g. Luck & Wepfer LW95 (1995), Brown et al. BSLD89 (1989)) came to similar conclusions. The heliocentric radial velocity was measured to be 8 km s-1 (e.g. Buscombe & Morris BM58 (1958)), and was around 4 km s-1 (Gray Gray81 (1981), Fekel Fekel97 (1997)). A radius of 11 is listed in Pasinetti Fracassini et al. (pasin01 (2001)).
While the C/O ratio was found to be close to the solar value, the two elements C and O seem to be depleted in this star relative to the solar value according to the analysis of Luck & Wepfer (LW95 (1995)). An earlier claim of an enrichment in barium (Keenan & Pitts KP80 (1980)) could not be confirmed (Eggen & Iben EI91 (1991)).
4.1.7 HD 83240 (10 Leo), K1 III
Stellar parameters for this K1 giant, also known as the bright star HR 3827 or 10 Leo, were derived by Soubiran et al. (soubi08 (2008)). They found and to be 4682 K and 2.45 dex, respectively. Soubiran et al. evaluated a metallicity [Fe/H] of 0.02. Compared to Arcturus, which is thought to be a metal-poor object (e.g. Peterson et al. peters93 (1993)), we thus have here a K giant reference spectrum of solar metallicity. The Hipparcos distance is 69 pc. The star is a spectroscopic binary with an orbital period of 28344 d and =+20.00.1 km s-1 (Griffin griffi85 (1985)). No trace of the secondary star was detected, the orbital parameters indicate that it is of low mass. Pasinetti Fracassini et al. (pasin01 (2001)) listed a radius of 14 for this object. No indication of light variability was found (Percy percy93 (1993)).
Mishenina et al. (mishe06 (2006)) measured abundances of various key elements from the spectrum of HD 83240. They found that = 8.25, = 8.2, = 8.75, and = 1.1. This means a slight underabundance in carbon and an overabundance in nitrogen, which agrees with a post first-dredge-up red giant. Silicon, calcium, and nickel are solar-like in abundance. In a second paper, Mishenina et al. (mishe07 (2007)) provided abundances for various neutron-capture elements. None of the element abundances differed from the solar value by more than the typical error given by the authors.
4.1.8 HD 225212, K3 I
The most recent and most detailed study of the global parameters of this K-type supergiant was provided by Smiljanic et al. (SBDM06 (2006)), finding = 4052 K, = 0.75, = 2.95 km s-1, and [Fe/H] = +0.1. They derived = 4.42, and estimated a mass of this object of 7.0–7.9 . Their heliocentric radial velocity value of 42 km s-1 is in excellent agreement with other measurements in the literature (De Medeiros et al. DUBM02 (2002), Valdes et al. VGRSB04 (2004), Eaton & Williamson EW07 (2007)). Earlier studies of the stellar parameters found quite diverse results: van Paradijs (paradijs73 (1973)) measured a similar 4100 K, but a general overabundance of heavy elements by a factor of 1.6, while Luck & Bond (LB80 (1980)) derived for almost the same effective temperature a metallicity of [Fe/H] = 0.2. This scatter may result from the different values of the microturbulence used. Lower values for the temperature were suggested by Blum et al. (BRSO03 (2003), 3860 K) and Mallik (mallik99 (1999), 3689 K). Values very similar to the results by Smiljanic et al. (SBDM06 (2006)) can be found in the library of Sánchez-Blázquez et al. (SPJ06 (2006)).
Smiljanic et al. derived abundances of [C/Fe] = 0.14, [N/Fe] = +0.41, and [O/Fe] = 0.02. These findings agree with predictions for an atmospheric composition past first dredge-up for a non-rotating star. Consistently, a rotational velocity of 5.81 km s-1 has been measured (De Medeiros et al. DUBM02 (2002)).
No indications of binarity have been detected (Eggleton & Tokovinin ET08 (2008)). Koen & Eyer (KE02 (2002)) found evidence for a two hour variability with an amplitude of a few mmag from the epoch photometry of the Hipparcos catalogue. The parallax of this object is 1.560.31 mas (van Leeuwen Hipnew (2007)).
4.1.9 HD 49331, M1 I
Two studies were dedicated to the measurement of stellar parameters of this M supergiant. Smith & Lambert (SL86 (1986)) derived = 3600 K, = 0.7, and = 3.9. The Hipparcos distance leads to a somewhat brighter = 4.5 (using the brightness and the bolometric correction of Worthey & Lee WL11 (2011)). Smith & Lambert also determined the abundances of various elements and found [Fe/H] = +0.14, 12C/13C = 18, and 12C/16O = 0.32, with no indications for an enhancement in s-process elements. The more recent investigation of Wylie-De Boer & Cottrell (WC09 (2009)) confirmed temperature, value, and the slightly super-solar metallicity of HD 49331, but measured a higher C/O ratio of 0.54 and a mild enhancement of s-process elements. The latter result is in agreement with an early spectral classification of the star as MS due to enhanced bands of YO and ZrO (Yamashita yamashita (1967)). However, clear signs of technetium, a key indicator of recent third dredge-up, are missing (Little et al. LLMB (1987)).
A mean radial velocity of 26.7 km s-1 was measured by Brown et al. (BSL90 (1990)).
4.1.10 HD 224935 (YY Psc), M3 III
The bright, cool giant YY Psc (M3 III) has an accurate parallax determined by the Hipparcos satellite of 7.550.59 mas (distance of 132 pc, van Leeuwen Hipnew (2007)). According to the GCVS (Samus et al. 2007- (2010)), it displays irregular variability with an amplitude of 0.1 mag at visual wavelengths, which was confirmed by Hipparcos. Owing to the small amplitude of variability, we assumed that variability had no impact on the analysis of the CRIRES spectrum. The angular diameter of YY Psc was measured both via long baseline interferometry (Dyck et al. vvT98 (1998)) and by the lunar occultation technique (Fors et al. FRNP04 (2004)). Both methods provided a value close to 7 mas. Dyck et al. also derived = 3647184 K, and a similar temperature was found in the investigation of Dumm & Schild (DS98 (1998)), who listed a radius of 109 R☉ and a mass of 2.5 M☉. Studies by Sloan & Price (SP98 (1998)) and Kwok et al. (KVB97 (1997)) found YY Psc to be dust-free.
Eaton & Williamson (EW07 (2007)) measured a radial velocity of 12.050.43 km s-1 from a series of 103 observations. The rotation velocity, , was determined by Zamanov et al. (Zamanov08 (2008)) to be either 2.5 or 3.9 km s-1, depending on the method applied. Lazaro et al. (Lazaro91 (1991)) measured a 12C/13C ratio of ten from low dispersion IR spectra, with a carbon abundance that is deficient by [C/H] = 1.25, relative to the Sun. Using the CRIRES-POP spectrum for a preliminary synthetic spectrum analysis with a model of the parameters = 3500 K and = 1.0 (cgs), Wahlgren et al. (WLW11 (2011)) confirmed the 12C/13C value of Lazaro, but not the carbon abundance, which was found to be near solar in value. The abundances of both nitrogen and oxygen (both near solar) were also determined and enhancements for the heavy elements (Co, Ge, Sr, Cs, Ba, and Eu). Lines of Si, Y, and Zr were also identified in the CRIRES spectrum. The abundance of iron is determined to be solar. The value for is 4 km s-1.
4.1.11 Barnard's star (V2500 Oph, GJ 699), M4 V
Probably the most prominent star in the CRIRES-POP library is Barnard’s star (Barnard barnard06 (1906)), the star with the largest known proper motion. It is the brightest known M dwarf and the only observable M dwarf within our CRIRES-POP brightness limits. Stellar parameters found in the literature for this star agree very well. The most recent study of Chavez & Lambert (CL09 (2009)) measured =3134 K, = 5.1, = 0.6 km s-1, [Fe/H] = 0.8, and [Ti/H] = 0.61. Using flux ratios from various wavelength bands, Casagrande et al. (CFB08 (2008)) found = 314569 K, and Ségranasan et al. (SKFQ03 (2003)) derived = 316365 K, = 5.050.09, = 0.1580.008 , and = 0.1960.008 using VLTI measurements. Dawson & De Robertis (DD04 (2004)) determined a luminosity of = (3.460.1710-3 and = 3134102 K.
The star’s radial velocity was found to be 110.5 km s-1 (Nidever et al. NMBFV02 (2002)) with a very high degree of stability at the 3-5 m s-1 level (e.g. Bean et al. BSH10 (2010)). Owing to its proximity and large space motion, it shows a non-negligible amount of secular acceleration of approximately 4.5 m s-1 yr-1 (Kuerster et al. kuerst03 (2003)). Benedict et al. (bene98 (1998)) measured a rotation period of approximately 130 days for this star. The rotational velocity is thus very small and only upper limits have been reported (e.g., 2.8 km s-1, Mohanty & Basri MB03 (2003)). This old object (7–13 Gyr, Feltzing & Bensby FB08 (2008)) shows only a low level of magnetic activity (e.g. Hübsch et al. HSSV99 (1999)), although Paulson et al. (PAA06 (2006)) investigated a rare flare event on this star.
4.1.12 HD 61913, (NZ Gem), S
The spectral classification of this star is slightly unclear. It was classified as M3S by Keenan (keenan54 (1954)). Yamashita (yamashita (1967)) found that ZrO and YO were slightly enhanced, while Smith & Lambert (SL88 (1988)) found no enhancement in s-process elements. Nevertheless, the star is listed in several later papers among MS/S stars, and our own inspection of the UVES-POP spectrum indicates a spectral type of MS owing to the clearly visible ZrO bands. Famaey et al. (famaey (2005)) summarized data about this star’s distance and kinematics, namely d324 pc and rvhel=15.2 km s-1. This velocity is in good agreement with findings from Jorissen et al. (Jori98 (1998)). The latter authors also found some velocity jitter in this star, but no clear indication for binarity. Van Eck et al. (vanEck (1998)) derived an absolute bolometric magnitude of 401. Cenarro et al. (cenarro (2007)) calculated 3530 K and = 0.7 from the spectral type and luminosity class (M3II-III). NZ Gem shows no lines of technetium (Lebzelter & Hron LH03 (2003)), which suggests that any possible enhancement in s-process elements is due to an extrinsic enrichment. However, no indications for a binarity in this object were found in the study of Eggleton & Tokovinin (ET08 (2008)).
4.1.13 HD 134453 (X TrA), C
The group of C-rich stars is represented in our library by the bright star HR 5644 (X TrA). A spectral type C5,5 was assigned to this object (Wallerstein & Knapp WK98 (1998)). The star is an irregular variable with a maximum amplitude of 1 magnitude in the visual according to the GCVS (Samus et al. 2007- (2010)). Percy et al. (Percy09 (2009)) estimated a variability period of 500 days. In a multiplicity study of bright stars by Eggleton & Tokovinin (ET08 (2008)), the star is listed as a single object. A distance of 460 pc, based on the Hipparcos parallax, is given by Winters et al. (WLJNE03 (2003)). These authors also list a LSR-velocity for X TrA of 2.5 km s-1, corresponding to a heliocentric velocity of +2.5 km s-1. This is in agreement with measurements by Schöier & Olofsson (SO01 (2001)).
Kipper (Kipper04 (2004)) summarized earlier estimates of the star’s effective temperature and absolute bolometric magnitude, which he used to derive surface gravity and microturbulence from the UVES-POP spectrum. He determined the values of = 2700 K, = 6.0, = 0.8, and = 2.3 km s-1, respectively. According to Kipper’s analysis, X TrA seems to be slightly metal-poor ([Fe/H]0.5) with a supersolar abundance of the s-process elements Y and Zr. The carbon isotopic ratio 12C/13C was found to be 31. A C/O ratio of 1.1 was used for all carbon stars investigated by Kipper. The star probably displays lines of Tc (Little et al. LLMB (1987)), which we confirmed by inspecting the UVES-POP spectrum. Together with enhanced abundances of Y and Zr, this suggests that the star is an intrinsic AGB star, although the carbon isotopic ratio reported in the literature seems a bit low. Winters et al. (WLJNE03 (2003)) derived a mass loss rate of about 510-7 M⊙yr-1 from thermal CO lines.
4.2 Forthcoming targets
The CRIRES-POP observations are expected to continue for an additional year to reach a total sample size of approximately 25-30 targets. Spectra have been partly obtained for seven further targets, which are listed in Table 2. Information about the stars will be published online777http://www.univie.ac.at/crirespop as soon as observations are completed.
| HD number | other names | spectral type | RA (2000) | DE (2000) | UVES-POP? | |
|---|---|---|---|---|---|---|
| (mag) | ||||||
| 120709 | 3 Cen A, HR 5210 | B5 IIIp | 13:51:50 | 32:50:39 | 4.97 | y |
| 80404 | Car, HR 3699 | A8 I | 09:17:05 | 59:16:31 | 1.53 | y |
| 146233 | 18 Sco, HR 6060 | G2 V | 16:15:37 | 08:22:10 | 4.19 | n |
| 99648 | Leo, HR 4418 | G8 I | 11:27:56 | +02:51:23 | 2.83 | y |
| 138716 | 37 Lib, HR 5777 | K1 V | 15:34:11 | 10:03:52 | 2.24 | y |
| 209100 | Ind, HR 8387 | K5 V | 22:03:22 | 56:47:09 | 2.20 | y |
| 73739 | MN Vel | M7 II/III | 08:38:01 | 46:54:15 | 0.19 | n |
4.3 The CRIRES-POP HRD
We include in Fig. 1 the location of the stars of the CRIRES-POP library in a Hertzsprung-Russell diagram (HRD). Temperatures and luminosities were taken from the literature, and for each source we refer to the individual target descriptions in the paragraphs above. If no luminosity had previously been calculated, we used the Hipparcos parallax (van Leeuwen Hipnew (2007)), temperature, colour, and magnitude from the literature as described above, and the bolometric correction from Worthey & Lee (WL11 (2011)) to estimate a value for . Luminosities from the literature were converted into using = 474. In Fig. 1 we did not included the star HD 73739 owing to a lack of sufficient information about this object in the literature.
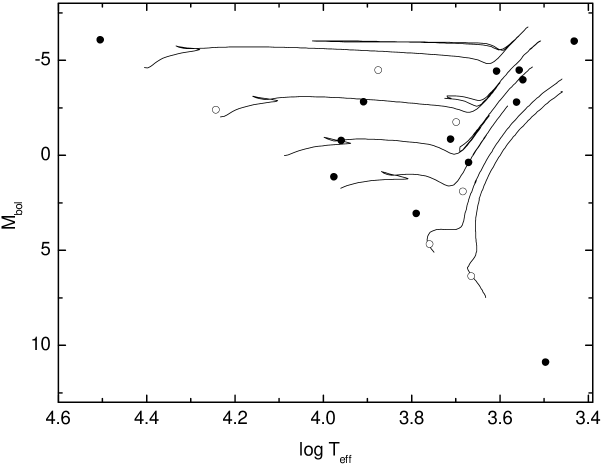
We include in Fig. 1 evolutionary tracks for stars with solar metallicity and masses of 10, 5, 3, 2, 1, and 0.6 M⊙, taken from Bertelli et al. (bertelli08 (2008), bertelli09 (2009)). The tracks are primarily for illustrative purposes. Owing to the inhomogeneous collection of temperature and luminosity values presented here, we did not aim to perform fits of the mass and evolutionary status of the various targets. Our intention was instead to highlight the parameter range covered by CRIRES-POP.
5 Results and discussion
5.1 A first glance at the catalogue
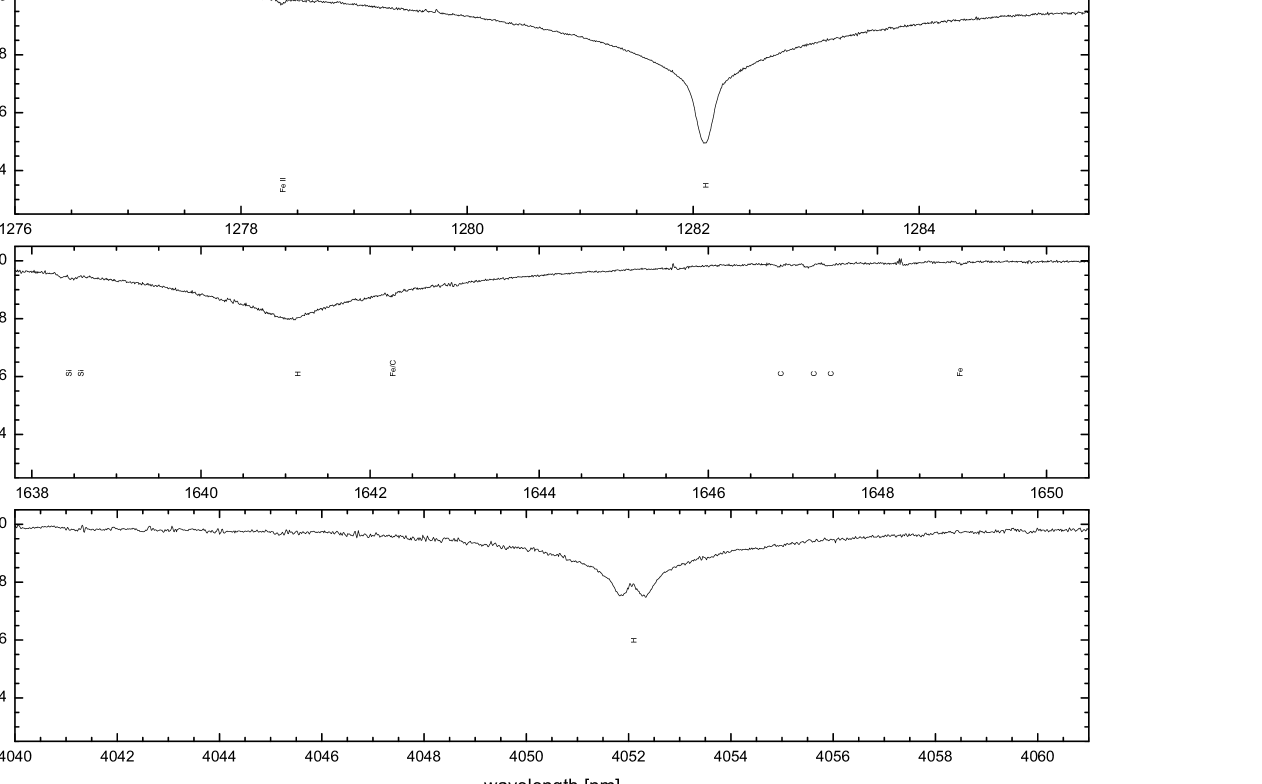
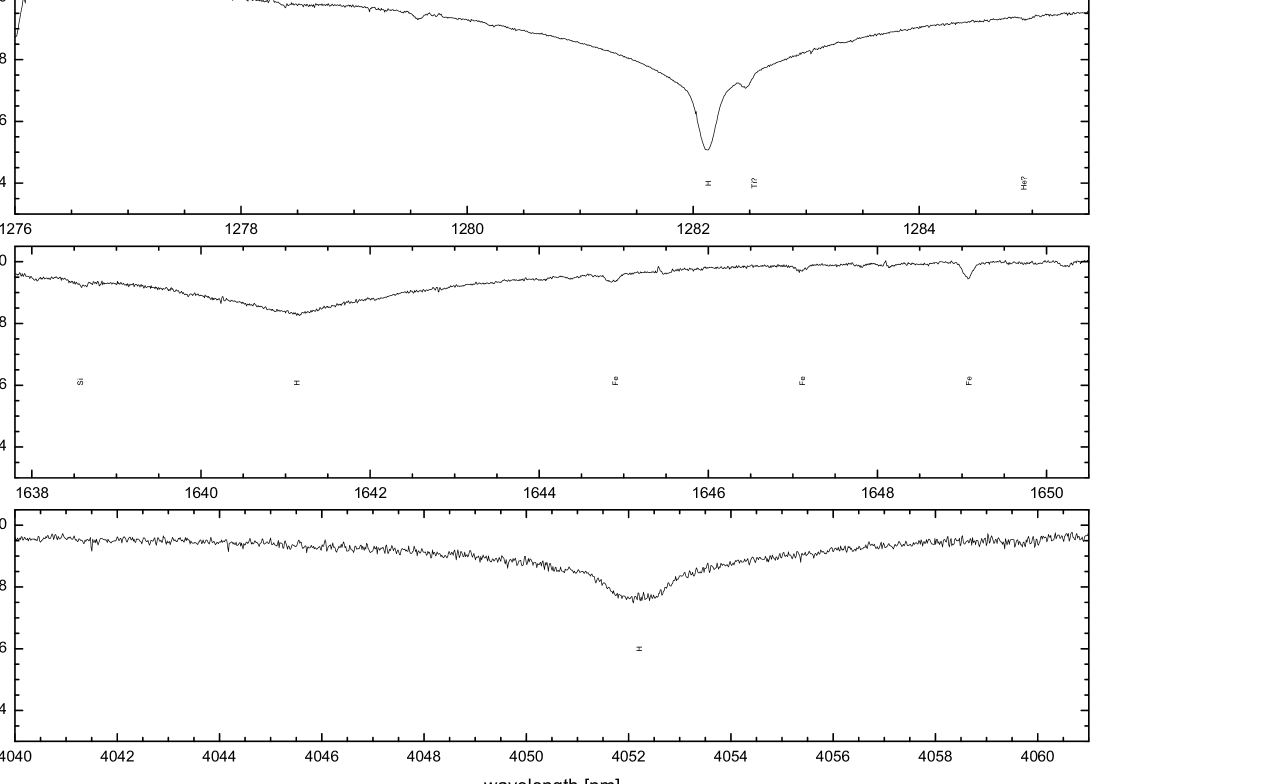
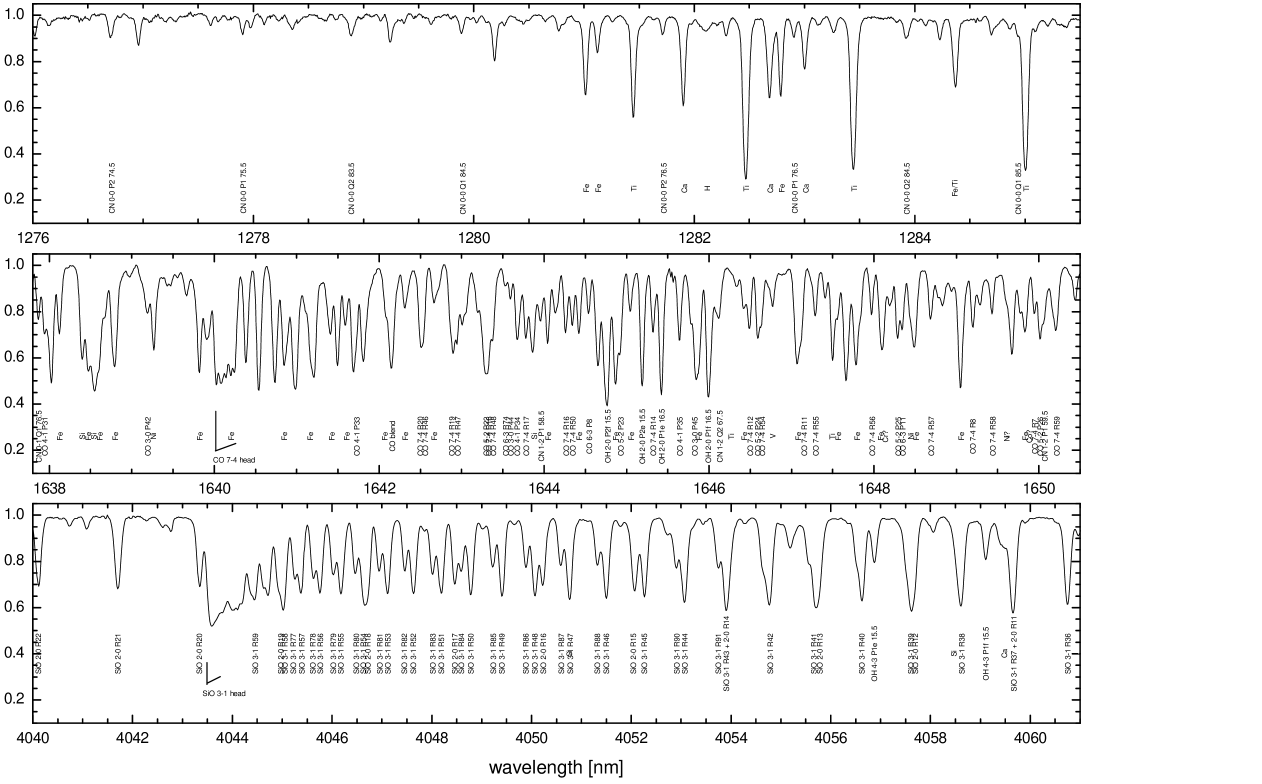
As outlined above, the final CRIRES-POP data products should clearly have an accuracy that exceeds the average level of the standard CRIRES pipeline products. In particular, the wavelength solution has been improved by the usage of telluric lines (see Sect. 3.2), cosmetic defects have been corrected where possible (see Sect. 2), and the full spectral resolution with a resolving power of will be maintained, compared to –90 000 from the standard pipeline reduction (see Sect. 3.1). We started the production of the final library, and presented here the first examples. In Fig. 2, we illustrate the process of telluric correction and fine tuning of the wavelength calibration briefly described in Sect. 3.2. This method has been applied in three representative wavelength regions for the 13 stars listed in Table 1. We have selected these parts of the spectra because they include the positions of some well-known hydrogen lines, several atomic lines, and a large collection of molecular lines, i.e., interesting features that can be seen in all stars of our library in this presentation.

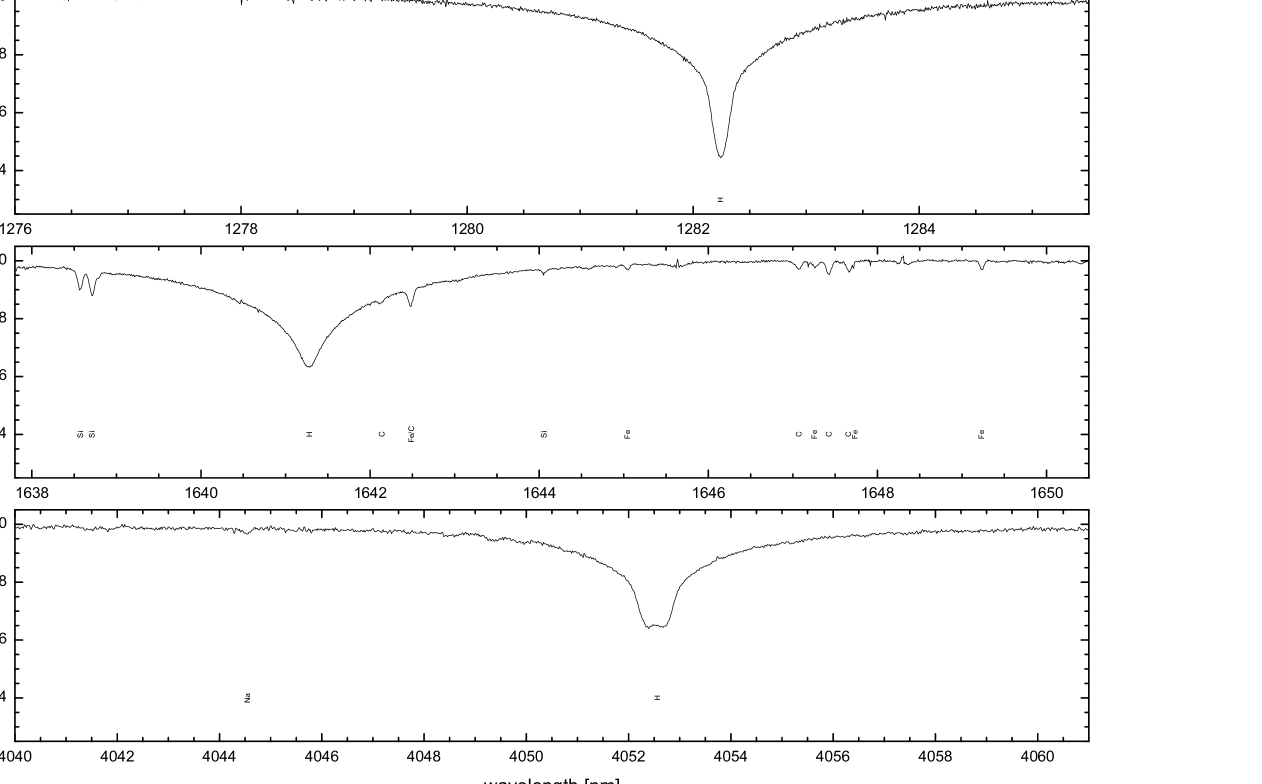
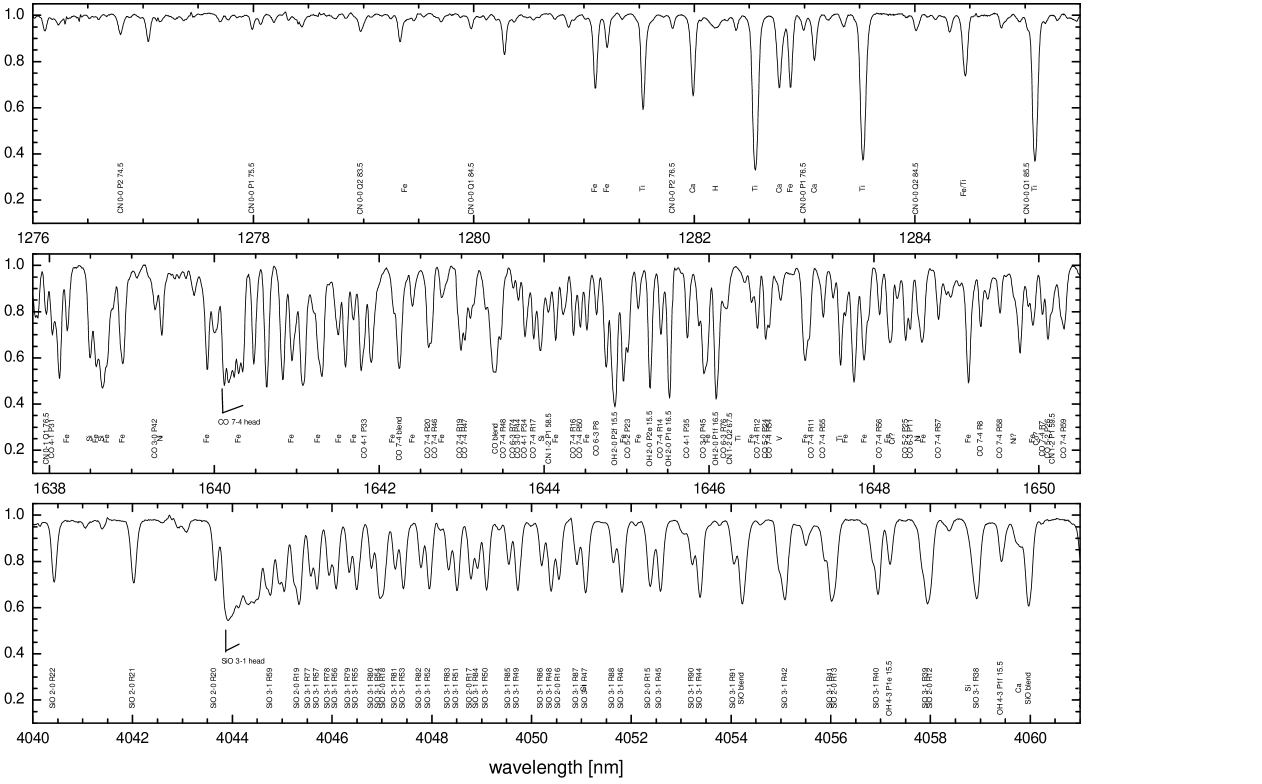
Figures 3 to 15 show the spectra of the three wavelength regions for each star in the library and provide line identifications. In our presentation, we follow the sorting given in Table 1. Heliocentric velocity corrections have been applied to all spectra. The accuracy of the wavelength solution, derived with the help of the positions of the telluric lines, is better than one third of a pixel, and for the hot stars the accuracy is close to one tenth of a pixel. A representative synthetic telluric spectrum for these regions can be found in Fig. 16. The telluric corrections applied to the selected spectra shown here leave residuals in the cores of the most prominent telluric lines of 1% of the continuum flux for all but one noticeable exception at 1278.5 nm. The corrections were achieved without back-fitting of line parameters and using a single Gaussian instrumental profile. The figures clearly illustrate the high quality of the CRIRES-POP data.
5.2 Line identifications
In the presented spectra, atomic and molecular features have been identified. We used the identifications given in the infrared atlas of Arcturus (Hinkle et al. arcturus (1995)), the line lists provided by Kurucz & Bell (kurucz95 (1995)), the list of iron lines in Nave et al. (nave94 (1994)), the HITRAN database from Rothman et al. (Roth08 (2008)), and the identifications of SiO and OH lines at 4 m given in Ridgway et al. (ridgway84 (1984)). The attribution of atomic or molecular transitions to the observed features was based on identifications for similar stars presented in the literature or the most probable origin of the line, and have in some cases been verified by spectral modelling. One of the weakest lines identified is probably a Na line at 4044.5 nm in HD 73634 (Fig. 6), which has a central depth of not more than 2 %. Unidentified lines even weaker than that can be seen e.g. in the -band spectrum of the same star.
Line identifications for Sco were taken from Nieva et al. (in preparation). Non-LTE population inversions in the outer atmosphere give rise to emission cores in Br in the hotter stars (see, e.g., Käufl Kaufl93 (1993), Przybilla et al. PB04 (2004)), that are most notable for Sco, Pa also displaying the phenomenon.
Line identification in the spectra of the majority of the observed targets was straightforwardly achieved; however, the identifications for two stars (the M dwarf, Barnard’s star, and the carbon star X TrA) required a special treatment owing to the lack of information available in the literature for these spectral types. For these two stars, the spectra and line identifications are discussed in detail below.
5.2.1 Barnard’s star (GJ 699)
The closest high-resolution template to our spectrum of Barnard’s star (GJ 699), is the FTS atlas spectrum of a sunspot (i.e. dark umbra) acquired by Wallace et al. (WHL01 (2001), WHL02 (2002)). However, the available spectra of the sunspot and GJ 699 differ remarkably, which is not completely surprising, given the high magnetic field and hence low gas pressure in a sunspot (e.g., Solanki solanki03 (2003)), mimicking a low surface gravity environment (Amado et al. amado00 (2000)). In addition, GJ 699 has a lower metallicity ([Fe/H] = 0.5, Jones et al. JPVT02 (2002)) compared with the Sun.
Moreover, the high magnetic field in the sunspot leads to strong Zeeman splitting and broadening of atomic (e.g. Ti I and Ca I around 1250 nm) and molecular (FeH) lines, which we did not detect in GJ 699.
The FeH molecule is a strong opacity source in the red and NIR for low mass stars, and those lines were readily detectable in our and band spectra of GJ 699. Lines were identified based on line lists published in Dulick et al. (dulick03 (2003)) and Hargreaves et al. (harg10 (2010)), where only the strongest lines are marked in the plots shown in Fig. 13. FeH is magnetically sensitive and suspected to weaken with lower surface gravity. The Zeeman broadening and the low-gravity environment thus greatly suppress those lines in the sunspot spectra, where they are mostly absent in the spectral region analysed here. To the contrary, low surface gravity enhances the line depth of CO, and we found CO second overtone lines in the sunspot spectra around 1650 nm, which were absent in GJ 699.
The 4050 nm spectrum of GJ 699 is dominated by a forest of lines, which we identified as water vapor. In contrast to FeH, where we identified all lines directly with their counterpart in the line lists, we could only provide a tentative identification of the H2O lines because the latest line lists of Partridge & Schwenke (PS00 (1997)) and Barber et al. (barber06 (2006)) provided only a rough match. A number of lines in our spectrum seem to be limited by the predicted line positions for the same transition in both lists and a number of predicted lines appear to be missing, while other lines found in the GJ 699 spectrum have no unambiguous counterpart in those lists. All H2O lines found in GJ 699 are present in the FTS sunspot spectra (although much weaker than in GJ 699), whereas they remained mostly unidentified in the Wallace et al. atlas, except for a few lines that are indeed identified with H2O. We note that the main opacity source in the sunspot spectra around 4050 nm are SiO lines (some isolated 2-0 lines and the 3-1 bandhead, see, e.g., the spectrum of NZ Gem, Fig. 14), that are, however, extremely weak in GJ 699. The same is true for a small number of OH (4-1) lines falling in this window. The Br line, present in the sunspot spectra, was undetected in GJ 699.
5.2.2 HD 134453 (X TrA)
The second star where we could not rely on identifications of even the stronger lines in the literature was the carbon star HD 134453. High resolution NIR studies on C-stars have lead to interesting results on, e.g., the abundance of fluorine (Abia et al. abia10 (2010), Jorissen et al. joris92 (1992)), but a systematic investigation of the spectral content is still missing.
In the and bands, lines of CN and C2 dominate the spectrum. Blending is a severe problem, hence isolated lines are rare. To determine the contribution of the various molecules to an individual spectral feature, we calculated synthetic spectra using the COMARCS models of Aringer et al. (aringer09 (2009)). The line lists of CN and C2 that we used were those from Jørgensen (jorgen97 (1997)) and Querci et al. (QQT74 (1974)), respectively. For the model parameters we applied the values of Kipper (Kipper04 (2004)). Unfortunately, the molecular data in the line lists lack sufficient precision for this high resolution study, hence the synthetic spectrum differs strongly from the observations (see also the discussion in Lebzelter et al. LZ08 (2008) or Lederer et al. lederer09 (2009)).
Focusing on the observed features, which were at least roughly reproduced by the synthetic spectrum, we re-calculated the model spectra by removing one molecule (CN, C2, CO) at a time. In this way, we were able to attribute a number of lines or parts of line blends to a specific molecule. However, a significant fraction of features could not be identified unambiguously. For the C2 lines (Phillips system), the line list did not include identifications of the transitions, thus it is not provided in Fig. 15.
The model was similarly unable to reproduce the section of the spectrum around 4 m. Wallace & Hinkle (WH02 (2002)) identified bands of CH and CS in medium-resolution spectra of carbon stars in this wavelength range. We were able to attribute series of lines in our spectrum to transitions of the 2-0, 3-1, and 6-4 bands of 12CS. For this analysis, we used the line lists of Winkel et al. (cspaper (1984)) and Chandra et al. (chandra95 (1995)). Two likely identifications of atomic lines are also given.
5.3 Impact on atomic and molecular line lists
Even at this preliminary stage, the potential of the CRIRES-POP library is clearly evident for an accurate testing of existing atomic and molecular line lists. Laboratory and theoretical investigations to create atomic data have in the past focused on the optical and ultraviolet wavelength regions to support ground-based and space spectroscopy. Nevertheless, the infrared wavelength region between approximately 1m and 5 m contains numerous atomic transitions. Databases lack transition data for many ions at IR wavelengths, giving the false impression that this region is uninteresting for studies that are compelled to utilise atomic lines.
Prior to the inauguration of the CRIRES and the Phoenix (Hinkle et al. phoenix (1998)) instrument, the low spectral resolution of earlier instruments did not necessitate accurate wavelengths or transition probabilities for atomic lines owing to the effects of line blending888A limited amount of high spectral resolution data from instruments such as the Kitt Peak National Observatory Fourier transform spectrometer and the solar spectrum obtained from ATMOS (Geller geller92 (1992)) and the ACE satellite (Hase et al. hase10 (2010)) are available and we clearly need to produce accurate atomic and molecular data.. In the presence of molecular features typical of cool stars, atomic lines tend to become incorporated into the broader features. The incomplete treatment of terrestrial atmospheric lines contributes a similar effect.
The vast majority of data for atomic transitions at IR wavelengths originates from atomic structure calculations. These studies were incomplete in terms of the number of transitions and possess accuracies that remain, in many cases, undetermined. Modern experimental techniques for determining oscillator strengths from transition probabilities have been based on the measurement of energy level lifetimes and branching fractions from line intensities (Wahlgren wahlgren10 (2010), wahlgren11 (2011)), but few NIR lines have been analysed for atomic parameters.
Fortunately, many IR transitions originate from energy levels that are studied experimentally for optical and ultraviolet transitions. Additional lifetime measurements will no doubt need to be made to enable the strongest and/or best placed lines in the NIR of various elements and ions to be analysed. The large amount of ongoing laboratory analyses should therefore be targeted toward recording emission line spectra for intensity measurements to determine transition branching fractions. The wavelength region between 0.9 m and 2.5 m is of particular importance for atomic data, as this region contains known transitions of many post iron-group elements. The iron-group elements are of interest at all wavelengths to provide the wavelength standards that can be used to adjust the CRIRES wavelength scale in regions where few calibration lines exist, and to apply accurate oscillator strengths to place abundance analyses at UV, optical, and IR wavelengths on a similar scale. Finally, the spectral library will provide valuable comparison data for testing line-broadening theories. Few precise data are available so far, but they are in high demand for quantitative analyses using not only the hydrogen and helium lines, but also several rather strong metal transitions.
6 Conclusions and outlook
We have presented the first results and relevant background information for our high-resolution spectral library in the infrared called CRIRES-POP. The spectral data that we have presented illustrate the potential of our library not only for the studies of individual stars that are underway within the CRIRES-POP consortium, but also comparative studies spanning a range of spectral types. As an immediate highlight, we considered the case of Barnard’s star. Our high-resolution spectrum has allowed for the first time a direct identification of photospheric water vapor lines in a cool M dwarf and demonstrated the incompleteness of present-day H2O line-lists. The large wavelength coverage of the CRIRES-POP observations, combined with its high spectral resolution, ensures that they provide an invaluable resource for prioritising laboratory measurements of both wavelengths and transition probabilities. The diversity in the properties of stars observed within the CRIRES-POP program will provide spectral lines with a large range of excitation energies and ionisation stages. We invite and encourage the scientific community to use the reduced data of our library for further studies of the individual stars, but also for comparison, model testing, and preparation of observations, but kindly ask researchers to give reference to this publication.
Acknowledgements.
TL acknowledges support by the Austrian Science Fund FWF under project numbers P20046-N16, P21988-N16, and P23006-N16, and SU under project number P22911-N16. HH is supported by the Swedish Research Council (VR) through grant 621-2006-3085. GMW acknowledges support from NASA Grant NNG06GJ29G. SU acknowledges support from the Fund for Scientific Research of Flanders (FWO) under grant number G.0470.07. ASe acknowledges support from the National Science Foundation under grant NSF AST-0708074. Major thanks go to the telescope operators and support astronomers at ESO Garching and Paranal for doing an excellent job in observing the huge number of wavelength settings necessary for this project.References
- (1) Abia, C., Cunha, K., Cristallo, S., et al. 2010, MemSAI, 81, 986
- (2) Adelman, S.J., Unsuree, N. 2007, Baltic Astr., 16, 183
- (3) Amado, P. J., Doyle, J. G., Byrne, P. B. 2000, MNRAS, 314, 489
- (4) Aringer, B., Girardi, L., Nowotny, W., Marigo, P., Lederer, M.T. 2009, A&A, 503, 913
- (5) Babcock, H.W. 1947, ApJ, 105, 105
- (6) Bagnulo, S., Jehin, E., Ledoux, C. et al. 2003, The , 114, 10
- (7) Barber, R.J., Tennyson, J., Harris, G.J., Tolchenov, R.N. 2006, MNRAS, 368,1087
- (8) Barnard, E.E. 1906, MNRAS, 66, 104
- (9) Bean, J., Seifahrt, A., Hartman, H., et al. 2010, The Messenger, 140, 41
- (10) Benedict, G.F., McArthur, B., Nelan, E., et al. 1998, AJ, 116, 429
- (11) Bertelli, G., Girardi, L., Marigo, P., Nasi, E. 2008, A&A, 484, 815
- (12) Bertelli, G., Nasi, E., Girardi, L., Marigo, P. 2009, A&A, 508, 355
- (13) Blum, R.D., Ramirez, S.V., Sellgren, K., Olsen, K. 2003, ApJ, 597, 323
- (14) Brown, J.A., Sneden, C., Lambert, D.L., Dutchover, E. 1989, ApJS, 71, 293
- (15) Brown, J.A., Smith, V.V., Lambert, D.L., et al. 1990, AJ, 99, 1930
- (16) Bruntt, H., Bedding, T.R., Quirion, P.-O., et al. 2010. MNRAS, 405, 1907
- (17) Buscombe, W., Morris, P.M. 1958, MNRAS, 118, 609
- (18) Casagrande, L., Flynn, C., Bessell, M. 2008, MNRAS, 389, 585
- (19) Cenarro, A.J., Peletier, R.F., Sanchez-Blaszquez, P., et al. 2007, MNRAS, 374, 664
- (20) Chandra, S., Kegel, W.H., Le Roy, R.J., Hertenstein, T. 1995, A&A, 114, 175
- (21) Chavez, J., Lambert, D.L. 2009, ApJ, 699, 1906
- (22) Dawson, P.C., De Robertis, M.M. 2004, AJ, 127, 2909
- (23) Delbouille, L., Roland, G., Neven, L. 1973, Atlas photometrique du spectre solaire de 3000 a 10000; Liege: Universite de Liege, Institut d’Astrophysique
- (24) De Medeiros, J.R., Udry, S., Burki, G., Mayor, M. 2002, A&A, 395, 97
- (25) Donati, J.-F., Howarth, I. D., Jardine, M. M., et al. 2006, MNRAS, 370, 629
- (26) Dulick, M., Bauschlicher, C.W., Burrows, A., et al. 2003, ApJ, 594, 651
- (27) Dumm, T., Schild, H. 1998, New Astr., 3, 137
- (28) Dyck, H.M., van Belle, G.T., Thompson, R.R. 1998, ApJ 116, 981
- (29) Eaton, J.A., Williamson, M.H. 2007, PASP, 119, 886
- (30) Eggen, O.J., Iben, I. 1991, AJ, 101, 1377
- (31) Eggleton, P.P., Tokovinin, A.A. 2008, MNRAS, 389, 869
- (32) Famaey, B., Jorissen, A., Luri, X., et al. 2005, A&A, 430, 165
- (33) Fekel, F.C. 1997, PASP, 109, 514
- (34) Feltzing, S., Bensby, T. 2008, Physica Scripta, 133, 4031
- (35) Fors, O., Richichi, A., Nunez, J., Parades, A. 2004, A&A, 419, 285
- (36) Geller, M. 1992, NASA Ref. Publ., 1224, vol III
- (37) Gonzalez, G., Carlson, M.K., Tobin, R.W. 2010, MNRAS, 403, 1368
- (38) Gray, D.F. 1981, ApJ, 251, 155
- (39) Gray, R.O., Garrison, R.F. 1989, ApJS, 70, 623
- (40) Griffin, R. 1985, The Obervatory, 105, 7
- (41) Hargreaves, R.J., Hinkle, K.H., Bauschlicher, C.W., et al. 2010, AJ, 140, 919
- (42) Hase, F., Wallace, L., McLeod, S.D., Harrison, J.J., Bernath, P.F. 2010, JQRST, 111, 521
- (43) Hinkle, K.H., Cuberly, R., Gaughan, N., et al. 1998, SPIE, 3354, 810
- (44) Hinkle, K.H., Wallace, L., Livingston, W. 1995, Infrared Atlas of the Arcturus Spectrum, 0.9-5.3 microns, ASP, San Francisco.
- (45) Hünsch, M., Schmitt, J.H.M.M., Sterzik, M.F., Voges, W. 1999, A&AS, 135, 319
- (46) Jancart, S., Jorissen, A., Babusiaux, C., Pourbaix, D. 2005, A&A, 442, 365
- (47) Jones, H.R.A., Pavlenko, Y., Viti, S., Tennyson, J. 2002, MNRAS, 330, 675
- (48) Jørgensen, U.G. 1997, IAUS 178, 441
- (49) Jorissen, A., Smith, V.V., Lambert, D.L. 1992, A&A, 261, 664
- (50) Jorissen, A., Van Eck, S., Mayor, M., Udry, S. 1998, A&A, 332, 877
- (51) Jung Y., CRIRES Pipeline User Manual, Issue 1.5, ESO
- (52) Howk, J.C., Cassinelli, J.P., Bjorkman, J.E., Lamers, H.J.G.L.M. 2000, ApJ, 534, 348
- (53) Käufl, H.U. 1993, A&A, 272, 452
- (54) Käufl, H.U., Ballester, P., Biereichel, P., et al. 2004, SPIE, 5492, 1218
- (55) Keenan, P.C. 1954, ApJ, 120, 484
- (56) Keenan, P.C., Pitts, R.E. 1980, ApJS, 42, 541
- (57) Kipper, T. 2004, Baltic Astronomy, 13, 573
- (58) Koen, C., Eyer, L. 2002, MNRAS, 331, 45
- (59) Kürster, M., Endl, M., Rouesnel, F., et al. 2003, A&A, 403, 1077
- (60) Kurucz, R.L. & Bell, B. 1995, Atomic Line Data, Kurucz CD-ROM No. 23, Cambridge, Mass.: Smithsonian Astrophysical Observatory
- (61) Kwok, S., Volk, K., Bidelman, W.P. 1997, ApJS, 112, 557
- (62) Landstreet, J.D., Kupka, F., Ford, H.A., et al. 2009, A&A, 503, 973
- (63) Lazaro, C., Lynas-Gray, A.E., Clegg, R.E.S., Mountain, C.M., Zadrozny, A. 1991, MNRAS, 249, 62
- (64) Lebzelter, T., Hron, J. 2003, A&A, 411, 533
- (65) Lebzelter, T., Lederer, M.T., Cristallo, S., et al. 2008, A&A, 486, 511
- (66) Lederer, M.T., Lebzelter, T., Cristallo, S., et al. 2009, A&A, 502, 913
- (67) Little, S., Little-Marenin, I.R., Hagen Bauer, W. 1987, AJ, 94, 981
- (68) Luck, R.E., Bond, H.E. 1980, ApJ, 241, 218
- (69) Luck, R.E., Wepfer, G.G. 1995, AJ, 110, 2425
- (70) Lyubimkov, L.S., Lambert, D.L., Rostopchin, S.I., Rachkovskaya, T.M., Poklad, D.B. 2010, MNRAS, 402, 1369
- (71) Mallik, S.V. 1999, A&A, 352, 495
- (72) Mewe, R., Raassen, A.J.J., Cassinelli, J.P., et al. 2003, A&A, 398, 203
- (73) Mishenina, T.V., Bienayme, O., Gorbaneva, T.I., et al. 2006, A&A, 456, 1109
- (74) Mishenina, T.V., Gorbaneva, T.I., Bienayme, O., et al. 2007, Astron. Rep., 51, 382
- (75) Mohanty, S., Basri, G. 2003, ApJ, 583, 451
- (76) Mountain, C.M., Robertson, D.J., Lee, T.J., Wade, R. 1990, SPIE, 1235, 25
- (77) Nave, G., Johansson, S., Learner, R.C.M., Thorne, A.P., Brault, J.W. 1994, ApJS, 94, 221
- (78) Netopil, M., Paunzen, E., Maitzen, H.M., North, P., Hubrig, S. 2008, A&A, 491, 545
- (79) Nidever, D.L., Marcy, G.W., Butler, R.P., Fischer, D.A., Vogt, S.S. 2002, ApJS, 141, 503
- (80) Nieva, M. F., Przybilla, N., 2007, A&A, 467, 295
- (81) Nieva, M. F., Przybilla, N., 2008, A&A, 481, 199
- (82) Nieva, M. F., Przybilla, N., 2011, A&A, submitted
- (83) Nieva, M. F., Przybilla, N., Seifahrt, A., Butler, K., Käufl, H.-U., Kaufer, A., 2009, in: A. Moorwood (ed), Science with the VLT in the ELT era (Springer: Berlin), 499
- (84) Nieva, M. F., Przybilla, N., Seifahrt, A., Butler, K., Käufl, H.-U., Kaufer, A., 2011, Bull Soc. R. Sci. Liege, 80, 175
- (85) Oudmaijer, R.D., van der Veen, W.E.C.J., Waters, L.B.F.M., et al. 1992, A&AS, 96, 625
- (86) Partridge, H., Schwenke, D.W. 1997, J.Chem.Phys., 106, 4618
- (87) Pasinetti Fracassini, L.E., Pastori, L., Covino, S., Pozzi, A. 2001, A&A, 367, 521
- (88) Paulson, D.B., Allred, J.C., Anderson, R.B., et al. 2006, PASP, 118, 227
- (89) Percy, J.R. 1993, PASP, 105, 1422
- (90) Percy, J.R., Esteves, S., Lin, A., Menezes, C., Wu, S. 2009, JAAVSO, 37, 71
- (91) Peterson, R.C., Dalle Ore, C.M., Kurucz, R.L. 1993, ApJ, 404, 333
- (92) Pourbaix, D., Tokovinin, A., Batten, A., et al. 2004, A&A, 424, 727
- (93) Przybilla, N., & Butler, K. 2004, ApJ, 609, 1181
- (94) Przybilla, N., Nieva, M. F., Butler K. 2008, ApJ, 688, L103
- (95) Przybilla, N., Firnstein, M., Nieva, M. F., Meynet, G., Maeder, A. 2010, A&A, 517, A38
- (96) Ranade, A.C., Ashok, N.M., Singh, H.P., Gupta, R. 2007, Bull. Astr. Soc. India, 35, 359
- (97) Ridgway, S.T., Carbon, D.F., Hall, D.N.B., Jewell, J. 1984, ApJS, 54, 177
- (98) Rogerson, J.B., Jr., Upson, W.L., II 1977, ApJS, 35, 37
- (99) Rothman, L.S., Wattson, R.B., Gamache, R.R., Schroeder, J., McCann, A. 1995, Proc.Soc.Photo-Opt.Instrum.Eng., 2471
- (100) Rothman, L.S., Gordon, I.E., Barber, R.J., et al. 2010, J. Quant. Spec. Radiat. Transf., 111, 2139
- (101) Royer, F., Zorec, J., Gomez, A.E. 2007, A&A, 463, 671
- (102) Rothman, L. S., Gordon I. E., Barba, A., Benner, D. C., Bernath, P. F., et al., 2008, Journal of Quantitative Spectroscopy & Radiative Transfer, 110, 533
- (103) Ryabchikova, T., Kochukhov, O., Bagnulo, S. 2008, A&A, 480, 811
- (104) Saffe, C., Gomez, M., Pintado, O., Gonzalez, E. 2008, A&A, 490, 297
- 2007- (2010) Samus, N.N., Durlevich, O.V., et al. 2007-2010, General Catalogue of Variable Stars, 2009yCat….102025S
- (106) Sánchez-Blázquez, P., Peletier, R.F., Jiménez-Vicente, J., et al. 2006, MNRAS, 371, 703
- (107) Schoier, F.L., Olofsson, H. 2001, A&A, 368, 969
- (108) Ségranasan, D., Kervella, P., Forveille, T., Queloz, D. 2003, A&A, 397, L5
- (109) Seifahrt, A., Käufl, H. U. 2008, A&A, 491, 929
- (110) Seifahrt, A., Käufl, H. U., Zängl, G., Bean, J. L., Richter, M. J., Siebenmorgen, R., 2010, A&A 524, A11
- (111) Simón-Díaz, S., Herrero, A., Esteban, C., Najarro, F. 2006, A&A, 448, 351
- (112) Sloan, G.C., Price, S.D. 1998, ApJS, 119, 141
- (113) Smette, A., Sana, H., Horst, H. 2010, Highlights of Astronomy, 15, 533
- (114) Smiljanic, R., Barbuy, B., De Medeiros, J.R., Maeder, A. 2006, A&A, 449, 655
- (115) Smith, V.V., Lambert, D.L. 1986, ApJ, 311, 843
- (116) Smith, V.V., Lambert, D.L. 1988, ApJ, 333, 219
- (117) Smoker J. 2011, CRIRES User Manual, Issue 89.1, ESO
- (118) Snow, T.P., Lamers, H.J.G.L.M., Lindholm, D.M., Odell, A.P. 1994, ApJS, 95, 163
- (119) Solanki, S. K. 2003, A&A Rev., 11, 153
- (120) Soubiran, C., Bienamye, O., Mishenina, T., Kovtyukh, V.V. 2008, A&A, 480, 91
- (121) Takeda, Y., Sato, B., Murata, D. 2008, PASJ, 60, 781
- (122) Querci, F., Querci, M., Tsuji, T. 1974, A&A, 31, 265
- (123) Unsöld, A. 1942, ZAp, 21, 22
- (124) Uttenthaler, S. 2007, PhD thesis, University of Vienna
- (125) Van Eck, S., Jorissen, A., Udry, S., Mayor, M., Pernier, B. 1998, A&A, 329, 971
- (126) van Leeuwen, F. 2007, A&A, 474, 653
- (127) van Paradijs, J. 1973, A&A, 23, 369
- (128) Valdes, F., Gupta, R., Rose, J.A., Singh, H.P., Bell, D.J. 2004, ApJS, 152, 251
- (129) Wahlgren, G.M. 2010, Oscillator strengths and their uncertainties, in: EAS Publ. Ser. 43, eds. R. Monier, B. Smalley, G.M. Wahlgren, Ph. Stee, 91
- (130) Wahlgren, G.M. 2011, Can J Phys, 89, 345
- (131) Wahlgren, G.M., Lebzelter, Wolff, B. 2011, in: Proceedings of Why Galaxies Care About AGB Stars II, eds F. Kerschbaum, T. Lebzelter, and R.F. Wing, ASP Conf. Ser. 445, in press
- (132) Wallace, L., Livingston, W., Hinkle, K.H., Bernath, P. 1996, ApJS 106, 165
- (133) Wallace, L., Hinkle, K.H., Livingston, W. 2001, NSO Technical Report #01-001; Tucson: National Solar Observatory
- (134) Wallace, L., Hinkle, K. 2002, AJ, 124, 393
- (135) Wallace, L., Hinkle, K.H., Livingston, W. 2002, NSO Technical Report #02-001; Tucson: National Solar Observatory
- (136) Wallerstein, G., Knapp, G.R. 1998, ARA&A, 36, 369
- (137) Winters, J.M., Le Bertre, T., Jeong, K.S., Nyman, L.A., Epchtein, N. 2003, A&A, 409, 715
- (138) Winkle, R.J., Davis, S.P., Pecyner, R., Brault, J.W. 1984, Can.J.Phys., 62, 1414
- (139) Worthey, G., Lee, H.C. 2011, ApJS, 193, 1
- (140) Wylie-De Broer, E.C., Cottrell, P.L. 1990, ApJ, 692, 522
- (141) Yamashita, Y. 1967, PDAO, 13, 47
- (142) Zamanov, R.K., Bode, M.F., Melo, C.H.F., et al. 2008, MNRAS 390, 377
- (143) Zorec, J., Cidale, L., Arias, M.L., et al. 2009, A&A, 501, 297
Note added in proof: After acceptance of the paper we became aware that we did not use the line list of Barber et al. (2006) for the identification of water vapor lines in GJ699 but by mistake the line list in HITEMP 1995 (Rothman et al 1995). HITEMP 1995 is superseded by the greatly improved HITEMP 2010 (Rothman et al. 2010) database. We regret this mistake and have to revise our statement about the incompleteness of present day water vapor line lists which is thus unfounded. Nevertheless, we are convinced that the CRIRES-POP spectral library will offer an excellent possibility to perform detailed comparisons between theoretical line lists and experimental data.