2011 Vol. X No. XX, 000–000
22institutetext: Key Laboratory for the Structure and Evolution of Celestial Objects, Chinese Academy of Sciences, Kunming 650011, China 33institutetext: Graduate School of the Chinese Academy of Sciences, Beijing 100049, China. \vs\no
Chemical mixing by turbulent convection in the overshooting region below the convective envelope of RGB stars111Supported by the National Natural Science Foundation of China.
Abstract
Based on the turbulent convection model (TCM), we investigate chemical mixing in the bottom overshooting region of the convective envelope of intermediate-mass stars, focusing on its influence on the formation and extension of blue loops in the Hertzsprung-Russell (HR) diagram. A diffusive mixing model is adopted during the Red Giant Branch (RGB) phase. The properties of the blue loop are changed by modification of the element profiles above the H-burning shell, which results from the incomplete mixing in the bottom overshooting region when stellar model evolves up along the RGB. Such modification of the element profiles will lead to an increase of the opacity in the region just above the H-burning shell and a decrease of the opacity in the outer homogeneous convection zone, which will result in a quick decrease of the H-shell nuclear luminosity when the stellar model evolves from the RGB tip to its bottom and, finally, a much weaker and smaller convection zone will be obtained in the stellar envelope. This helps to form a longer blue loop. The extension of the blue loop is very sensitive to the parameters and of the diffusive mixing model and of the TCM. The results mainly show that: 1) comparing to the results of the classical model with the mixing-length theory, the lengths of the obtained blue loops with different combinations of the values of and are all increased and the length of the blue loop increases with the values of parameters and ; 2) the diffusive mixing model can significantly extend the time of stellar models lingering on the blue side of the HR diagram, even though the length of the blue loop for the 7 star has a less prominent difference between the classical and diffusive mixing model; 3) both the observations referring to the location of the Cepheid instability strip and the number ratio of blue to red evolved stars in the Galactic open clusters can confine the two parameters in a range of and for the model of . However, for the case of the star, there seems to be no such a definite range to even only account for the observed number ratio . In any case, our results based on the diffusive mixing model are on the whole in accordance with not only other theoretical ones but also the observations.
keywords:
stars: convection–tar: interiors–star: HR diagram–blue loops–Cepheids–Galactic open clusters1 Introduction
Convection in stellar models is an important mechanism of element mixing. The mixing-length theory (MLT, Böhm-Vitense 1958) is commonly adopted to depict the turbulent convection process in the stellar evolution models. The boundaries of a convection zone are defined by a local stability criterion, i.e. the Schwarzschild condition where and are the radiative and adiabatic temperature gradient, respectively. In such way the interface between a radiative and a convection region is sharply defined. However, in reality because of the dynamical consequence of Newton’s law (Canuto 1998) some convective elements may penetrate into the radiative equilibrium region, resulting in a so-called ’overshooting region’ between the unstably convective zone and the stably radiative one, which is widely validated in real stars by comparisons of the stellar models with observations (Maeder & Meynet 1989; Stothers 1991; Alongi et al. 1991; Schröder et al. 1997; Herwig 2000). Both the thermal structure and the chemical composition will be modified due to the overshooting effects, and thus the stellar structure and evolution will be significantly affected. However, there is no widely accepted theoretical model to reliably describe the convective overshooting nowadays. The focused debates are the extent of the overshooting and the efficiency of the mixing induced by it (Saslaw & Schwarzschild 1965; Shaviv & Salpeter 1973; Eggleton 1983; Renzini 1987; Xiong 1985,1986; Deng et al. 1996a, 1996b; Freytag et al. 1996; Canuto 1998; Salasnich et al. 1999; Robinson et al. 2004). Because of the lack of a fully sounded theory, some parameterized approaches have to be adopted, in most of which the local pressure scale height is usually taken as a parameter to describe the overshooting distance. It is needed to stress here that the problem of the convective overshooting is just induced by some weakpoints or inherent inconsistencies of the MLT itself (Deng et al. 1996a), which can be ruled out by the turbulent convection theory.
According to the MLT, chemical elements are mixed instantaneously and homogeneously in a convection zone (Vandenberg & Smith 1988; Sweigart 1997). However, this assumption should not be adopted straightforward for the overshooting regions (Deng et al. 1996a). Because both laboratory experiments and the numerical simulations suggest that the speed of mixing is slow enough that instantaneous mixing does not achieve. Therefore, mixing in the overshooting regions are often approximated by a time-dependent diffusion process. However, the diffusion coefficient is often assumed as consisting of an exponential decay of convective velocity within the region (Freytag et al. 1996; Herwig 1997,2000; Salasnich et al. 1999; Ventura & D’Antona 2005). Deng et al. (1996a,b) proposed an improved formalism for the diffusion coefficient, which includes the contribution of the motions of all possible scales and the effects of intermittence and stirring of turbulence.
Different ways of convective mixing (instantaneous or diffusive) and different values of the diffusion coefficient for the diffusive mixing may result in significant differences in stellar structure and evolution, for example, the predicted location of the instability strip for Cepheids, the extent of blue loops in the HR diagram and the predicted number ratio of stars in the blue and red part of the HR diagram. For the Galactic classical Cepheids, different kinds of their masses are obtained by Caputo et al. (2005), such as the pulsation mass, the evolution mass, from which some low masses down to 5M⊙ are got, or even lower ones. Nevertheless, standard stellar models (e.g. no overshooting, no mass loss, etc) fail to reproduce those low mass Galactic classical Cepheids (Schmidt 1984; Fernie 1990). Because the blue tips of the blue loops of the evolutionary tracks for these less massive models can not go hot enough to approach the blue edge of the observed Cepheid instability strip. And the smaller a model mass, the shorter the length of its blue loop, even no blue loop develops. However, the blue loop can occur even down to 4M⊙ from the observational data (Stothers & Chin 1993). Many input physical factors can affect the blue loop and its extension, such as initial chemical composition, rates of , and reactions, envelope opacities, mass loss and rotation. The detailed discussions can be found in Stothers & Chin (1994), El Eid (1995), Xu & Li (2004a,b) and Valle et al. (2009). It is necessary to point out that the effects of the above mentioned factors on properties of blue loop are still matters of debate. For example, for stars in the core He burning phase, some authors (e.g. Brunish & Becker 1990; Xu & Li 2004a) found that the blue loop is very sensitive to the reaction rate and the length of the blue loop increases with it. However, Valle et al. (2009) recently showed that according to the updated rate of from Hammer et al. (2005) the effect of the reaction on the blue loop length is negligible for stars of all masses. Convective mixing is a special one affecting the blue loop, including convective criterion (Schwarzschild or Ledoux), seimconvection, outward overshooting from the convective core and downward overshooting from the convective envelope. In the case of intermediate-mass stars the lengths of blue loops are found to be longer by using Schwarzschild criterion than the ones by using Ledoux criterion, whereas the reverse results are found in massive stars (El Eid 1995). This is because that in massive stars an intermediate convective zone is formed by using Schwarzschild criterion which inhibits the downward penetration of the convective envelope and suppresses the blue loop (Ritossa 1996). For both intermediate and massive stars the extension of the blue loop will be increased by adding an additional efficient semiconvection mixing to the Ledoux convection (El Eid 1995; Deng et al. 1996a). The effect of overshooting from the convective core during the main sequence phase suppresses the blue loops (Matraka et al. 1982; Huang & Weigert 1983; El Eid 1995; Valle et al. 2009). However, The overshooting below the convective envelope favors the development of the blue loop (Stothers & Chin 1991; Alongi et al. 1991) even in models with core overshooting (Alongi et al. 1991; Deng et al. 1996b). And Alongi et al. (1991) found this factor to be the most relevant one in producing the blue loop.
On the observational side, the number ratio of blue to red giants is one of the observable stellar properties. It can be taken as a probe of the stellar structure of intermediate-mass stars, because it is very sensitive to the convective mixing (Langer & Maeder 1995; Deng et al. 1996b). Its value was first shown to vary through galaxies by Vandenbergh (1988). Besides this, for a given luminosity range its value increases with metallicity (Langer & Maeder 1995 for a review). Similarly for a given age range its value increases with metallicity and decreases with distance from galactocenter (Eggenberger et al. 2002). However, the value of for a cluster suffer many uncertainties: i.e. incompleteness of data, difference between photometric and spectroscopic results, contamination of filed stars, dynamical evolution of the cluster and so on. On the theoretical side, the ratio of the time spent at high effective temperature range to the time spent at low effective temperature range during the core helium burning phase is expected to be a close measure of the observational counterpart (Stothers 1991; El Eid 1995; Langer & Maeder 1995). As the convective mixing is a very sensitive factor to affect the extension of the blue loop, it of course affects the value of .
It is the aim of the present paper to study the effect of the chemical mixing in the outer convective envelope on the structure and evolution of intermediate-mass stars by use of the TCM proposed by Li & Yang (2007). We propose a new diffusive mixing model based on a new diffusion coefficient to describe the chemical mixing in the convective overshooting region, while within the convective envelope we simply use the homogeneous mixing model. Under such considerations extended blue loops are obtained. And then we make some comparisons between the obtained results and the related observational results: location of the instability strip for the Cepheids, and number ratio of stars in the blue and red part of the HR diagram.
The plan of this paper is organized as follows. In Section 2 we briefly describe the diffusion algorithm in the overshooting region. The information of the evolutionary code and input physics and some physical assumptions are described in Section 3. The evolutionary results about the blue loop depending on the diffusion parameters and are given in Section 4 and discussed in detail in Section 5. Comparisons with observations are presented in Section 6. Finally, some concluding remarks are summarized in Section 7.
2 Chemical mixing by turbulent convection
The intermediate-mass stars develop large-scale convection in the outer envelope during the RGB stage. The whole convective envelope can be determined by the TCM without the aid of any instability criterion, however, it is convenient to subdivide it into a traditional convective zone (unstable stratification) and overshooting region (stable stratification). In the convection zone elements are assumed to be instantaneously homogenized due to efficient mixing, while in the overshooting region we adopt a diffusion equation to describe such incomplete mixing process:
| (1) |
where is the mass fraction of the chemical element under consideration and is the diffusion coefficient. Certainly the parameter plays a crucial role in determining the extent of the chemical mixing and it needs to be properly assigned according to the TCM.
It needs to point out that Eq.(1) is only invoked to describe the incomplete mixing in the overshooting region below the convective envelope. We simply assume that the complete mixing extends to the stellar surface. So the following discussion on the diffusion coefficient is restricted only in the bottom overshooting region. Hydro-dynamical simulations show that convective turbulent velocity decays exponentially into the nearby stable radiative zone (Freytag et al. 1996), so the formula of is usually constructed in light of the behavior of the turbulent velocity in the overshooting region. Different authors in fact adopt different e-folding distances of the decay according to the pressure scale height at the convective boundary (Freytag et al. 1996; Herwig et al. 1997; Salasnich et al. 1999; Ventura & D’Antona 2005). However, all those diffusion coefficients use boundary values of convective velocity according to the MLT.
In the present paper we propose a new formula of the diffusion coefficient in the framework of the TCM. Because the convective velocity in the overshooting region has been self-consistently set up in advance, we do not need to artificially construct the decay of the convective velocity, and furthermore the dimension of the overshooting region is correspondingly determined, which covers the region from the border of the convective unstable region to the location with zero convective velocity. Our diffusion coefficient is
| (2) |
where is an adjustable parameter that determines the efficiency of convective mixing in the overshooting region, is the radial turbulent kinetic energy, is the turbulent kinetic energy and the typical length of the turbulent mixing. Casting light on the mixing length parameter there are two choices that can be used to determine it. 1) , where is a parameter introduced in the TCM and is similar to the parameter in the MLT, and is the local pressure scale height. 2) , the length of the overshooting region that can be obtained by the profile of the convective velocity in the overshooting region. However, the bottom of the whole convective envelope can numerically be set to the location, for example, where cm/s. The advantage of using is to omit an adjustable parameter.
It should be noted that there are three advantages in our new construction of the diffusion coefficient compared to other mixing models mentioned above. First, the decaying way of owing to the behavior of the convective velocity is self-consistently obtained by the TCM. Second, the dimension of the overshooting region can be ascertained. Third, the value of convective velocity at the boundary of the convective unstable zone is instead given by the TCM.
3 Evolutionary code and input physics
The stellar evolution code is originally described by B. Paczynski and M. Kozlowski, and updated by R. Sienliewicz. Nuclear reaction rates are adopted from BP95 (Bahcall, Pinsonneault & Wasserburg 1995). The equation of state is the OPAL equation of state from Rogers (1994) and Rogers, Swenson & Iglesias (1996). The OPAL opacities GN93hz series (Rogers & Iglesias 1995; Iglesias & Rogers 1996) are used in the high-temperature region. In the outer envelope of the considered models, low-temperature opacities from Alexander & Ferguson (1994) are used. Some recent improvements are given by Li & Yang (2007), Zhang & Li (2009). Here we list some details connecting with the formation and development of the blue loop and represent some input physics.
1) In order to reveal the effect of the chemical mixing in the outer convective envelope on the extension of the blue loop, we only apply the TCM in the envelope convection, not in the convective core. And the convective mixing begin to be incorporated into the evolutionary model when a stellar model arrives at the bottom of the RGB in the HR diagram. This is because that the outer convective envelope is very shallow or does not even exist before this evolution phase location, and the outer convective envelope can not approach the chemical gradient region left by the central H burning stage. Therefore, the evolutionary results will be completely the same for the stellar models with or without the chemical mixing in the outer convective envelope.
2) Because of some numerical problems the TCM can not be used to predict the temperature structure in our RGB models. Instead, the MLT is used in our stellar evolutionary calculations, and the mixing-length parameter in the MLT is adopted to be 1.7. When each model after the RGB bottom is obtained based on the MLT, the TCM is applied in the convective envelope to determine the diffusion coefficient , and then the chemical structure is obtained to complete one time step of the model’s evolution. However, the obtained results will have no significant changes under this simplification because in such area the actual temperature gradient is very close to the adiabatic one owing to very high efficiency of convective energy transport during the RGB phase. We only follow changes of , , , , and for the sake of simplicity.
3) The rates of , and reactions are taken from Caughlan & Fowler (1988). The screening factors are from Graboske et al. (1973). The neutrino emission rates are adopted from Beaudet et al. (1967) and include the later correction factors derived by Ramadurai (1976) for taking the neutral currents into account.
4) Evolutionary models are calculated for intermediate-mass stars of , and with (X, Z)=(0.28, 0.02). A set of the TCM’s parameters are adopted: , , , . Additionally, the parameter in the diffusive mixing model and in the TCM are given respectively: ; . Therefore, there are different models for the evolution series of a special stellar mass. Mass loss by the stellar wind is not considered in this paper.
4 Results of the stellar structure and evolution

4.1 Chemical Profiles in the Stellar Interiors
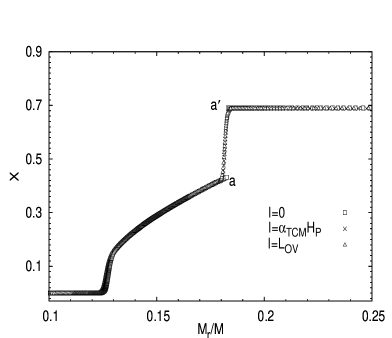
The main improvement achieved by our diffusive mixing model is the modification of the element profiles in the stellar models as shown Fig.1. In this figure the case of represents the result of the classical model with the MLT, in which an obvious element abundance discontinuity (a’-a) can be found around . This discontinuity is a direct result of the MLT’s assumption of complete mixing, which can be verified from Fig.4 in the work of Huang & Weigert (1983) and Fig.2 in the paper of Stothers & Chin (1991). Evidently, it will be removed by using a diffusive mixing model and replaced by a smooth one, which is behaved by the results corresponding to either the case of or that of in Fig.1. It can be found further that the two different formulae of the mixing length result in little difference to the obtained results. The reason seems that the dimension of the overshooting region is directly determined by the way of convective velocity decaying in that region, which is in turn just determined by appeared in the diffusion terms of the TCM’s equations. However, is more physical for it characterizes how far a convective element can be diffused out from the edge of the convective unstable zone. The most important is that there is no additional parameters in this kind of choice, therefore will be adopted in practice for the following discussions.
In Fig.2 the results of the diffusion coefficient adopted by Ventura & D’Antona (2005), Deng et al. (1996a,b), and Salasnich et al. (1999) are compared with ours for a model of during the RGB phase. It can be seen that the value of our diffusion coefficient is on the whole of the same order of magnitude as that of Deng et al. (1996a,b), but about six order of magnitude smaller than those of Ventura & D’Antona (2005) and Salasnich et al. (1999) because of the adopted value of . On the other hand, however, the e-folding distance of our is almost the same as those from Ventura & D’Antona (2005) and Salasnich et al. (1999), which are much shorter than that of Deng et al. (1996a,b) regardless of the value of the parameter in their formula. Such differences in lead to different hydrogen profiles in the overshooting region at the pahse, shown in Fig.3, when the envelope convection zone penetrates inward mostly.


4.2 HR diagram
Evolutionary tracks based on the diffusive mixing model with those based on the classical model with the MLT are shown in the HR diagram in Fig.4. For the sake of convenience of discussions in the latter section, four letters are pasted at some certain key places corresponding to: ’a’ the bottom of the RGB phase, ’b’ the tip of the RGB phase, ’c’ the minimum luminosity descended from the RGB tip, ’d’ the blue endpoint of the blue loop. It is seen in Fig.4 that for the same set of diffusive mixing model’s parameters and , the lengths of the blue loops are evidently increased for the models of 5 and 7 and its increment for the model of is more prominent than that of , but the increment of model is rather small. Such difference found by us are very similar to those of Alongi et al. (1991) who also focus on the effect of the envelope overshooting on the extension of the blue loop but with different mixing scheme. We will concentrate on the results of the model in the following discussions for the mixing model’s parameters and resulting in more obvious effects on the star of .
4.3 Effects of Mixing Model’s Parameters and
Results showing the influence of parameter on the extension of the blue loops are given in Fig.5, evolutionary tracks being plotted from the bottom (except the track of the classical model) of the RGB phase only to the bluest points of the blue loops for the sake of clearness. It can be found clearly that the extension of the blue loops increases with the value of parameter when the value of is fixed. In turn when the value of is fixed the extension of the blue loops increases with the value of as shown in Fig.6. The reason for these, will be analyzed in the following section, is due to the diffusion coefficient , which is proportional to both of them. From the right panels of Fig.5 it can be found that the larger the value of is, the lower the RGB tip is obtained in luminosity, when is fixed. This conclusion is the similar for the parameter as seen in Fig.6, namely the larger the value of is, the fainter the RGB tip will be.
![[Uncaptioned image]](/html/1202.4349/assets/x5.png)
![[Uncaptioned image]](/html/1202.4349/assets/x6.png)


5 discussion
5.1 Stellar Structure During the RGB Stage
As shown in Fig.1 for an example, the element profiles in stars are modified by the diffusive mixing model. The hydrogen profile based on different values of and are presented in Fig.7, all of which belong to evolutionary models around the tip of the RGB phase (point b). It can be found that: 1) the base of homogeneous envelops are more extended into stellar interior for all models with the diffusive mixing model than that of the classical model withe the MLT does, which are clearly shown by the solid star symbol in Fig.7 defined by where the hydrogen abundance . And the dimension of the convective envelope increases with the values of and . The degree of the envelope penetration depending on the parameters and is given in Table 1; 2) the structure of the hydrogen profile in the overshooting region is more or less related to both and . It can be found that the slope of the hydrogen profile is mainly determined by parameter , and the hydrogen profile becomes steeper and steeper when increases from to as seen in either the right or left panels in Fig.7. On the other hand, however, the overshooting distance is mainly determined by parameter , and the overshooting region approaches deeper as the value of increase.
As convective elements go down into the overshooting region, the hydrogen abundance will be increased. Such an effect will lead to the increase of opacity in the overshooting region and thus the increase of the radiative temperature gradient , and then a convective stable region just below the base of the convective unstable zone will be converted into a convective unstable one. As a result the convective envelope will gradually swallow up its nearby region originally belonging to the overshooting region along the RGB evolution, resulting in an appreciable increase of the dimension of the convective envelope. A direct result of this expansion of convection in the stellar envelope is the increase of convective heat transfer efficiency, leading to a smaller stellar radius and a higher effective temperature seen in Figs.5 and 6. The effect of parameter on the stellar chemical structure, at the first glance, seems confusing for a larger value of will normally lead to a smaller convective envelope because of a higher efficiency of energy transport related to it, which is also indicated in Fig.4 of Huang & Weigert (1983). Nevertheless, our results can be understood by taking the following two reasons into account. The first one is that we do not take into account the correction of the temperature structure in the convective envelope by the TCM, thus the value of parameter has no effect on the size of the convective envelope. The second one is related to the diffusion coefficient in Eq.(2), in which the effective mixing length is chosen to be the dimension of the overshooting region. Accordingly a larger value of will lead to a larger velocity of a convective element at the base of the convective unstable zone and further lead to a larger distance of convective overshooting.
Nuclear energy of the hydrogen shell burning resulted from the diffusive mixing models has been found to be lowered during the RGB evolutionary stage, which is shown in Fig.8. It can be seen that the nuclear energy productivity of the H-burning shell is suppressed more with a larger values of and , while that of the core He-burning is essentially unaffected by the diffusive mixing of the convective envelope. This is because that the diffusive mixing in the overshooting region will result in increase of opacity above the hydrogen burning shell. As a result, some of heat will be blocked and do mechanical work on this region to make it expanded a little, resulting in decreases of temperature and density and hence the H shell nuclear energy generation rate. This effect explains the depression of luminosity at the tip of RGB phase (point b) seen in Figs.5 and 6.


5.2 Evolution from the RGB Tip to the Bluest Point
The most significant effect of the diffusive mixing model on the evolution of intermediate-mass stars is the development of blue loop. For the sake of simplicity we only choose the diffusive mixing model with and to make a comparison with the classical model with the MLT. The obtained conclusions are also applicable to other combinations of and . During this evolutionary stage the nuclear luminosity as a function of the central He abundance are given in Fig.9. It can be found that as the model evolves forward beyond the point c the H-shell nuclear luminosity and thus the surface luminosity of the diffusive mixing model increase promptly and ultimately reach a much larger value when the model arrives at the endpoint of the blue loop compared with the results of the classical model with the MLT. Before arriving at point c the luminosities and of the diffusive mixing model quickly decrease to their minimum values labeled as c in Fig.9, which are much lower than the results of the classical model with the MLT.


As the stellar models evolve from the RGB base (point a) upward to the RGB tip (point b) the opacity in the overshooting region just above the H-burning shell will be increased for the diffusive mixing models. When evolving from the RGB tip to point c such effect will become more significant, because the H-shell will be more and more close to the chemical gradient region. In such a way a quick decrease of the H-shell nuclear luminosity will be obtained for the diffusive mixing model, and thus their convection envelopes will be receded outward in a faster way during this evolutionary stage. In addition, the opacity of the whole convective envelope will be decreased to some extent due to the decrease of hydrogen abundance in it. Therefore, a much weaker and smaller convection envelope at point c will be formed for the stars with the diffusive mixing model.
Some characteristics of the stellar envelope at the bottom of the RGB (namely point c in Fig.9) are believed to trigger a blue loop. For example, Renzini et al. (1992) found that if the stellar luminosity is lower than a critical value at this phase a blue loop will be developed. However, such criterion is very sensitive to stellar mass. Afterwards a new criterion, which has less dependence on the stellar mass, was proposed by Xu & Li (2004a). They defined an envelope convection ratio as , where is the mass of the convection zone within the envelope and the mass of the whole envelope above the hydrogen burning shell. Then found if the value of is smaller than a critical value , the envelope will be radiation-dominated and the star will develops a blue loop. Inversely if the value of is larger than the critical one the star will has a convection-dominated envelope and evolve redward after point c in Fig.9. They found that the critical value is to be between 0.24 and 0.37 for a star. For the diffusive mixing model we obtain its value changing with parameters and given in Table 2, which is very close to the result of Xu & Li (2004a). It can be found that all the values of are smaller than the classical one, and larger values of parameters and correspond to smaller . Certainly the smaller the value of is, the convection zone are less extended in the stellar envelope. As a result a smaller value of corresponds to a longer blue loop. For example, in Fig.7 for the diffusive mixing model with and the overshooting region can reach mostly to , which is obviously more nearer to the star center than of the diffusive mixing model with and . Correspondingly, for and is smaller than for and . Therefore, we can see in Fig.5 or Fig.6 that the former star develops a longer blue loop than the latter one.
6 Comparisons with observations
6.1 Instability Strip of the Cepheids

The observed location of the Cepheid instability strip in the HR diagram can be used to verify theoretical models and restrict the models’ parameters. In Fig.10, the evolutionary tracks of our and models are compared with 17 non-variable yellow giants and supergiants and nine Cepheids attaching to the Galactic open clusters derived from Schmidt (1984) whose theoretical fitting is also based on the same mass stars with the same initial chemical content as in the present paper. In order to clearly show the location of the Cepheids, the theoretical blue and red edges of the Cepheid instability strip are shown according to the result of Li (1993). It is obvious that the blue endpoint of the blue loop for the diffusive mixing model of the star can successfully surpass the predicted blue edge and can also reach the value of the effective temperature of the bluest observed Cepheid star EV Sct. On the contrary, the classical model of the same mass only develops a rather suppressed blue loop and it cannot arrives at even the red edge of the Cepheid instability strip. However, for the models of both the classical and diffusive mixing model can successfully predict the existence of the three uppermost Cepheids. Besides, for the other 17 non-variable stars our diffusive mixing models of both and are basically in agreement with the observations. In addition, from Fig.10 we may infer that the masses of the nine observed Cepheids will be greater than but smaller than . We use the David Dunlap Observatory online Galactic classical Cepheids database (Fernie et al. 1995), for they have small uncertainties in the distance modulus and color excess (Chiosi et al. 1992). From the database we extract the mean color excess , absolute magnitude , and color index of all the contained Cepheids (about 500) to get their distribution in the HR diagram through the following transforms: 1) the effective temperature: , where is the intrinsic color index (Kraft 1961); 2) the luminosity: , where is the absolute bolometric magnitude and is the bolometric correction (the same as in Schmidt 1984). The result is shown in Fig.11 and represented by ’’ symbol. Simultaneously the luminosities of these Cepheids are verified by the period-luminosity relation (resulted from the period-radius relation of Gierren et al. (1989), the relation of the color index and period of Fernie (1990), and the relation of the color index and effective temperature of Kraft (1961)) and represented by ’’ symbol. We have found that the difference of the obtained results from the two methods is very small and the relative difference is less than . From Fig.11 it can be found that the blue loop of the star with the diffusive mixing model is in good agreement with the observations, its bluest endpoint perfectly arriving at the position of the bluest Cepheid.
The result of Schmidt (1984) is also shown in Fig.10 and Fig.11, those stellar models being also based on the same masses of and with the same chemical compositions (Y, Z)=(0.28, 0.02). It can be seen that the dashed line labeled with ’Schmidt’, which connecting the two bluest endpoints of the blue loops belonging respectively to the and models, is located at a too much luminous place, and can not predict those observed less massive Cepheids below it. El Eid (1995) made some improvements on the opacities and nuclear reactions into their evolutionary code, and the element mixing in both core and envelope convection regions being treated as a diffusive process. The obtained results are shown as a dashed line labeled with ’El Eid’ in Fig.10 and Fig.11. It can be seen that their results predict most of the observed low mass Cepheid and are in better agreement with the observations. The dashed line labeled with ’TP’ based on our results is steeper than the others. In other words, our theoretical results can predict more Cepheids with smaller masses. But there are still a few low mass Cepheids shown in Fig.11 below the predicted region.
6.2 Number Ration of Blue to Red Stars

As we have mentioned in the Introduction, the observed ratio of blue to red giants can be used to probe stellar models related to some physic processes, for example, the convection. On the theoretical side, the counterpart of is usually referring to the time ratio of the core helium burning staying at the blue and red side in the HR diagram, namely , and the dividing line is taken at as in the works of Stothers & Chin (1993) and El Eid( 1995). The dividing line defined above just corresponds to the one of the classification of blue and red supergiants according to the spectral classes, that is, the boundary between G and K spectral classes. The values of depending on the diffusive mixing model’s parameter and the TCM’s parameter are given in Table 3 and Table 4, respectively, for the and star. In Table 3 it can be found that the value of increases with each of the two parameters when the other is fixed, which is in accordance with the extension of the blue loop depending on the two parameters. It can be seen in Table 3 that for the diffusive mixing models with the parameters in the ranges and , the obtained is confined in the range 0.3330.843, which cover the results 0.58 or 0.69 in the work of El Eid (1995) depending on different convection models, but lower than 1.152 obtained in the paper of Deng et al. (1996b). Similarly the value of for the star of shown in Table 4 also increases with the values of the two parameters, and the largest one is equal to 1.342, which is very close to the values 1.33 in the work of El Eid (1995), 1.66 (in Maeder & Meynet 1989), 0.52.1 (in Carson & Stothers 1976), 1.44 (in Bertelli et al. 1985), and 1.263 (in Deng et al. 1996b). However, these values are derived from different treatments of convection. It needs to point out that for the classical model with the MLT the is 0.284 for star and zero for star. These results manifest that the diffusive mixing model can significantly extend the duration of the models staying in the blue side of the HR diagram, even though the length of the blue loop for the star is comparable with that of the classical model with the MLT as shown in Fig.4. This can be further confirmed by the result in Fig.12. The reason is that the blue loop for the diffusive mixing model will be formed at a higher value of the central He abundance compared with the case of the classical model with the MLT.
The value of for one cluster suffers from many uncertainties. In general, the incompleteness of the number of the observed red stars is more severe than that of the blue stars, because faint and highly reddened stars have simply not been observed (Humphreys & McElroy 1984). This will lead to a higher than the real one and lead to an inaccurate value. The photometric data suffer from uncertainties of the distance modulus and color excesses accounted for the interstellar extinction. They are differently based on , , , photometry (Stothers 1991). Turner et al. (1998) give the average uncertainty in the color index being . Therefore, the average uncertainties of the distance modulus and color excesses are and , respectively. Furthermore, the uncertainties in lg and lg are respectively and . And the conversion to the luminosities and effective temperatures of stars is of uncertainty based on the photometric data. For example, if the conversion of is adopted, the uncertainty of lg is (Schmidt 1984). However, the spectroscopic data can provide a more accurate assessment of the effective temperature, but the star counts available is comparatively small (Eggenberger et al. 2002). Contamination by field stars can increase both and . The separation of field star from cluster members can be done using information of proper motion, radial velocities, spectral types, color-color diagram and so on (Meylan & Maeder 1982). The proper motion is regarded as a better one (Mohan & Sagar 1988), but it is hard to obtain its observational data (Harris 1976). Harris (1976) found that the uncertainty caused by the field star contamination increase with the age of the open cluster age group. For his ’III, IV’ age groups (the involved evolving stars in region of ) we find that the uncertainty of due to the field star is . With respect to the uncertainty caused by the dynamical evolution of a cluster, during the last phase of lifetime of a cluster low-mass stars will be evaporated due to the relaxation process of star-star encounters, while more massive stars will sink towards the cluster center (Nordström et al. 1997; Vesperini et al. 2009). However, before such phase high-mass stars will evolve for at least year (the typical lifetime of open clusters) (Lada & Lada 2003), and some blue and red giants will be produced for such time interval. Most of these giants will not be ejected when the evaporation of stars occurs, because they are more massive ones. Therefore, the dynamical evolution of a cluster has less significant effect on the value of . Furthermore, the value of has been shown to vary through galaxies and clusters (e.g. Langer & Maeder 1995). In addition, based on spectroscopic data the star counts is referred to either O, B, A, F, G type stars (e.g. Deng et al. 1996b) or only O, B, A type ones (e.g. Eggenberger et al. 2002). And there is a relative error (no more than ) of the ratio rested on whether the breathing convection (Castellani et al. 1985) is occurred or not. Therefore, taking these uncertainties into account the average of some clusters are usually adopted to make a comparison with a theoretical counterpart, and we merely expect the agreement between the value of and that of to be achieved to a certain extent.
In the following comparisons only the Galactic open clusters are concerned, in order to satisfy the requirements of the input physics of the stellar models described in Section 3. In the work of Carson & Stothers (1976) the values of were found to be 0.33 and about 1.0 respectively for their middle-age clusters and young ones, and the correlated initial masses of the evolved giants for the two age groups they obtained, were roughly equal to and respectively. It is obvious that the results of our classical models with the MLT of and can not achieve these observed values. However, our results with the diffusive mixing model in Table 3 and Table 4 can cover them. It can be found that the parameter set of and or and for the star of and a particular combination of the model parameters in the range of and for the star of result in the best fit to the observations. There are comparatively more stars to be counted in the paper of Stothers (1991). The value of in their intermediate age clusters corresponding to intermediate mass stars in the range to is from 0.37 to 0.55 depending on the adopted sources and the average for these sources is 0.42. Comparing to our results, we find that our values of for the star in Table 3 can reproduce those values, and the two model parameters can be confined accordingly in the range of and . Nevertheless, for the star two suitable ranges are obtained: when or when . Fortunately, the correlated initial masses to the source of Harris (1976) adopted by them is very close to , and the value of from this source is 0.55 for both the III and IV age groups. From this value we find that the values of the two model parameters can still be confined in the same range. With respect to our model of , the result of Maeder & Meynet (1989) is taken into account, in which is in a range from 0.55 to 3.0 and its average value is about 1.0 as in the paper of Carson & Stothers (1976). Furthermore, the above average value of Maeder & Meynet(1989) should be corrected to be in the range of 1.0 to 1.3 accounting for throwing off one unusual young cluster according to their own analysis. It can be seen that these observed values are close to our results of for the star with the diffusive mixing model of when .
7 Concluding remarks
The principal aim of this work is to study the effect of chemical mixing by turbulent convection in the convective envelope of intermediate-mass stars on the formation and extension of the blue loop in the HR diagram based on the TCM proposed by Li & Yang (2007). We have used the TCM to self-consistently obtain the whole outer convective envelope including the so-called overshooting region. The chemical mixing in such region is disposed as a diffusive process, of which the diffusive coefficient completely depends on the characteristics of the turbulent convection in this region. We have proposed a new reasonable formula of the diffusion coefficient. There are two parameters concerned by us. They are respectively diffusion parameter in the diffusive mixing model and parameter similar to the mixing length parameter in the MLT. We have presented evolutionary sequences for stellar models of , and . Different values of the two parameters at last result in differences among the obtained blue loops, which critically depends on the correction of the hydrogen profile above the H burning shell, and thus result in the different theoretical predictions of the observed number ratio of stars in the blue and red part of the HR diagram. The conclusions can be summarized as follows.
1) Comparing with the results of the classical model with the MLT, the main improvement achieved by the diffusive mixing model is the correction of the element profiles above the H burning shell during the RGB phase. Two choices of the mixing length appeared in the formula of the diffusive coefficient in Eq.(2), namely and , lead to a very similar correction of the element profiles and thus have little difference in the later evolutionary results. And the slope of the hydrogen profile in the overshooting region is mainly determined by parameter , and the overshooting distance is mainly determined by parameter .
2) The length of the blue loop is increased with different combinations of the values of and compared to the results of the classical model with the MLT, and the increment for the model of is more prominent than that of the star for a same set of the two parameters, but the increment for the model of is less obvious. In addition, a larger value of is given, a lower luminosity of the RGB tip and a hotter effective temperature of it are obtained, when is fixed, and vice versa.
3) Due to the increase of opacity in the overshooting region caused by the diffusive mixing model, the H-shell nuclear luminosity will be decreased in a much faster manner when the star evolves from the RGB tip to its bottom. And thus the outer homogeneous convection zone will be receded outward in a faster way that there is less energy provided by the H-shell burning. Additionally, opacity in the homogeneous convection zone will be decreased. At last a much weaker and smaller convection zone in the stellar envelope will be formed at the base of the RGB, which then leads to a longer blue loop.
4) Comparing to the observed location of the Cepheid instability strip the parameters of our diffusive mixing model are confined in a range: and .
5) Our results of based on the diffusive mixing model are on the whole in accordance with not only other theoretical ones but also the observations. By comparing our results of the ratio with the observed number ratio of blue to red evolved stars in the Galactic open clusters we find that the parameters of the diffusive mixing model for the star should be confined to: and , which is the same range as the result from the comparisons of the location of the Cepheid instability strip. While for the star, the observational data with considerable scatters correspond to several possible combinations of the parameters such as , and or when or when . Anyway, our values derived from the diffusive mixing model within the ranges of and adopted in the present paper can almost cover these different observational data.
It needs to point out that there are many factors to affect the properties of the blue loop, as Iben (1993) have already argued that the properties of the blue loop cannot be related to a single factor or effect. Many effects are still not fully understood (El Eid 1995; Valle et al. 2009), especially for the effect of convection.
Acknowledgements.
This work is supported by the National Natural Science Foundation of China (Grant No. 10973035 and No. 10673030). Fruitful discussions with Q.-S. Zhang, C.-Y. Ding and J. Su are highly appreciated.References
- Alexander & Ferguson (1994) Alexander, D. R., & Ferguson, J. W. 1994, ApJ, 437, 879
- Alongiet al. (1991) Alongi, M., Bertelli, G., Bressan, A., & Chiosi, C. 1991, A&A, 244, 95
- Bahcallet al. (1995) Bahcall, J. N., Pinsonneault, M. H., & Wasserburg, G. J. 1995, Rev. Mod. Phys., 67, 781
- Beaudetet al. (1967) Beaudet, G., Petrosian, V., & Salpeter, E. E. 1967, ApJ, 150, 979
- Bertelliet al. (1985) Bertelli, G., Bressan, A. G., & Chiosi, C. 1985, A&A, 150, 33
- Böhm-Vitense (1958) Böhm-Vitense, E. 1958, Z. Astrophys., 46, 108
- Brunish & Becker (1990) Brunish, W. M., & Becker, S. A. 1990, ApJ, 351, 258
- Canuto (1994) Canuto, V. M. 1994, ApJ, 428, 729
- Canuto (1998) Canuto, V. M. 1998, ApJ, 508, L103
- caputoet al. (2005) Caputo, F., Bono, G., Fiorentino, G., Marconi, M., & Musella, I. 2005, ApJ, 629, 1021
- Carson & Stothers (1976) Carson, T. R., & Stothers, R. 1976, ApJ, 204, 461
- Castellaniet al. (1985) Castellani, V., Chieffi, A., Pulone, L., & Tornamè, A. 1985, ApJ, 296, 204
- Caughlan & Fowler (1988) Caughlan, G. R., & Fowler, W. A. 1988, Atom. Data Nuc. Data Tables, 40, 283
- Chiosiet al. (1992) Chiosi, C., Wood, P., Bertelli, G., & Bressan, A. 1992, ApJ, 387, 320
- Denget al. (1996a) Deng, L., Bressan, A., & Chiosi C. 1996a, A&A, 313,145
- Denget al. (1996b) Deng, L., Bressan, A., & Chiosi C. 1996b, A&A, 313,159
- Eggenbergeret al. (2002) Eggenberger, P., Meynet, G. & Maeder, A. 2002, A&A, 386, 576
- Eggleton (1983) Eggleton, P. P. 1983, MNRAS, 204, 449
- El Eid (1995) El Eid, M. F. 1995, MNRAS, 275, 983
- Fernieet al. (1995) Fernie, J. D., Evans, N. R., Beattie, B., & Seager, S. 1995, Infor. Bull. Variable Stars, 4148, 1 http://www.astro.utoronto.ca/DDO/research/cepheids/
- Fernie (1990) Fernie, J. D. 1990, ApJ, 354, 295
- Gierenet al. (1989) Gieren, W. P., Barnes, T. G., & Moffett, T. J. 1989, ApJ, 342, 467
- Grabroskeet al. (1973) Grabroske, H. C., de Witt, H. E., Grossman, A. S., & Cooper, M. S. 1973, AJ, 181, 457
- Hammeret al. (2005) Hammer, J. W., Fey, M., Kunz, R., et al. 2005, Nucl. Phys. A, 758, 363
- Harris (1976) Harris, G. L. H. 1976, ApJS, 30, 451H
- Herwig (1997) Herwig, F. 1997, A&A, 324, L81
- Herwig (2000) Herwig, F. 2000, A&A, 360, 952
- Huang & Weigert (1983) Huang, R.-Q., & Weigert, A. 1983, A&A, 127, 309
- Humphreys & McElroy (1984) Humphreys, R. M., & McElroy, D. B. 1984, ApJ, 284, 565
- Iben (1993) Iben, I. Jr. 1993, ApJ, 415, 767
- Iglesias & Rogers (1996) Iglesias, C. A., & Rogers, F. J. 1996, ApJ, 496, L121
- Kraft (1961) Kraft, R. P. 1961, ApJ, 134, 616
- Lada & Lada (2003) Lada, C. J., & Lada, E. A., 2003, Annu. Rev. Astron. Astrophys., 41, 57
- Langer & Maeder (1995) Langer, N., & Maeder, A. 1995, A&A, 295, 685
- Li (1993) Li, Y. 1993, A&A, 276, 357
- Li & Yang (2007) Li, Y., & Yang, J.-Y. 2007, MNRAS, 375, 388
- Maeder & Meynet (1989) Maeder, A. & Meynet, G. 1989, A&A, 210, 155
- Matraka et al. (1982) Matraka, B., Wassermann, C., & Weigert A. 1982, A&A, 107, 283
- Meylan & Maeder (1982) Meylan, G., & Maeder, A. 1982, A&A, 108, 148
- Mohan & Sagar (1988) Mohan, V., & Sagar, R. 1988, Bull. Astr. Soc. India, 16, 159
- Nordstrom et al. (1997) Nordström, B., Andersen, J., & Andersen, M. I. 1997, A&A, 322, 460
- Ramadurai (1976) Ramadurai, S. 1976, MNRAS, 176, 9
- Renzini (1987) Renzini, A. 1987, A&A, 188, 49
- Renzini et al. (1992) Renzini, A., Greggio, L., Ritossa, C., & Ferrario, L. 1992, A&A, 400, 280
- Ritossa (1996) Ritossa, C. 1996, MNRAS, 281, 970
- Robinson (2004) Robinson, F. J., et al. 2004, MNRAS, 347, 1208
- Rogers (1994) Rogers, F. J., 1994, in IAU Colloquium 147, The Equation of State in Astrophysics, eds. G. Chabrier, & E. Schatzman (Cambridge: Cambridge Univ. Press), 16
- Rogers& Iglesias (1995) Rogers, F. J., & Iglesias, C. A. 1995, in ASP. Conf. Ser. 78, Astrophysical Applications of Powerful New Databases, eds. S. J. Adelman, & W. L. Wiese (San Francisco: ASP), 78
- Rogerset al. (1996) Rogers, F. J., Swenson, F. J., & Iglesias, C. A. 1996, ApJ, 456, 902
- Salasnich et al. (1999) Salasnich, B., Bressan, A., & Chiosi, C. 1999, A&A, 342, 131
- Saslow & Schwarzchild (1965) Saslow, W. C., & Schwarzchild, M. 1965, ApJ, 142, 1468
- Schmidt (1984) Schmidt, E. G. 1984, ApJ, 287, 261
- Schröer et al. (1997) Schröer, K.-P., Pols, O. R., & Eggleton, P. P. 1997, MNRAS, 285, 696
- Shaviv & Salpeter (1973) Shaviv, G., & Salpeter, E. E. 1973, ApJ, 184, 191
- Stothers (1991) Stothers, R. B. 1991, ApJ, 383, 820
- Stothers & Chin (1991) Stothers, R. B., & Chin, C. 1991, ApJ, 374, 288
- Stothers & Chin (1993) Stothers, R. B., & Chin, C. 1993, ApJ, 412, 294
- Stothers & Chin (1994) Stothers, R. B., & Chin, C. 1994, ApJ, 431, 797
- Sweigart (1997) Sweigart, A. V. 1997, ApJ, 474, L23
- Turner et al (1998) Turner, D. G., Pedreros, M. H., & Walker, A. R. 1998, ApJ, 115, 1958
- Valle et al. (2009) Valle, G., Marconi, M., Degl’Innocenti, S., & Prada Moroni, P. G. 2009, A&A, 507, 1541
- Vandenberg & Smith (1988) Vandenberg, D. A., & Smith, G. H. 1988, PASP, 100, 314
- Ventura & D’Antona (2005) Ventura, P., & D’Antona, F. 2005, A&A, 431, 279
- Vesperini et al (2009) Vesperini, E., McMillan, S., & Portegies Zwart, S. 2009, ApJ, 698, 615
- Xiong (1985) Xiong, D.-R. 1985, A&A, 150, 133
- Xiong (1986) Xiong, D.-R. 1986, A&A, 167, 239
- Xu & Li (2004a) Xu, H.-Y., & Li, Y. 2004a, A&A, 418, 213
- Xu & Li (2004b) Xu, H.-Y., & Li, Y. 2004b, A&A, 418, 225