A Search for Infrared Emission from Core-Collapse Supernovae at the Transitional Phase
Abstract
Most of the observational studies of supernova (SN) explosions are limited to early phases ( a few yr after the explosion) of extragalactic SNe and observations of SN remnants ( 100 yr) in our Galaxy or very nearby galaxies. SNe at the epoch between these two, which we call “transitional” phase, have not been explored in detail except for several extragalactic SNe including SN 1987A in the Large Magellanic Cloud. We present theoretical predictions for the infrared (IR) dust emissions by several mechanisms; emission from dust formed in the SN ejecta, light echo by circumstellar and interstellar dust, and emission from shocked circumstellar dust. We search for IR emission from 6 core-collapse SNe at the transitional phase in the nearby galaxies NGC 1313, NGC 6946, and M101 by using the data taken with the AKARI satellite and Spitzer. Among 6 targets, we detect the emission from SN 1978K in NGC 1313. SN 1978K is associated with of silicate dust. We show that, among several mechanisms, the shocked circumstellar dust is the most probable emission source to explain the IR emission observed for CSM-rich SN 1978K. IR emission from the other 5 objects is not detected. Our current observations are sensitive to IR luminosity of , and the non-detection of SN 1962M excludes the existence of the shocked circumstellar dust for a high gas mass-loss rate of . Observations of SNe at the transitional phase with future IR satellites will fill the gap of IR observations of SNe with the age of years, and give a new opportunity to study the circumstellar and interstellar environments of the progenitor, and possibly dust formation in SNe.
Subject headings:
dust, extinction — supernovae: general — supernovae: individual (SNe 1909A, 1917A, 1951H, 1962M, 1968D, 1978K) — infrared: stars1. Introduction
Core-collapse supernovae (SNe) are the explosions of massive stars at the end of their lives. SN ejecta expand into the interstellar medium (ISM) or circumstellar medium (CSM) with a huge kinetic energy ( erg). First, SN ejecta experience a free expansion. As the ejecta sweep up the surrounding material, the SN begins to decelerate. When the swept-up mass becomes comparable to the mass of the SN ejecta at a few hundreds yr (hereafter denotes the time after the explosion), the SN ejecta expand self-similarly (so-called Sedov phase). Finally, the SN merges into the ISM at yr.
Observational studies of SNe have been performed mainly by the two distinct ways. One is the observations of extragalactic SNe at their early phases ( yr), and the other is observations of supernova remnants (SNRs, 100 yr) in our Galaxy or very nearby galaxies. In contrast, SNe at the epoch between these two ( yr), which we call “transitional” phase, have not been explored in detail. At such epochs, only a few objects have been studied. The best case is SN 1987A in the Large Magellanic Cloud (McCray, 2007, and references therein). Other examples include several X-ray SNe (e.g., Immler & Kuntz 2005; Immler et al. 2005; Soria & Perna 2008), and long-lasting SNe, such as SNe 1978K (Ryder et al., 1993; Schlegel et al., 1999, 2000, 2004; Lenz & Schlegel, 2007; Smith et al., 2007) and 1988Z (Williams et al., 2002; Schlegel & Petre, 2006). See also a recent paper on SN 1980K by Sugerman et al. (2012).
This transitional phase is important to understand a long term evolution of SNe, from SN to SNR. A recent study by Larsson et al. (2011) shows that SN 1987A, in fact, experiences a transition from SN to SNR in this phase. However, since most observations of SNe at transitional phase except for SN 1987A have been performed at X-ray or radio wavelengths, the entire properties of SNe at the transitional phase are not fully understood.
| Host Galaxy | Distance | SN | SN Type | Position | Position Ref. | |
|---|---|---|---|---|---|---|
| (Mpc) | (J2000.0) | (J2000.0) | ||||
| NGC 1313 | SN 1962M | II | 03h18m12.2s | 66∘31′38′′ | 1 | |
| SN 1978K | IIn | 03h17m39.0s | 66∘33′048′′ | 2 | ||
| NGC 6946 | SN 1917A | II | 20h34m46.90s | +60∘07′29.08′′ | 3 | |
| SN 1968D | II | 20h34m58.41s | +60∘09′34.48′′ | 4 | ||
| M101 | SN 1909AaaSN 1909A is out of field of view in the IRC images, and only in the Spitzer/MIPS image. | II peculiar | 14h02m03.1s | +54∘27′58′′ | 3 | |
| SN 1951H | II | 14h03m55.3s | +54∘21′41′′ | 3 | ||
| Galaxy | Date | Observation ID | Exposure Time (s) | |||
|---|---|---|---|---|---|---|
| NIR, MIR-S | MIR-L | NIR, MIR-S | MIR-L | NIR | MIR-S, L | |
| NGC 1313 | 2006 Dec 3 | 2006 Dec 4 | 1400416-001 | 1400417-001 | 178 | 196 |
| NGC 6946 | 2006 Dec 18 | 2007 Jun 16 | 1400620-001 | 1402217-001 | 178 | 196 |
| M101 | 2007 Jun 14 | 2007 Jun 17 | 1402211-001 | 1402212-001 | 178 | 196 |
In this paper, we present the results of our search for infrared (IR) emission from core-collapse SNe at the transitional phase. IR emission from SNe is expected to arise from dust associated with SNe. There are 3 possible populations of dust grains, according to their locations; (1) dust formed in the ejecta of SNe (SN dust), (2) dust formed by the pre-SN stellar wind, which is now located in the circumstellar region (CS dust), and (3) interstellar dust (IS dust). CS and IS dust can contribute to the IR emission by absorbing the radiation from SNe and reemitting it (light echo). CS dust is also heated and can also emit IR emission when it is swept up by the SN shock. In these ways, dust grains in and around SNe convert the large kinetic energy and luminosity of the SNe into the IR luminosity. Thus, IR observations of SNe can be used as a probe of the progenitor environment.
In Section 2, we describe the target selection, the data used in the analysis, and results of photometry. We use the data taken with two IR satellites, AKARI satellite (Murakami et al., 2007) and Spitzer (Werner et al., 2004), which provide the deepest images in near-IR (NIR) and mid-IR (MIR) wavelengths. Dust models used in this paper are shown in Section 3. Among 6 targets, we detect IR emission from SN 1978K. The origin of this emission is discussed in Section 4. In Section 5, theoretical predictions for the IR emission from normal SNe at the transitional phase are summarized, and implications of non-detection of 5 SNe are discussed. Prospects for future observations are discussed in Section 6. Finally, we summarize the conclusions in Section 7.
2. Targets and Observations
| Galaxy | Date | Exposure Time (s) | Observing mode | AOR key | Program ID |
|---|---|---|---|---|---|
| NGC 1313 | 2007 Sep 29 | 42 | Medium Scan | 22618112 | 40204: Kennicut et al. |
| NGC 6946 | 2007 Jul 10 | 493 | Photometry | 18271232 | 30494: Sugerman et al. |
| M101 | 2008 Jan 5 | 42 | Medium Scan | 21380144 | 40352: Rieke et al. |
| SN | Age aa Age is given as year after the discovery, which is a sound approximation for the age after the explosion. | Flux (mJy)bb Values in parenthesis for SN 1978K represents error including the measurement error and the calibration error (5 ). In the case of non-detection, upper limit is given. | ||||||
|---|---|---|---|---|---|---|---|---|
| (yr) | IRC/N3 | IRC/N4 | IRC/S7 | IRC/S11 | IRC/L15 | IRC/L24 | MIPS/24m | |
| SN 1962M | 44.0 | 0.2 | 0.2 | 0.2 | 0.2 | 0.9 | 2 | … |
| 44.9 | … | … | … | … | … | … | 1 | |
| SN 1978K | 28.4 | 0.074 (0.014) | 0.086 (0.010) | 0.287 (0.039) | 2.85 (0.24) | 2.53 (0.13) | 2.73 (0.20) | … |
| 29.2 | … | … | … | … | … | … | 3.06 (0.40) | |
| SN 1917A | 89.5 | 0.1 | 0.2 | 8 | 6 | … | … | … |
| 90.0 | … | … | … | … | 10 | 10 | … | |
| 90.0 | … | … | … | … | … | … | 10 | |
| SN 1968D | 38.8 | 0.3 | 0.3 | 4 | 5 | … | … | … |
| 39.3 | … | … | … | … | 6 | 8 | … | |
| 39.4 | … | … | … | … | … | … | 5 | |
| SN 1909A | 99.0 | … | … | … | … | … | … | 0.7 |
| SN 1951H | 55.9 | 0.07 | 0.1 | 0.4 | 0.6 | 1 | 3 | … |
| 56.3 | … | … | … | … | … | … | 1 | |
2.1. Targets
To search for IR emission from SNe at the transitional phase, we target 7 core-collapse SNe, namely SNe 1909A, 1917A, 1951H, 1962M, 1968D, and 1978K, discovered in three very nearby galaxies NGC 1313, NGC 6946, and M101. These targets are selected based on the proximity to the host galaxy and the availability of NIR and MIR imaging data taken with the IRC (Onaka et al., 2007) onboard the AKARI satellite (Murakami et al., 2007). General information on our targets is summarized in Table 1.
Note that SN 1948B (Type II) in NGC 6946 is excluded because of the uncertainty in its position. SNe 1939C and 1969P in NGC 6946 are also excluded since SN 1939C is classified as merely Type I (either core-collapse SNe or Type Ia SNe) and the type of SN 1969P is unknown. SN 1980K is also located in NGC 6946. But since it is found that AKARI data are not as deep as the data presented by Sugerman et al. (2012), we do not include SN 1980K. SN 1970G (Type IIL) in M101 is excluded because the SN position is heavily contaminated by the H II region NGC 5455 (Fesen, 1993).
For the distance to NGC 1313, we adopt Mpc, which is estimated from the tip of the red giant branch (Méndez et al., 2002). We use this value since it was also used by Lenz & Schlegel (2007) and Smith et al. (2007) for the study of SN 1978K. For NGC 6946, there are several distance measurements. We adopt the average value of Mpc from the the H I Tully-Fisher relation (Pierce, 1994), the CO Tully-Fisher relation (Schoniger & Sofue, 1994), and the expanding photosphere method of Type II SN 1980K (Schmidt et al., 1994) and SN 2004et (Sahu et al., 2006). The distance to M101 is assumed to be Mpc, which is estimated by the Cepheid calibration (Freedman et al., 2001).
2.2. AKARI IRC Data
The AKARI/IRC equips three channels, i.e., NIR (1.85.5 m), MIR-S (4.613.4 m) and MIR-L (12.626.5 m). Each channel has about a field of view. The NIR and MIR-S share the same field of view while the MIR-L observes a sky about 25’ away. Thus, the data we use in this paper consist of two observational sequences. The pixel scales of the detectors are , , and for the NIR, MIR-S and MIR-L, respectively.
We use the archived imaging data taken in the AKARI mission program ”ISM in our Galaxy and Nearby galaxies” (ISMGN; Kaneda et al. 2009). The data are taken with the two-filter mode [Astronomical Observation Template (AOT) IRC02, see Onaka et al. (2007)]. We use 6 band images in total, i.e., N3 (reference wavelength 3.2 m), N4 (4.1 m), S7 (7.0 m), S11 (11.0 m), L15 (15.0 m), and L24 (24.0 m). The wavelength coverage with the response larger than of the peak is 2.73.8 m, 3.65.3 m, 5.98.4 m, 8.513.1 m, 12.619.4 m, and 20.326.5 m for N3, N4, S7, S11, L15, and L24, respectively. For more details of the IRC instrument, see Onaka et al. (2007). The log of observations is summarized in Table 2.
The data were reduced by using the IRC imaging pipeline software version 20091022 (see Lorente et al., 2007, for details). The pipeline performs the basic reduction, e.g., correction of bad pixels, subtraction of dark current, rejection of cosmic rays, linearity correction, flat fielding, and co-adding of the frames.
To determine the accurate position, we match the sources in the N3, N4 and S7 band images with those in Two Micron All Sky Survey catalog (Skrutskie et al., 2006). The uncertainty in the position is for the N3 and N4 band images, and for the S7 band images. Then, the S11, L15 and L24 images are matched with S7 images. In these images, the uncertainty in position is estimated as , which is larger than that in the N3, N4 and S7 images because the matching is based on a small number of common sources in the field of view.
To obtain the flux densities of the sources, we perform aperture photometry with the aperture of 10 pixel and 7.5 pixel for the NIR and MIR-S/L bands, respectively, As the background, we use the annulus of 5 pixel width just outside of the aperture radius. When the SN is located at the edge of the image, the aperture correction is applied. The flux is calibrated by following Lorente et al. (2007). Color correction is not performed to the derived photometry because the intrinsic spectral shape of the source is not known. Instead, we apply correction to the model when it is compared with the observations (see Section 3).
When the SN is not detected, we derive an upper limit of the flux by putting an artificial source and measuring the flux of the source. For this purpose, we need a point spread function (PSF) of each image. For the N3 and N4 images, PSF is constructed by the point sources in the same image. Since there are not many sources in the S7, S11, L15 and L24 images, we use an average PSF constructed from sources in different fields (Arimatsu et al., 2011).
2.3. Spitzer MIPS Data
In addition to the AKARI/IRC data, we use archive data taken with the Multiband Imaging Photometer for Spitzer (MIPS, Rieke et al., 2004) onboard Spitzer (Werner et al., 2004).
All the 6 SNe are within the field of view of some observations with the MIPS 24 m band. NGC 1313 was observed with the scan mode in the Spitzer Local Volume Legacy program (Dale et al., 2009). M101 was also observed with the scan mode by Gordon et al. (2008). SNe 1917A and 1968D in NGC 6946 are within the field of SN 2002hh (Meikle et al., 2006). A summary of the data, including the Astronomical Observation Request (AOR) keys, Program IDs and PI names, is shown in Table 3.
We use the post-basic calibrated data (PBCD) products, which are produced by the Spitzer pipeline. The pixel scale of the final image is . The reference wavelength of the MIPS 24 m band is 23.68 m and the wavelength coverage is 20.5 m – 28.5 m (the range where the response is of the peak). The positional uncertainty is .
For photometry, we perform aperture photometry. When the SN is not detected, we derive an upper limit of the flux by putting an artificial source around the SN position. We constructed a PSF from point sources in the scan mode images of NGC 1313 and M101 and use it to derive the upper limits.
The Spitzer/MIPS data are found to be slightly deeper than the AKARI/IRC data at 24 m (Section 2.4). Thus, we use MIPS data for the flux of 24 m.
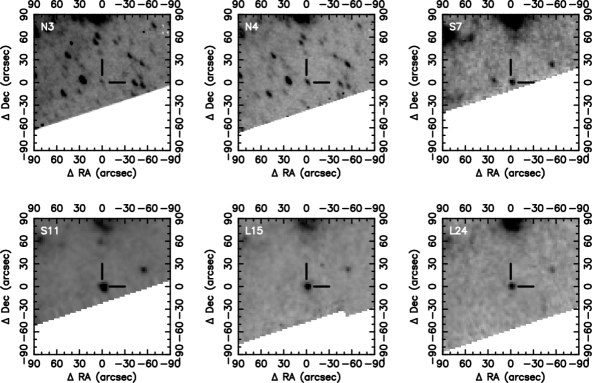
2.4. Results of Photometry
We detect IR emission associated with SN 1978K in all the bands (Table 4). Figure 1 shows the AKARI/IRC images around SN 1978K (180” 180” section). The source has an extremely red color with a flux ratio of (S7)/(S11) = 0.1, which is out of a typical range in the spiral arm and the inter-arm of the galaxy (, Sakon et al. 2007). The origin of this emission is discussed in Section 4.
For the other 5 objects, we do not detect a significant signal from SNe. Upper limits of the flux are shown in Table 4.
3. Dust Models
In the following sections, we compare the observations with various model spectra. We consider two types of carbon dust grains, i.e., amorphous carbon and graphite, and two kinds of silicate dust grains, i.e., “astronomical silicate” and forsterite (). We assume that grains are spherical.
Thermal emission flux from the dust toward a SN can be expressed as follows;
| (1) |
where is the total dust mass, and are, respectively, the density and the radius of the dust grain, is the absorption efficiency factor, is the temperature of the dust, and is the distance to the SN. We assume a single temperature for simplicity. In the equation above, all of the IR emission from dust grains is assumed to be detected without being absorbed.
We consider a single size of dust m. In reality, there is a distribution in the grain size, and if dust grains are swept up by the shock waves of the SN, their size distribution can change with time (Nozawa et al., 2007). However, is independent of the grain size if , and thus, the assumption of the single-size dust does not affect the estimate of the dust mass.
For the grain densities, we adopt 2.26, 2.26, 3.8, and 3.2 for amorphous carbon, graphite, astronomical silicate, and forsterite, respectively. The absorption efficiency factor is taken from Edoh (1983) for amorphous carbon, Draine (2003b) for graphite and astronomical silicate, and Semenov et al. (2003) for forsterite.
Since the observed flux in Table 4 is not color-corrected due to the unknown intrinsic spectrum of the sources, we apply the color corrections to the model. Since the flux density of the AKARI/IRC data refers to the spectrum , the following correction is applied to the model spectrum ;
| (2) |
Here, is the reference wavelength of the band, and is the response function (electron energy-1). We use the response function measured in the laboratory 111http://www.ir.isas.jaxa.jp/AKARI/Observation/ (see Onaka et al., 2007; Lorente et al., 2007). The calibration of the Spitzer/MIPS data uses the blackbody spectrum with K as the reference. Thus, we apply the following correction;
| (3) |
We use the response function provided by the Spitzer Science Center 222http://ssc.spitzer.caltech.edu/mips/calibrationfiles/.
4. IR Emission from SN 1978K
4.1. Spectral Fit
Among our 7 targets, we detect IR emission only from SN 1978K. SN 1978K is an extraordinarily strong Type IIn SN, which is visible both in radio and X-ray even at yr after the explosion (Ryder et al., 1993; Petre et al., 1994; Chugai et al., 1995; Schlegel et al., 1996; Montes et al., 1997; Schlegel et al., 1999; Chu et al., 1999; Schlegel et al., 2000, 2004; Lenz & Schlegel, 2007; Smith et al., 2007). Such long-lasting radio and X-ray emissions are clear evidence for the presence of the dense circumstellar medium, with which the SN ejecta has been interacting (Chevalier, 1982; Chevalier & Fransson, 1994; Chugai et al., 1995).
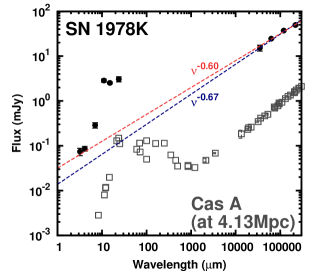
Figure 2 shows the spectral energy distribution (SED) of SN 1978K from IR to radio wavelengths (filled circles). The SED of Cassiopeia A (Cas A) at the distance of NGC 1313 is also shown for comparison (open squares). These two objects show similar overall SEDs from IR to radio wavelengths.
Since SN 1978K is powerful in radio wavelengths (Smith et al., 2007), we must take into account the influence of the synchrotron emission on the IR bands (see e.g., Mezger et al., 1986; Rho et al., 2003; Dwek, 2004; Hines et al., 2004; Barlow et al., 2010, for the case of Cas A). The radio emission of SN 1978K is well fitted by a power-law spectrum (Montes et al., 1997; Smith et al., 2007). When we fit the flux of 4 radio bands of SN 1978K (Smith et al., 2007), we derive (blue dashed line in Figure 2). The flux densities at the N3 and N4 bands are almost in line with the power-law spectrum. If we include the flux of these 2 bands for the fitting, we obtain (red dashed line). Since these two values are consistent within the error, we assume that the emissions at the N3 and N4 bands are of synchrotron origin and use in the following discussions.
The flux density of the S7, S11, L15, and L24 (MIPS 24 m) bands is clearly above the synchrotron component. Therefore, we conclude that this excess is caused by the dust emission associated with SN 1978K.
 |
 |
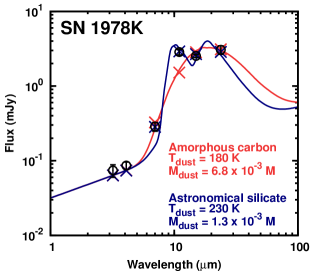
We fit the observed flux with the model spectra of the 4 dust species with the dust temperature and mass as parameters. The quality of the fit is judged by for the 4 observational points, i.e., the IRC S7, S11, L15, and MIPS 24 m bands. For each dust species, we choose the best model that gives the smallest . Since the dependence on the temperature and mass is simple, the fit is unique, i.e., there is no other solution with a different set of temperature and mass.
Among the 4 dust species, the smallest is obtained for astronomical silicate with K and (blue line in Figure 3). The total IR flux by the dust emission is and the total IR luminosity is . Silicate dust grains are favored over carbon grains because the observation shows excess at the S11 band, which can be attributed to the Si-O stretching mode of silicate dust at 10 m (Draine & Lee, 1984; Draine, 2003a). As shown in the red line in Figure 3, amorphous carbon dust grains are not able to explain the excess. Forsterite fits the observations quite well, but gives a band feature at 10 m slightly narrower than astronomical silicate. Hereafter, we simply call the dust species found in SN 1978K “silicate dust”.
4.2. Origin of the IR emission
SN 1978K is associated with of silicate dust. The derived temperature is relatively high (230 K). In this subsection, we discuss possible origins of the IR emission. Since SN 1978K is a CSM-rich SN, we first consider CS dust. CS dust can radiate IR emission by light echo (Section 4.2.1). Then, the echoing CS dust is located at the distance larger than cm, where the SN forward shock cannot reach. On the other hand, the CS dust swept up by the SN forward shock can be heated via the collisions with energetic electrons and emits thermal radiation (Section 4.2.2). Then, the typical location is at cm. Another possibility is the SN dust (Section 4.2.3). We show that, among these possibilities, the shocked CS dust is the most probable origin for the IR emission from SN 1978K.
4.2.1 Light Echo
The first possibility for the IR emission is echo emission of CS dust. The dust can absorb the ultra-violet or optical photons of a SN, and radiate IR emission (Bode & Evans, 1980; Wright, 1980; Dwek, 1983, 1985; Graham & Meikle, 1986). In fact, the presence of CS dust echo has been suggested by early phase observations of SNe (Meikle et al., 2006, 2007; Andrews et al., 2011) and SN 1980K at the transitional phase (Sugerman et al., 2012).
We calculate the luminosity of the light echo by following Dwek (1983). The gas mass-loss rate of the progenitor of SN 1978K is estimated to be about from optical, X-ray and radio observations (Ryder et al., 1993; Chugai et al., 1995; Smith et al., 2007). The duration of mass loss is assumed to be yr. This is a rather extreme assumption since the progenitor loses mass as large as 10 prior to the explosion. We assume that the wind velocity is km s-1, which gives outer radius of CSM about cm. The mass-loss rate is assumed to be constant, and thus, the CSM density has a power-law radial profile .
For the SN luminosity, we use an exponential form . We assume a normal peak luminosity and days (Sahu et al., 2006; Kotak et al., 2009). The other parameters are set as follows; the gas-to-dust mass ratio , the grain radius m, the mean absorption efficiency , and the evaporation temperature of dust K. The SN outburst luminosity will make a dust cavity with a radius of cm.
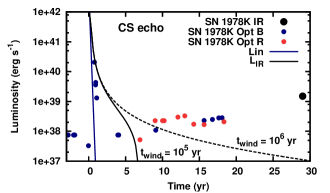
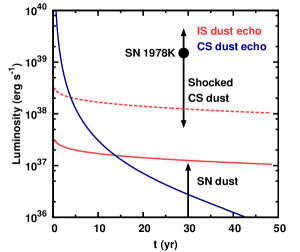
The left panel of Figure 4 shows the computed IR luminosity of the CS dust echo (solid black line). Optical data of SN 1978K are also plotted for comparison under a simple assumption of zero bolometric correction (blue and red points). The IR echo luminosity at yr depends largely on the outer radius () of the CSM since the luminosity from the CS echo declines rapidly at yr (Dwek, 1983). To illustrate this dependence, we also show the model with a longer mass-loss duration (dashed line for yr). With yr, with which the progenitor loses more than 50 , the IR echo does not drop dramatically at 30 yr. But, even with this extreme case, the IR luminosity is only an order of at yr, which is much less than the observed IR luminosity. Thus, we conclude that the CS dust echo of SN outburst is unlikely to be the origin of the IR emission.
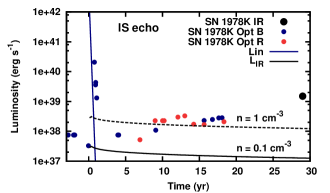
We also calculate the IS dust echo by the same method as that for the CS dust echo. In fact, IR echo by the IS dust has been detected for several extragalactic SNe (Meikle et al., 2007; Kotak et al., 2009; Meikle et al., 2011) and Cas A (Krause et al., 2005; Dwek & Arendt, 2008). The difference from the CS dust is that the density is set to be uniform and that the much larger outer radius is allowed. Here, the distribution of IS dust is approximated to be a sphere with the radius of 100 pc ( yr). The black solid and dashed lines in the right panel of Figure 4 show the luminosity evolution of the IS dust echo for the ISM gas density of and , respectively.
With the normal SN luminosity, the expected IR luminosity at yr is not high enough to explain the observed luminosity of SN 1978K. To explain the observation, the SN had to be very luminous, , or the absolute optical magnitude of about mag. It would imply that the brightness of SN 1978K was of the 8th magnitude. This is in contrast to the suggestion by Ryder et al. (1993) that SN 1978K was subluminous. Although a very large luminosity of SN 1978K is not completely excluded given the sparse observations in 1978, we conclude that IS dust echo is also unlikely.
4.2.2 Shocked CS dust
The second source for the IR emission is the CS dust heated by the forward shock of the SN. The mid-IR emission from the ring in SN 1987A is thought to arise from this mechanism (e.g., Dwek et al., 2008). It is interesting to note that the emission properties of SN 1987A ring and SN 1978K look similar. The dust temperature in the SN 1987A ring is K at 17.9 – 19.7 yr (Bouchet et al., 2006; Dwek et al., 2008; Seok et al., 2008), while that in SN 1978K is 230 K at 29 yr. In addition, the IR to X-ray flux ratio is of the order of unity in both objects (For SN 1978K, , Smith et al. 2007). The similarity seems to support the shock-heated CS dust as an origin of IR emission from SN 1978K.
We estimate the mass of the emitting CS dust swept by the forward shock. CS dust is subject to the destruction by the SN forward shock. The timescale of sputtering is given by
| (4) |
(Dwek & Arendt, 1992), where is the number density of shocked gas. Then, the evolution of the dust radius is estimated as , where . Hereafter, the subscript 0 denotes the value before the dust destruction. The gas mass-loss rate and the CS dust density is related as follows; , where is the mass density of the wind gas. We also define the mass density of dust before the destruction; , where is the number density of dust before the destruction. The CS dust density after the destruction is given by .
Using these relations, the mass of the emitting, shocked CS dust is described as follows;
| (5) |
At the limit of no dust destruction, the integral in the last parentheses becomes , and the shock-heated CS dust is proportional to the mass-loss rate. But is a function of the shocked gas density, and thus, the mass-loss rate. With a larger mass-loss rate, the sputtering timescale becomes shorter, and the integral in the last parentheses becomes smaller than .
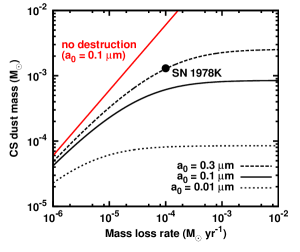
Figure 5 shows the shocked (but surviving) mass of the CS dust at yr as a function of mass-loss rate. The dashed, solid and dotted lines in black show the models with , and m, respectively. The red solid line is the model without dust destruction with m. Other parameters are assumed as follows; km s-1, km s-1, and . The SN shock velocity of SN 1978K is estimated to be km s-1by the VLBI image, which marginally resolve it (Smith et al., 2007). Thus we assume km s-1.
For small mass-loss rates, the destruction is not so effective that the shocked CS dust mass is roughly proportional to the mass-loss rate. For large mass-loss rates, the surviving dust mass is not sensitive to the mass-loss rate. Because of the high gas density, the destruction is effective enough that the mass of dust swept up by the shock compensates for the mass destroyed by the shock 333Fox et al. (2010, 2011) also derived the expression for the shock-heated dust mass, which is independent on the mass-loss rate. Since they assume a destruction-free shell, the mass of CS dust is larger than our calculation by a factor of 4.. In the calculation above, we assume there is no dust-free cavity created by the SN outburst. Since most of surviving dust is located near the SN shock (at cm), which is larger than the cavity size ( cm). Thus, the results presented here are not largely affected by the presence of the dust-free cavity.
From the IR SED of SN 1978K, we estimate the mass of emitting dust to be . The model of the shocked CS dust with and km s-1 is consistent with the observed dust mass if the initial dust radius is m. A similar conclusion has been reached by Dwek et al. (2008) for SN 1987A.
We also check the expected temperature for the shocked CS dust. With , the shocked gas density is about . For the electron temperature about K, the expected dust temperature is and 220 K for the dust radius and 0.3 m, respectively (Dwek et al., 2008). Thus, the expected temperature of the shocked CS dust is also in good agreement with the observations. The surviving, shocked CS dust is distributed in a thin shell, whose inner radius is about 95 % of the radius at the forward shock. Using the mass absorption coefficient of dust for astronomical silicate at 24 m (Draine, 2003b), the optical depth of dust is about , which is consistent with our assumption of optically thin dust (Section 3). In summary, the IR emission from the shocked CS dust can naturally explain the observed IR emission from SN 1978K.
4.2.3 SN dust
The last possibility for the origin of the IR emission is dust formed in SN ejecta. Theoretically, SNe are expected to form dust masses as large as 0.11.0 at the inner layer of the SN ejecta (Kozasa et al., 1989, 1991; Todini & Ferrara, 2001; Nozawa et al., 2003, 2008, 2010; Bianchi & Schneider, 2007; Cherchneff & Dwek, 2010). In fact, such a large amount of dust is required to explain the observed dust mass in high-redshift quasars. if the dust is formed only by SNe (Dwek et al., 2007; Meikle et al., 2007; Gall et al., 2011).
Observationally the mass of dust formed by SNe is quite controversial. IR observations of young SNe ( yr) in external galaxies usually find only of dust (e.g., Wooden et al., 1993; Ercolano et al., 2007; Elmhamdi et al., 2003; Meikle et al., 2007; Kotak et al., 2009; Szalai et al., 2010; Meikle et al., 2011). On the other hand, observations of supernova remnants (SNRs) in our Galaxy and Large/Small Magellanic Clouds detect a larger amount of dust. For example, by intensive observations of Cas A at IR to sub-mm wavelengths, it is estimated that of dust is formed in total (Rho et al., 2008; Sibthorpe et al., 2010; Barlow et al., 2010). Recently, Matsuura et al. (2011) detected a large amount of cold dust in SN 1987A at yr in far-IR and sub-mm wavelengths. The estimated dust mass is as large as , and the dust temperature is K.
To estimate the IR emission from SN dust, we first consider the total luminosity available, which gives an upper limit of the IR luminosity. At the transitional phase, one of the major heating sources of SN dust formed at the inner layers of the ejecta is the radioactive decay of 44Ti, which gives (Fransson & Kozma, 2002). This is much smaller than the IR luminosity () of SN 1978K.
A possible additional heating source is UV or X-ray emission from the ejecta-CSM interacting region. X-ray luminosity of SN 1978K is very high ( (Smith et al., 2007), being enough to account for the observed IR luminosity. However, the X-ray emission from the shocked region is absorbed by the optically-thick ejecta via photo-absorption even at the transitional phase (Fransson & Chevalier, 1987), and it cannot reach the inner layer and cannot heat the SN dust there effectively. Therefore, SN dust at the inner layers of the ejecta is quite unlikely to be the origin of the IR emission from SN 1978K.
Note that dust formation in a cool dense shell has been proposed for some interacting SNe (e.g., Pozzo et al., 2004; Smith et al., 2008; Mattila et al., 2008; Fox et al., 2009; Smith et al., 2009; Chugai, 2009). The cool dense shell may be formed at the reverse-shocked region, and thus, the dust can be heated by the UV/X-ray radiation. Although it is not clear whether of the dust can be formed in the cool dense shell, this scenario cannot be completely excluded as a possible origin for the IR emission from SN 1978K.
5. IR Emission from Normal SNe
From the upper limits of the flux for 5 non-detected SNe, upper limits of the emitting dust mass can be obtained. In this section, we first summarize expected IR emission from normal SNe at the transitional phase. Then, we discuss the implication of the non-detection by current observations.
 |
 |
 |
5.1. Summary of IR Emission at the Transitional Phase
For CSM-rich SN 1978K, we have discussed IR emission expected by (1) light echo from CS and IS dust, (2) shocked CS dust, and (3) SN dust. In this section, we summarize the IR emissions from normal SNe by these processes, presenting the expected IR luminosity and typical dust temperature.
We have shown the light curve of the light echo by CS dust for in Figure 4. Using the same method, we calculate the echo luminosity with a normal mass-loss rate , and a normal SN luminosity . The solid blue line in Figure 6 shows the IR luminosity with the wind duration yr. The echo luminosity is about at yr.
Figure 6 also shows the luminosity by IS dust echo as calculated in Section 4.2.1. The light curve of the IS dust echo has a long timescale, and will exceed that of the CS dust echo after yr for the ISM density of –1.0 cm-3. Note that a typical interstellar density is not well constrained. Gaustad & van Buren (1993) derived a filling factor of interstellar gas with density to be only about 15 %. Dring et al. (1996) derived an even smaller filling factor: 8.5 % for the gas density . When the density is lower than 0.1 , the IR luminosity by the echo is roughly proportional to the gas density since the IS dust is optically thin.
For both CS and IS dust cases, the typical temperature of IR emission can be roughly estimated at the closest point from the SN, i.e., at cm, which has the largest contribution to the total luminosity. Suppose that a dust grain is irradiated by a SN with the luminosity at a distance . For simplicity, the spectrum of the luminous source is assumed to be blackbody with a temperature . Then, the absorbed luminosity is given by , where is the Planck mean of the absorption efficiency factor. When the dust particle emits radiation with a temperature , the emitted luminosity is Under the equilibrium, i.e., , we can derive the temperature as follows;
| (6) | |||||
Here we used , which is derived for K by Dwek (1987). We find that this formula is applicable up to K for our purpose. The expected temperature for the light echo is K at 30 yr.
Next we consider the shocked CS dust. Figure 5 shows that the typical mass of the surviving, shock-heated dust is about at yr for and km s-1. With this mass-loss rate, the shocked gas density is about . For the electron temperature about K, the expected dust temperature is K for the grain radius of m (Dwek et al., 2008). The total IR luminosity can be derived by integrating Equation (1) over wavelength;
| (7) | |||||
where, as in Equation (6), we adopt . Using this equation, the total luminosity of the shocked CS dust is estimated as . For a higher mass-loss rate , the shocked CS dust mass becomes , and the temperature is K. The total IR luminosity becomes .
Finally, let us consider the SN dust. For the SN dust, we assume , which is expected by the radioactive decay of 44Ti. If the mass of SN dust is , the temperature can be 50 K. Even if only of dust is formed, the temperature is about 100 K, which is lower than the expected temperatures for the light echo and the shocked CS dust.
In summary, IR emission of normal SNe at the transitional phase can result from three types of mechanisms, i.e., IS dust echo, shocked CS dust, and SN dust. IS dust echo and shocked CS dust have a relatively high temperature ( K) while the SN dust has a lower temperature ( K). The total luminosity of the IS echo can be for the IS density of cm-3 (Figure 6). The shocked CS dust could also have for – (see the arrow in Figure 6). The luminosity of the SN dust must be .
| SN | Age | ||
|---|---|---|---|
| (yr) | =100 K | =200 K | |
| Amorphous carbon | |||
| SN 1909A | 99 | ||
| SN 1917A | 90 | ||
| SN 1951H | 56 | ||
| SN 1962M | 44 | ||
| SN 1968D | 39 | ||
| Astronomical silicate | |||
| SN 1909A | 99 | ||
| SN 1917A | 90 | ||
| SN 1951H | 56 | ||
| SN 1962M | 44 | ||
| SN 1968D | 39 | ||
5.2. Constraints from Non Detections
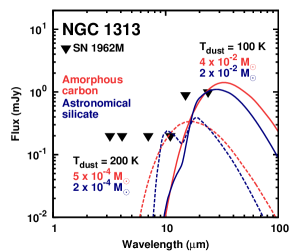
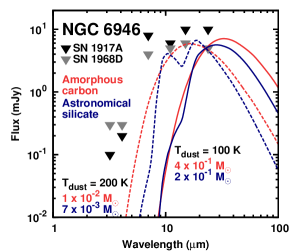
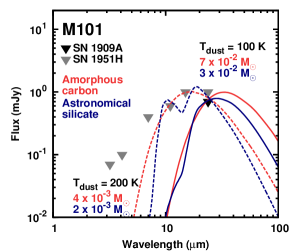
Figure 7 shows SEDs of 5 SNe in the 3 different host galaxies. These upper limits are compared with the model spectra of amorphous carbon (red) and astronomical silicate (blue) with = 100 and 200 K (solid and dashed lines, respectively). The assumed dust mass is shown in the panels. In Table 5, we show the upper limit of the dust mass for the case of amorphous carbon and astronomical silicate for the temperature 100 and 200 K.
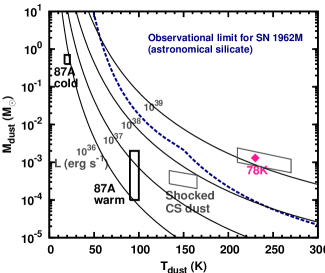
The upper limit of the dust mass strongly depends on the dust temperature. The dashed lines in Figure 8 show the upper limits of the dust mass for SN 1962M as a function of the dust temperature for the case of astronomical silicate (blue and green dashed lines). Constraints on the other 4 SNe are weaker than those for SN 1962M by a factor of 2–20. For comparison, Figure 8 also shows the estimated dust mass and temperature of SN 1978K (this paper) and both warm and cold component of SN 1987A (Bouchet et al., 2004; Matsuura et al., 2011).
The solid lines in Figure 8 show the dust mass as a function of dust temperature for , , , and (from bottom to top). This can be analytically derived from Equation (7);
| (8) | |||||
For these lines in Figure 8, we do not use the analytic formulae, but numerically integrate Equation (1) over wavelength.
As shown in Figure 8, our current observations are sensitive only to the IR luminosity as high as . This limiting luminosity is much higher than the predictions for the SN dust. The luminosity of the IS dust echo can be with . Our current observations can only exclude a homogeneous IS density of .
For the shocked CS dust, the expected ranges of the dust mass and temperature are shown by two gray boxes in Figure 8. The left lower box shows the range for , while the right top for , Our current best observational limit excludes the existence of the shocked CS dust with .
6. Future Prospects
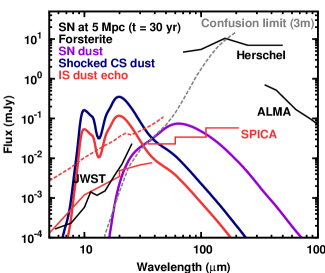
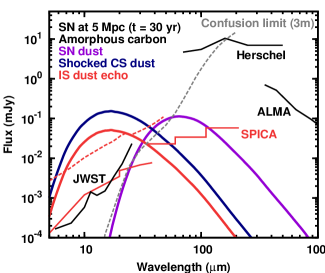
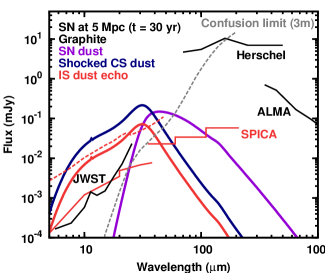
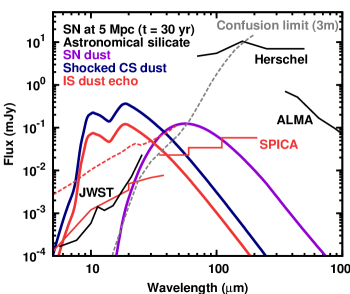
We show that our current observations are sensitive to the luminosity . In this section, we discuss prospects for future observations. Figure 9 shows the expected flux for the SN dust (purple, and K), the shock-heated CS dust (blue, , and K, expected for ), and the IS dust echo (red, and K, the effective emitting dust mass is ). The SN is assumed to be located at 5 Mpc.
The model spectra are compared with 5 detection limit of 1 hr imaging observations with various telescopes, i.e., with The James Webb Space Telescope (JWST, black, Wright et al. 2004; Swinyard et al. 2004), SPICA (red, Nakagawa 2010; Wada & Kataza 2010; Swinyard 2008; Kataza et al. 2010), Herschel (black, Pilbratt et al. 2010; Poglitsch et al. 2010; Griffin et al. 2010), and ALMA (black, Wootten & Thompson 2009). For SPICA, we also show the limit for spectroscopic observations () in the red dashed line (Kataza et al., 2010). In Appendix A we show similar plots for other dust species.
The figure shows that future observations at m are sensitive to the shocked CS dust or IS dust echo. These two cases may show similar overall spectra, but ionic emission lines are also expected for the shocked CS dust. Low resolution spectroscopy will be possible with SPICA, which will be useful to distinguish the shocked CS dust emission from IS dust echo.
IR emission by SN dust has a smaller contribution to the IR luminosity. However, thanks to the lower temperature than the shocked CS dust and IS dust echo, the expected spectrum has a peak at longer wavelengths. The contamination by the shocked CS dust may be small if . In addition, the emission from the IS dust echo can also be small if a typical interstellar density is less than (Gaustad & van Buren, 1993; Dring et al., 1996). If the contributions from these two components are small, the detection of SN dust is limited only by the confusion limit of background galaxies, which is an order of 0.1 mJy at 50 m with a 3m telescope.
The great advantage to detect the SN dust at the transitional phase is the low optical depth. If a SN forms 0.1 of dust, the optical depth becomes
| (9) | |||||
For the mass absorption coefficient of dust , we take the value for astronomical silicate at 24 m (Draine, 2003b). At longer wavelengths, the coefficient is lower (). At early epochs, such a large mass of dust is optically thick even at IR wavelengths. On the contrary, at the transitional phase, the optical depth can be smaller than unity, which enables a reliable estimate of the total dust mass.
Another advantage is the small confusion with the IS dust swept up by the SN ejecta. The mass of the IS dust () can be approximately written as follows by neglecting the destruction;
| (10) | |||||
The mass of swept-up IS dust is nearly in SNRs at yr, which makes it difficult to estimate the SN dust mass in SNRs. On the contrary, the swept-up IS dust mass at the transitional phase is only an order of .
In summary, future observations of SNe at the transitional phase will the gap of infrared observations of SNe with the age of years. At m, observations will provide an interesting way to study the circumstellar and interstellar environments of the progenitor. With SPICA, these components can also be studied by low resolution spectroscopy. If these two components are relatively weak, the SN dust might be detected at longer wavelengths, which enables the reliable measurement of the dust mass.
7. Conclusions
SN explosion have been studied mostly by observations of extragalactic SNe at the early phase ( a few years) or observations of SNRs at the late phase ( yr). Observations at the transitional phase from SN to SNR have not been extensively performed, especially at IR wavelengths. We present theoretical predictions for the IR emission from SNe at the transitional phase. We show that the emission arises from SN dust, light echo by CS and IS dust, and shocked CS dust.
We search for IR emission toward 6 core-collapse SNe at the transitional phase in the nearby galaxies NGC 1313, NGC 6946, and M101 by using the data taken with the AKARI satellite and Spitzer. Among the targets, we detect emission associated with SN 1978K in NGC 1313. The emission is explained by of silicate dust. The shocked circumstellar dust for gas mass-loss rate is the most probable origin of the IR emission from SN 1978K. Dust formed in the outer, cool dense shell might also be a possible origin.
IR emission from the other 5 objects is not detected. Current observations are sensitive only to the total luminosity of . The non-detection of SN 1962M excludes the existence of the shocked CS dust for the high gas mass-loss rate .
Future observations will fill the gap of the IR observations at the transitional phase. At m, the emission is dominated by the shocked CS dust and IS dust echo. The observations will provide an interesting opportunity to study the circumstellar and interstellar environments of the SN progenitor. SN dust component has a smaller contribution, but has a spectrum peaking at longer wavelengths. If the emission by the shocked CS dust and IS dust echo does not dominate the IR emission, the SN dust might be detected at m. This will give a reliable estimate of the SN dust mass, which does not suffer from the high optical depth of dust and the confusion with the interstellar dust.
References
- Andrews et al. (2011) Andrews, J. E., et al. 2011, AJ, 142, 45
- Arimatsu et al. (2011) Arimatsu, K., et al. 2011, PASP, 123, 981
- Artyukhina et al. (1996) Artyukhina, N. M., et al. 1996, VizieR Online Data Catalog, 2205, 0
- Baars et al. (1977) Baars, J. W. M., Genzel, R., Pauliny-Toth, I. I. K., & Witzel, A. 1977, A&A, 61, 99
- Barbon et al. (1999) Barbon, R., Buondí, V., Cappellaro, E., & Turatto, M. 1999, A&AS, 139, 531
- Barlow et al. (2010) Barlow, M. J., et al. 2010, A&A, 518, L138
- Bianchi & Schneider (2007) Bianchi, S., & Schneider, R. 2007, MNRAS, 378, 973
- Bode & Evans (1980) Bode, M. F., & Evans, A. 1980, MNRAS, 193, 21P
- Bouchet et al. (2004) Bouchet, P., De Buizer, J. M., Suntzeff, N. B., Danziger, I. J., Hayward, T. L., Telesco, C. M., & Packham, C. 2004, ApJ, 611, 394
- Bouchet et al. (2006) Bouchet, P., et al. 2006, ApJ, 650, 212
- Cherchneff & Dwek (2010) Cherchneff, I., & Dwek, E. 2010, ApJ, 713, 1
- Chevalier (1982) Chevalier, R. A. 1982, ApJ, 259, 302
- Chevalier & Fransson (1994) Chevalier, R. A., & Fransson, C. 1994, ApJ, 420, 268
- Chu et al. (1999) Chu, Y.-H., Caulet, A., Montes, M. J., Panagia, N., van Dyk, S. D., & Weiler, K. W. 1999, ApJ, 512, L51
- Chugai (2009) Chugai, N. N. 2009, MNRAS, 400, 866
- Chugai et al. (1995) Chugai, N. N., Danziger, I. J., & della Valle, M. 1995, MNRAS, 276, 530
- Dale et al. (2009) Dale, D. A., et al. 2009, ApJ, 703, 517
- Dopita & Ryder (1990) Dopita, M. A., & Ryder, S. D. 1990, IAU Circ., 4950, 3
- Draine (2003a) Draine, B. T. 2003a, ARA&A, 41, 241
- Draine (2003b) —. 2003b, ApJ, 598, 1026
- Draine & Lee (1984) Draine, B. T., & Lee, H. M. 1984, ApJ, 285, 89
- Dring et al. (1996) Dring, A. R., Murthy, J., Henry, R. C., & Walker, H. J. 1996, ApJ, 457, 764
- Dwek (1983) Dwek, E. 1983, ApJ, 274, 175
- Dwek (1985) —. 1985, ApJ, 297, 719
- Dwek (1987) —. 1987, ApJ, 322, 812
- Dwek (2004) —. 2004, ApJ, 607, 848
- Dwek & Arendt (1992) Dwek, E., & Arendt, R. G. 1992, ARA&A, 30, 11
- Dwek & Arendt (2008) —. 2008, ApJ, 685, 976
- Dwek et al. (2008) Dwek, E., et al. 2008, ApJ, 676, 1029
- Dwek et al. (2007) Dwek, E., Galliano, F., & Jones, A. P. 2007, ApJ, 662, 927
- Edoh (1983) Edoh, O. 1983, PhD thesis, THE UNIVERSITY OF ARIZONA.
- Elmhamdi et al. (2003) Elmhamdi, A., et al. 2003, MNRAS, 338, 939
- Ercolano et al. (2007) Ercolano, B., Barlow, M. J., & Sugerman, B. E. K. 2007, MNRAS, 375, 753
- Fesen (1993) Fesen, R. A. 1993, ApJ, 413, L109
- Fox et al. (2009) Fox, O., et al. 2009, ApJ, 691, 650
- Fox et al. (2010) Fox, O. D., Chevalier, R. A., Dwek, E., Skrutskie, M. F., Sugerman, B. E. K., & Leisenring, J. M. 2010, ApJ, 725, 1768
- Fox et al. (2011) Fox, O. D., et al. 2011, ApJ, 741, 7
- Fransson & Chevalier (1987) Fransson, C., & Chevalier, R. A. 1987, ApJ, 322, L15
- Fransson & Kozma (2002) Fransson, C., & Kozma, C. 2002, New A Rev., 46, 487
- Freedman et al. (2001) Freedman, W. L., et al. 2001, ApJ, 553, 47
- Gall et al. (2011) Gall, C., Hjorth, J., & Andersen, A. C. 2011, A&A Rev., 19, 43
- Gaustad & van Buren (1993) Gaustad, J. E., & van Buren, D. 1993, PASP, 105, 1127
- Gordon et al. (2008) Gordon, K. D., Engelbracht, C. W., Rieke, G. H., Misselt, K. A., Smith, J., & Kennicutt, Jr., R. C. 2008, ApJ, 682, 336
- Graham & Meikle (1986) Graham, J. R., & Meikle, W. P. S. 1986, MNRAS, 221, 789
- Griffin et al. (2010) Griffin, M. J., et al. 2010, A&A, 518, L3
- Hines et al. (2004) Hines, D. C., et al. 2004, ApJS, 154, 290
- Immler et al. (2005) Immler, S., et al. 2005, ApJ, 632, 283
- Immler & Kuntz (2005) Immler, S., & Kuntz, K. D. 2005, ApJ, 632, L99
- Kaneda et al. (2007) Kaneda, H., Kim, W., Onaka, T., Wada, T., Ita, Y., Sakon, I., & Takagi, T. 2007, PASJ, 59, 423
- Kaneda et al. (2009) Kaneda, H., Koo, B. C., Onaka, T., & Takahashi, H. 2009, Advances in Space Research, 44, 1038
- Kataza et al. (2010) Kataza, H., Wada, T., Ikeda, Y., Fujishiro, N., Kobayashi, N., & Sakon, I. 2010, in Society of Photo-Optical Instrumentation Engineers (SPIE) Conference Series, Vol. 7731, Society of Photo-Optical Instrumentation Engineers (SPIE) Conference Series
- Kotak et al. (2009) Kotak, R., et al. 2009, ApJ, 704, 306
- Kozasa et al. (1989) Kozasa, T., Hasegawa, H., & Nomoto, K. 1989, ApJ, 344, 325
- Kozasa et al. (1991) —. 1991, A&A, 249, 474
- Krause et al. (2005) Krause, O., et al. 2005, Science, 308, 1604
- Larsson et al. (2011) Larsson, J., et al. 2011, Nature, 474, 484
- Lenz & Schlegel (2007) Lenz, E., & Schlegel, E. M. 2007, AJ, 134, 1821
- Liszt & Lucas (1999) Liszt, H., & Lucas, R. 1999, A&A, 347, 258
- Lorente et al. (2007) Lorente, R., Onaka, T., Ita, Y., Ohyama, Y., Tanabé, T., & Pearson, P. 2007, AKARI IRC Data Users Manual ver.1.4
- Matsuura et al. (2011) Matsuura, M., et al. 2011, Science, 333, 1258
- Mattila et al. (2008) Mattila, S., et al. 2008, MNRAS, 389, 141
- McCray (2007) McCray, R. 2007, in American Institute of Physics Conference Series, Vol. 937, Supernova 1987A: 20 Years After: Supernovae and Gamma-Ray Bursters, ed. S. Immler, K. Weiler, & R. McCray, 3–14
- Meikle et al. (2011) Meikle, W. P. S., et al. 2011, ApJ, 732, 109
- Meikle et al. (2006) —. 2006, ApJ, 649, 332
- Meikle et al. (2007) —. 2007, ApJ, 665, 608
- Méndez et al. (2002) Méndez, B., Davis, M., Moustakas, J., Newman, J., Madore, B. F., & Freedman, W. L. 2002, AJ, 124, 213
- Mezger et al. (1986) Mezger, P. G., Tuffs, R. J., Chini, R., Kreysa, E., & Gemuend, H. 1986, A&A, 167, 145
- Montes et al. (1997) Montes, M. J., Weiler, K. W., & Panagia, N. 1997, ApJ, 488, 792
- Murakami et al. (2007) Murakami, H., et al. 2007, PASJ, 59, 369
- Nakagawa (2010) Nakagawa, T. 2010, in Society of Photo-Optical Instrumentation Engineers (SPIE) Conference Series, Vol. 7731, Society of Photo-Optical Instrumentation Engineers (SPIE) Conference Series
- Nozawa et al. (2007) Nozawa, T., Kozasa, T., Habe, A., Dwek, E., Umeda, H., Tominaga, N., Maeda, K., & Nomoto, K. 2007, ApJ, 666, 955
- Nozawa et al. (2010) Nozawa, T., Kozasa, T., Tominaga, N., Maeda, K., Umeda, H., Nomoto, K., & Krause, O. 2010, ApJ, 713, 356
- Nozawa et al. (2008) Nozawa, T., et al. 2008, ApJ, 684, 1343
- Nozawa et al. (2003) Nozawa, T., Kozasa, T., Umeda, H., Maeda, K., & Nomoto, K. 2003, ApJ, 598, 785
- Onaka et al. (2007) Onaka, T., et al. 2007, PASJ, 59, 401
- Petre et al. (1994) Petre, R., Okada, K., Mihara, T., Makishima, K., & Colbert, E. J. M. 1994, PASJ, 46, L115
- Pierce (1994) Pierce, M. J. 1994, ApJ, 430, 53
- Pilbratt et al. (2010) Pilbratt, G. L., et al. 2010, A&A, 518, L1
- Poglitsch et al. (2010) Poglitsch, A., et al. 2010, A&A, 518, L2
- Pozzo et al. (2004) Pozzo, M., Meikle, W. P. S., Fassia, A., Geballe, T., Lundqvist, P., Chugai, N. N., & Sollerman, J. 2004, MNRAS, 352, 457
- Rho et al. (2008) Rho, J., et al. 2008, ApJ, 673, 271
- Rho et al. (2003) Rho, J., Reynolds, S. P., Reach, W. T., Jarrett, T. H., Allen, G. E., & Wilson, J. C. 2003, ApJ, 592, 299
- Rieke et al. (2004) Rieke, G. H., et al. 2004, ApJS, 154, 25
- Ryder et al. (1993) Ryder, S., Staveley-Smith, L., Dopita, M., Petre, R., Colbert, E., Malin, D., & Schlegel, E. 1993, ApJ, 416, 167
- Sahu et al. (2006) Sahu, D. K., Anupama, G. C., Srividya, S., & Muneer, S. 2006, MNRAS, 372, 1315
- Sakon et al. (2007) Sakon, I., et al. 2007, PASJ, 59, 483
- Schlegel et al. (2004) Schlegel, E. M., Kong, A., Kaaret, P., DiStefano, R., & Murray, S. 2004, ApJ, 603, 644
- Schlegel & Petre (2006) Schlegel, E. M., & Petre, R. 2006, ApJ, 646, 378
- Schlegel et al. (1996) Schlegel, E. M., Petre, R., & Colbert, E. J. M. 1996, ApJ, 456, 187
- Schlegel et al. (2000) Schlegel, E. M., Petre, R., Colbert, E. J. M., & Miller, S. 2000, AJ, 120, 2373
- Schlegel et al. (1999) Schlegel, E. M., Ryder, S., Staveley-Smith, L., Petre, R., Colbert, E., Dopita, M., & Campbell-Wilson, D. 1999, AJ, 118, 2689
- Schmidt et al. (1994) Schmidt, B. P., Kirshner, R. P., Eastman, R. G., Phillips, M. M., Suntzeff, N. B., Hamuy, M., Maza, J., & Aviles, R. 1994, ApJ, 432, 42
- Schoniger & Sofue (1994) Schoniger, F., & Sofue, Y. 1994, A&A, 283, 21
- Semenov et al. (2003) Semenov, D., Henning, T., Helling, C., Ilgner, M., & Sedlmayr, E. 2003, A&A, 410, 611
- Seok et al. (2008) Seok, J. Y., et al. 2008, PASJ, 60, 453
- Sibthorpe et al. (2010) Sibthorpe, B., et al. 2010, ApJ, 719, 1553
- Skrutskie et al. (2006) Skrutskie, M. F., et al. 2006, AJ, 131, 1163
- Smith et al. (2007) Smith, I. A., Ryder, S. D., Böttcher, M., Tingay, S. J., Stacy, A., Pakull, M., & Liang, E. P. 2007, ApJ, 669, 1130
- Smith et al. (2008) Smith, N., Foley, R. J., & Filippenko, A. V. 2008, ApJ, 680, 568
- Smith et al. (2009) Smith, N., et al. 2009, ApJ, 695, 1334
- Soria & Perna (2008) Soria, R., & Perna, R. 2008, ApJ, 683, 767
- Sugerman et al. (2012) Sugerman, B. E. K., et al. 2012, arXiv:1202.3075
- Swinyard (2008) Swinyard, B. 2008, in COSPAR, Plenary Meeting, Vol. 37, 37th COSPAR Scientific Assembly, 3104
- Swinyard et al. (2004) Swinyard, B. M., Rieke, G. H., Ressler, M., Glasse, A., Wright, G. S., Ferlet, M., & Wells, M. 2004, in Presented at the Society of Photo-Optical Instrumentation Engineers (SPIE) Conference, Vol. 5487, Society of Photo-Optical Instrumentation Engineers (SPIE) Conference Series, ed. J. C. Mather, 785–793
- Szalai et al. (2010) Szalai, T., Vinkó, J., Balog, Z., Gáspár, A., Block, M., & Kiss, L. L. 2010, arXiv:1012.2035
- Todini & Ferrara (2001) Todini, P., & Ferrara, A. 2001, MNRAS, 325, 726
- van Dyk et al. (1994) van Dyk, S. D., Hyman, S. D., Sramek, R. A., & Weiler, K. W. 1994, IAU Circ., 6045, 2
- Wada & Kataza (2010) Wada, T., & Kataza, H. 2010, in Society of Photo-Optical Instrumentation Engineers (SPIE) Conference Series, Vol. 7731, Society of Photo-Optical Instrumentation Engineers (SPIE) Conference Series
- Werner et al. (2004) Werner, M. W., et al. 2004, ApJS, 154, 1
- Williams et al. (2002) Williams, C. L., Panagia, N., Van Dyk, S. D., Lacey, C. K., Weiler, K. W., & Sramek, R. A. 2002, ApJ, 581, 396
- Wooden et al. (1993) Wooden, D. H., Rank, D. M., Bregman, J. D., Witteborn, F. C., Tielens, A. G. G. M., Cohen, M., Pinto, P. A., & Axelrod, T. S. 1993, ApJS, 88, 477
- Wootten & Thompson (2009) Wootten, A., & Thompson, A. R. 2009, IEEE Proceedings, 97, 1463
- Wright (1980) Wright, E. L. 1980, ApJ, 242, L23+
- Wright et al. (2004) Wright, G. S., et al. 2004, in Presented at the Society of Photo-Optical Instrumentation Engineers (SPIE) Conference, Vol. 5487, Society of Photo-Optical Instrumentation Engineers (SPIE) Conference Series, ed. J. C. Mather, 653–663
Appendix A SEDs for Amorphous Carbon, Graphite, and Forsterite
As discussed in Section 6, future mid/far-IR observations will be able to detect the shocked CS dust, IS dust echo, and possibly SN dust. Figure 9 only shows the case for astronomical silicate. In Figure 10, we show similar plots, but for forsterite, amorphous carbon, and graphite. For each component, the same temperature and dust mass with those for astronomical silicate are assumed.