When Should I Make Preservation Copies of Myself?
Abstract
We investigate how different preservation policies ranging from least aggressive to Most aggressive affect the level of preservation achieved by autonomic processes used by smart digital objects (DOs). The mechanisms used to support preservation across different hosts can be used for automatic link generation and support preservation activities by moving data preservation from an archive centric perspective to a data centric preservation. Based on simulations of small-world graphs of DOs created using the Unsupervised Small-World algorithm, we report quantitative and qualitative results for graphs ranging in size from 10 to 5,000 DOs. Our results show that a Most aggressive preservation policy makes the best use of distributed host resources while using one half of the number of messages of a Moderately aggressive preservation policy.
category:
H.3.7 Information Storage and Retrieval Systems issues1 Motivation
Much of our current cultural heritage exists only in digital format and digital preservation approaches rely on the long term commitment of individuals, institutions and companies to preserve this heritage. The length of time that an individual will be engaged in preservation activities is, by definition, limited to their lifetime (and probably just the middle part of that life). Even those few years may be longer than institutions and companies would be willing to undertake digital preservation. Institutions and companies may cease to exist or be unwilling or unable to meet their original preservation commitments due to changes in corporate culture or financial considerations. If this happens then the digital files and their information (our heritage) may become irretrievably lost. The acknowledgement that much of our heritage exists only in digital format, and the recognition that there is a real risk of total loss through accident [41] or change in business goals [24] has been recognized in academic reports and papers [23] and is starting to surface in the popular press [37, 40, 34, 16].
Our motivation is to change the focus from preservation services administered by institutions (a repository-centric perspective) to one where the data preserves itself (a data-centric perspective). We continue to investigate this data-centric perspective through the use of the Unsupervised Small-World (USW) graph creation algorithm [5, 4, 7, 6] where we have shown that DOs instrumented with just a few rules can autonomously form into small-world graphs. The focus of this work is to augment the prior work by imbuing DOs with the capability to create a number of copies of themselves for preservation purposes. We are focusing on determining when copies should be created during the USW process and the communication impacts of different preservation policies.
2 Related Work
This work is at the convergence of digital library repositories, emergent behavior, graph theory and web infrastructure. To provide a context for understanding the contributions of this research, we first briefly review the status of how objects are stored in repositories as well as the nature and types of various networks or graphs.
2.1 Repositories
Repositories range from theoretical to ready-to-download. Some such as SAV [9] are frameworks or architectural proposals. Some, like FEDORA [26], are middle-ware systems, ready to be the core repository technology in a local deployment. Some such as aDORe [36] are complete systems, ready to deploy. These include DSpace [35], sponsored by MIT and HP Laboratories and LOCKSS [22], sponsored by the Stanford University Libraries. All are widely implemented and enjoy a large user community. DSpace is an institutional repository, intended to archive the intellectual output of a university’s faculty and students. LOCKSS allows libraries to create “dark archives” of publishers’ websites. As long as the publishers’ websites are available, all web traffic goes to those sites. But if the publishers’ contents are lost, the dark archives are activated and the content is available again. Risk is mitigated through many sites archiving content of their own choosing. Depending on an institution’s requirements, the systems described above can be quite attractive. But there is an implicit assumption on any repository system: that there is a person, community or institution that exists to tend to the repository. What happens when the responsible organization no longer exists? There are repository trading and synchronization provisions (e.g., [10]), but most are specific to a particular repository architecture.
Cooperative File Systems (CFS) [11], Internet Backplane Protocol (IBP) [2], Storage Resource Broker (SRB) [27] and OceanStore [31] are among several generic network storage systems and APIs that have also been proposed. CFS and OceanStore rely on distributed hash tables and an overlay network to locate content in the Internet. Systems with such additional levels of shared infrastructure have not been widely deployed. IBP and SRB are more traditional in their repository design and have enjoyed greater deployment. SRB (and its follow-on, iRODs [28]) has a user community similar in size to LOCKSS and Fedora.
Numerous P2P repositories have also been proposed (for example Intermemory [15], Freenet [8], Free Haven [12], and PAST [33]). Frequently these repositories are characterized by offering long-term storage systems requiring the contribution of X megabytes of storage today for the promise of Y megabytes of persistent storage (X Y). Despite having many theoretically attractive features, these systems have not found widespread acceptance. We use a variant of this idea in our graph construction techniques, by simulating that a host has effectively infinite capacity for those DOs that are created locally and a very limited capacity for those DOs that were created remotely.
Each of the approaches listed above inherently rely on human and institution intervention in the digital preservation activities of refreshing and migration [38, 32]. The digital preservation activities of emulation and metadata attachment are outside the context of this paper. As the amount of digital data continues to grow (at potentially an exponential rate), the organizational and human cost to keep up with traditional approaches will become overwhelming. An alternative approach is to revisit the definition of a DO and to incorporate into that definition the idea that the DO is empowered to make preservation copies of itself for the purposes of preservation and that it can communicate with other DOs. Messages that can be sent include the location of new supporting preservation hosts, data migration services and new DOs.
2.2 Graph Construction
Our approach for the construction of a small-world network of DOs for self preservation is different than others have used or proposed. We make use of the definition of a small-world graph as one that has a high clustering coefficient when compared to a randomly created graph and an average path length that is proportional to the number of nodes in the graph [39]. The Watts-Strogatz approach to constructing such a graph is to take a lattice graph of degree and size and perturb the links to create a graph with small-world characteristics. Some approaches make connections between nodes based on the proportion of the destination node’s degree count [25, 20, 1], a kind of preferential attachment or fitness policy. Yet another type of approach takes an existing graph and then grows a small-world by the addition of new links [13, 19]. Or, by connecting a node to a fixed number of vertices based on their degree [3], or even creating a small-world graph from a random one [14].
The USW process requires that each new node communicate with an existing node in the USW graph. After the first DO selection, the USW algorithm controls where the DO fits into the graph and how many edges are created to other DOs in the system. USW is the only small-world graph creation algorithm that we know of where connections are made between DOs based information that the DO gleans prior to making its first connection.
3 Self-Preserving Digital
Objects
We consider DOs to be in the tradition of Kahn-Wilensky and related implementations [18]. This paper focuses on the analysis of inter- and intra-DO policies for preservation through simulation. In a separate project we are implementing a test bed of DOs as web resources that use OAI-ORE [21] Resource Maps to keep track of the contents of DOs, the location of supporting web services, and the JavaScript necessary to implement the policies presented here. The test bed will feature DOs that utilize a variety of storage layers, such as repository systems (e.g., DSpace, FEDORA), file systems, web storage services (e.g., Amazon S3), wikis, blogs, and email accounts (e.g., Gmail).
3.1 Flocking for Preservation
Craig Reynolds’ seminal paper on “boids” [30], demonstrated that three simple rules were sufficient to simulate the complex behaviors of schools of fish, flocks of birds, herds of animals and the like. The remarkable feature about these rules is that they are scale-free so knowing the entire size of the group, or network is not required. We believe these rules can be adapted to create self-preserving DOs with similarly complex emergent behaviors. The transcription of Reynolds’ rules from a boid to a DO perspective are:
Collision avoidance DOs flocking to a new repository cannot overwrite each other (collide in physical storage), nor collide in namespaces (have the same URI). This is orthogonal to the naming mechanism used: URIs, URN handles, DOIs, globally unique identifiers (GUIDS) or content addressable naming schemes [29].
Velocity matching All members of a herd, or school, or flock move at roughly the same speed. With boids, the idea is to travel the same speed as your neighbors. Interpreting velocity as resource consumption (i.e., storage space) enables this rule to be applied to a DO environment. Specifically, a DO should try to consume as much, and only as much, storage as everyone else. In resource-rich environments (lots of storage space available on lots of hosts), making as many copies of yourself as you would like is easy. When storage becomes scarce, this becomes more difficult. DOs must be able to delete copies of themselves from different repositories to make room for late arriving DOs in low-storage situations. DOs will never delete the last copy of themselves to make room for new DOs, but they will delete copies of themselves to come down from a soft threshold (e.g., 10 copies) down to a hard threshold (e.g., 3). When resources become plentiful again, new copies can be made.
Flock centering For boids this means staying near (but not colliding with) other flock-mates. We interpret this in a manner similar to velocity matching, with DOs attempting to stay near other DOs as they make copies of themselves at new repositories. In essence, when a DO learns of a new repository and makes a copy of itself there, it should tell the other DOs it knows so they will have the opportunity to make copies of themselves at the new location. Announcing the location of a new repository will thus cause DOs at other repositories that have not reached their soft threshold to create copies that “flow” to the new repository.
The benefits of using the boids model are: it is simple to implement and test (cf., iRODs); all decisions are made using locally gleaned information; there are no global controls with the attendant communications overhead costs; and once a DO is created and introduced into the USW network, the DO is responsible for its destiny. Simple rules that are executed based on locally gleaned information result in emergent intelligent and social behaviors.
At the macro level; in much the same way that flocks self-navigate to new locations that have the resources they need, we envision DOs self-preserving in a loose confederation of cooperating repositories each with varying levels of resources and availability. Making copies in new repositories is performed in an opportunistic manner, within the guidelines imbued in the DOs at creation time. From time to time an archivist may steer the entire collection (or parts of it) to new archives, but for the most part the DOs replicate and preserve themselves.
3.2 Unsupervised Small-World Graph Creation
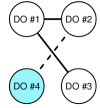
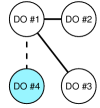
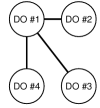
We introduce some terminology to discuss how DOs can self-arrange. Friends are DOs that share an edge. When a DO is created, is introduced to an existing DO in the graph and is called a wandering DO. While wandering, a DO accumulates a list of potential friends from other DOs in the graph. When a wandering DO makes its first friendship link to a DO, the no-longer wandering DO uses the information that it has gleaned about other DOs to create additional friendship links. This process with 4 DOs is shown in Figure 1. Friendship links are separate from HTML navigation links (i.e., <link> instead of <a> HTML elements). A family is the collection of DOs that are replicas of each other. A parent is the family member responsible for meeting the family’s preservation goals.


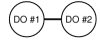
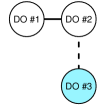
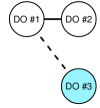
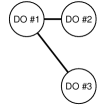
Friendship links serve as a way for DOs to send messages from one to another, such as when new storage locations are available or the scope and migration of file formats (cf. the semi-automated alert system described in Panic [17]). Friendship links are used to support the preservation process and meet the spirit of preservation refreshing.
4 Self-Preservation Policies for Preservation
4.1 Model
We simulate three different replication policies to quantify and qualify their effects on the system as measured in two different areas. The first area being how effective the replication policy is at having as many DOs as possible achieve their desired maximum number of preservation copies. The second being the communication costs associated with each replication policy as the system grows in size.
A DO’s family members will be spread across a collection of hosts. A complete
description of a DO’s position in a family structure and the host
that it is living on is given by the notation DOn,c,h. Where:
If then .
4.2 Policies
We focus on the following preservation policies (assuming that the DO values for and have been defined):
-
1.
Least aggressive — a DO will make only a single preservation copy at a time, regardless of how many copies are needed, or how many opportunities are available and will continue to make single copies until it reaches .
-
2.
Moderately aggressive — a DO will make as many copies as it can to reach when it makes its first connection, then fall back to Least aggressive policy.
-
3.
Most aggressive — a DO will make as many copies as it can to reach when it makes its first connection, then fall back to Least aggressive policy.
The effect of both the Moderately and Most aggressive preservation behaviors is that after reaching their respective goals, they behave like the Least aggressive.
4.3 Evaluation

Figure 2 serves as a legend for the sub-figures in Figures 3 and 4 and shows DO and host preservation status as a function of . Figure 2 is divided into four areas. The left half shows DO related data, while the right half shows host data. DOs are sequentially added to the simulation. In Figure 2, DOs are added in a spiral fashion starting at the center of the “circular” plot, with newer DOs are plotted in a circular manner from the center. This presentation is similar to the rings of a tree, the oldest are in center and the youngest are on the outer edge.
The preservation status of a DO is approximated by the color assigned to the DO. Initially the DO has copies and is colored red. As the DO creates copies, the color changes to yellow. When the DO reaches , the color changes to green. When is reached, the DO turns blue. The rules of the simulation (based on our interpretation of Reynolds’ “boids”) permit the killing of one DO’s preservation copies for the sake of creating room for copy of a DO that needs to reach its (i.e., if a DOi,c,h has more than its and DOj,c,h has not reached its , then DOi,c,h will sacrifice one of its copies so that DOj,c,h can move closer to ). Sacrificing a preservation copy for the betterment of the whole is the embodiment of velocity matching. The effect of this behavior is that a DO can change color from red to yellow to green and then possibly to blue. If the DO changes to blue, it might oscillate between green and blue as its number of preservation copies oscillate between and . A DO will never sacrifice a copy if it has not exceeded its . The histogram under the DO circular plot shows the percentage of DOs in each of the different preservation copy states as a function of .
The preservation utilization status of a host is shown in the right half of Figure 2. The universe of possible hosts is constant and is represented by the entire right half plot. Hosts that are not being used are shown in grey. The placement of the host in the figure is based on the host’s sequential number in the simulation. Those hosts that are used are drawn in one of five colors. If the host is used in the simulation, but is not hosting any preservation copies then it is colored white. If less than 25% of the host’s capacity is used then it is colored red. Similarly, it is yellow if less than 50% is used, green if less than 75% and blue if greater than 75%. The histogram on the host’s side shows the percentage of the hosts that are in any of the particular states.
In the simulation, each host has a finite amount of storage that makes available for DOs that originate from other hosts. This storage is called . The simulation has =500, =3, = 5, , . The simulation runs until it reaches a steady state. A steady state is defined as when the system stops evolving. Evolution stops when DOs are unable to locate candidate hosts on which to store additional preservation copies. Steady state is reached at different times based on the preservation policy. In all cases, all DOs have been introduced into the simulation by .
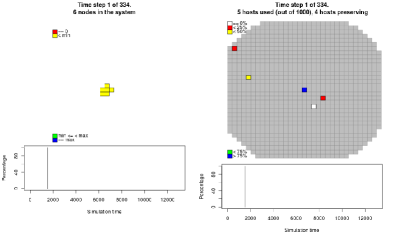
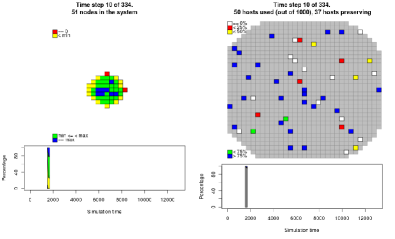
The initial DO is plotted in the center of the left hand upper quadrant of each composite, Figure 3(a) shows the first 5 DOs in the system. The one in the center is the oldest DO, while the others are younger. The five DOs currently in the system live on hosts in the system. Hosts can live anywhere on the network and where a particular host is drawn immaterial. The hosts in Figure 3(a) have a finite capacity that their respective system administrators have allocated to the preservation of copies of “foreign” DOs .
At any point in time during the simulation, there will likely be a difference in the number of preservation copies that the DOs want to create and the preservation capacity of all the hosts. Reynolds’ rules attempt to balance these two requirements over time. Figure 3(a) indicates that the DOs have each made some number of copies (they are colored yellow vice red) and those copies are spread across some of the hosts in a non-even manner. One host has used all its capacity (as shown in blue), while one has not used any (as shown in white). The remaining hosts have used something in between those two extremes (they are yellow and red). In Figure 3(a), the histograms do not show too much information because of the initial internal simulation activity prior to the introduction of the first DO.
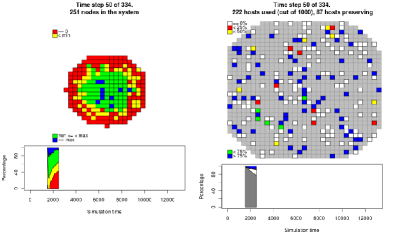
In Figure 3(b), the tree ring growth of the DOs is becoming more apparent. Older DOs have had more opportunities to make preservation copies of themselves, therefore there is more green and blue in the center of the DO plot. Many of the hosts are have reached , as indicated by the number of blue hosts. The histograms are starting to become filled with data. The DO histogram is starting to show that the percentage of the DOs that have made some, but not all their preservation copies (those in yellow) is starting to grow, while the percentage of those that have reached their goals is lessening. The hosts histogram is starting to show that the percentage of the hosts that have been discovered and added to the system (the grey area), is starting to decrease. A DO will be local to exactly one host. A host may have more than one DO local to it. A DO will not put a preservation copy on any host that it lives on, or that already has a preservation copy of itself.
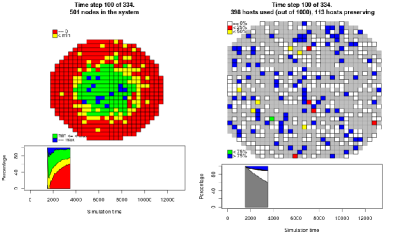
In Figure 3(c), the tree ring presentation of the DO success at preservation is becoming more pronounced. Younger DOs are struggling to make copies, while the old ones are maintaining their copies. More of the hosts are being brought into the system (the percentage of grey hosts is decreasing), but a significant percentage of the hosts are not being used for preservation (those shown in white).
In Figure 3(d), all DOs have been introduced into the system. The tree ring preservation effect is still evident, and some of the new DOs have been fortunate enough to make some number of preservation copies (as shown by the yellow markers in the sea of red). The percentage of hosts that are still not preserving any DOs is still significant, and the percentage of hosts that have reached is holding constant. The system will continue to evolve until it reaches a steady state, when those DOs that have preserved as many copies of themselves as they can based on their knowledge of hosts that have excess preservation capacity. The system steady state for this particular graph is shown in Figure 4(a).
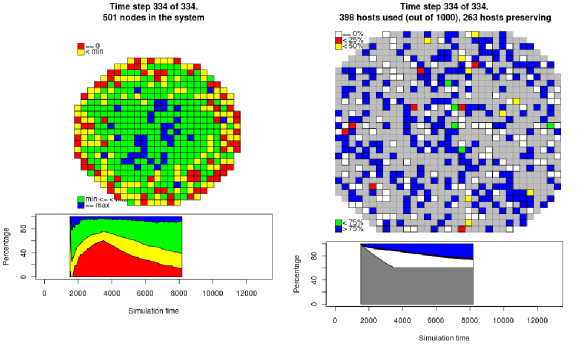
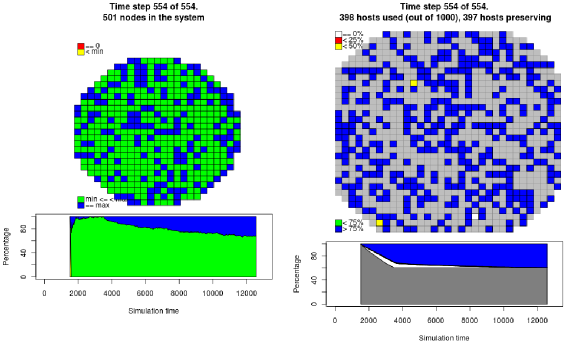
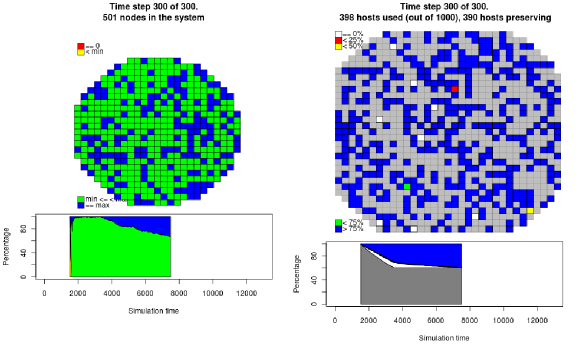
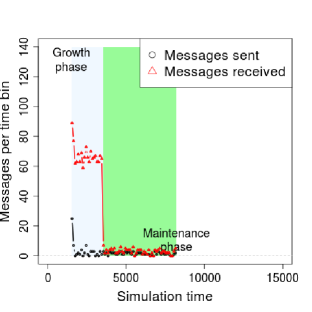
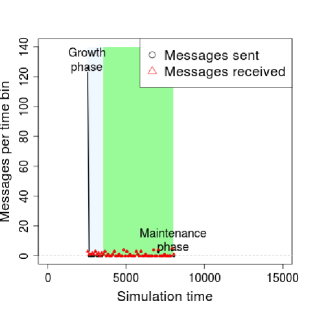
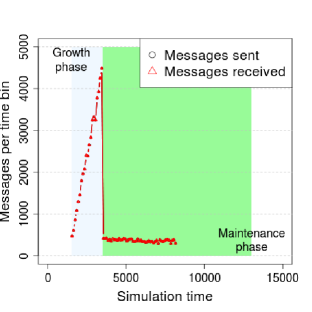
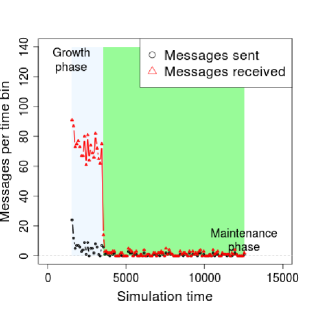
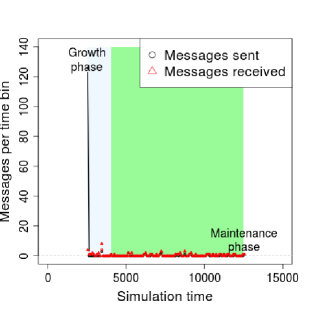
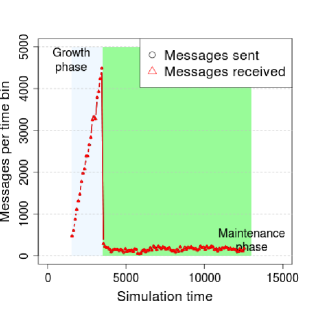
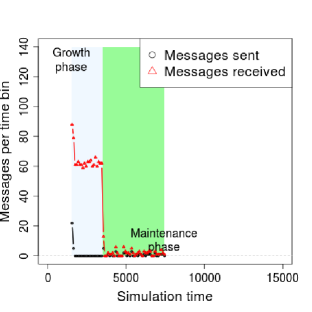
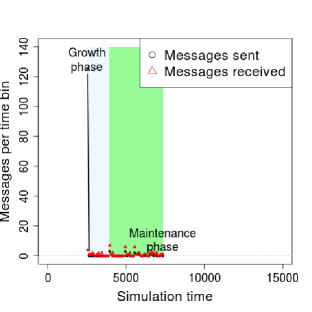
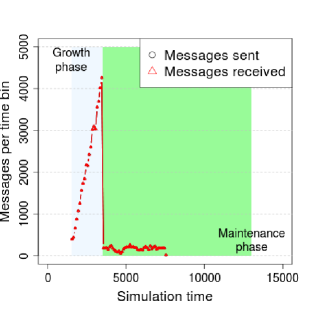
Figure 4 shows the steady state condition of the same system using the three different preservation policies. All DOs have been introduced into the system by (as shown by the “kink” in the percentage of hosts that are used histogram). Each preservation policy resulted in a significantly different time to reach a steady state. The hosts have enough preservation capacity to accommodate the preservation needs of the DOs, a Boundary High condition (see Table 1). If the DO can locate enough unique hosts via its friends, then it will be able to meet its preservation goals. These representative values for number of DOs, desired preservation levels and host preservation capacity were chosen to illustrate the interaction between the DOs as they move preservation copies from one host to another while attempting to maximize the preservation needs of most of the DOs.
The Least aggressive policy reaches steady state at (see Figure 4(a)) and a significant percentage of the DOs have not been able to make any preservation copies (as shown by the lower-most (red) band in the histogram). As shown in the node half of the figure, many of the hosts are not preserving any DOs and those hosts that are preserving have reached their capacity.
The Moderately aggressive policy reaches steady state at (see Figure 4(b)). Prior to , most of the DOs have made most of their preservation copies. After that time, the percentage achieving slowly increases until the system reaches steady state. The hosts’ preservation capacity is used by the DOs in the system almost as quickly as the hosts come on line. This is indicated by the very narrow white region between the unused host region and the totally used region. At steady state, only a very few of the hosts have not been totally used (as shown by the few host usage squares that are neither blue or grey).
The Most aggressive policy reaches steady state after (see Figure 4(c)). Close examination of the host histograms in Figures 4(b) and 4(c) show almost identical behavior both prior to and at steady state. Comparing the host usage plot in the two figures show that slightly more hosts have unused capacity based on a Most aggressive policy than a Moderately aggressive policy (390 versus 397). Based on DOs in the system, the difference between the two policies host under utilization is not significant.
4.4 Communications
From the DO’s perspective, there are two distinct phases of communication. The first is when the DO is wandering through the graph and collecting information from DOs that are already connected into the graph, this called the growth phase. The second is after the DO is connected into the graph and is called the maintenance phase. During the growth phase, the DO is actively communicating with other DOs. While in the maintenance phase, the DO is responding to queries and communications from other DOs. This change in communication patterns occurs at approximately in Figure 5. Figure 5 shows the communications for 2 different DOs and the system in total as a function of the preservation policy. DO1,c,h and DO250,c,h were chosen to represent the messaging profiles of all DOs to see if the profile changes as a function of when a DO enters the system. Time in Figure 5 runs until and messages are counted in time bins sized to 100 simulation events.
Looking at figures 5(a), 5(b), 5(d), 5(e), 5(g) and 5(h), there is a marked difference in the communication curves between DO1,c,h and DO250,c,h. These curves (with only minor differences) are consistent across all preservation policies. DO1,c,h (the earliest DO introduced into the system), sends a rather modest number of messages to DOs that are also in the system as DO1,c,h attempts to create preservation copies. Under the least aggressive policy (see Figure 5(a)), DO1,c,h sends a few messages per time bin until the system enters the maintenance phase. The number of messages sent during the moderately aggressive policy is nominally the same (see Figure 5(d)). While the Most aggressive policy results in messages for just a couple of time bins and then virtually no messages are sent (see Figure 5(g)). Regardless of the preservation policy, the number of messages that DO1,c,h receives is about the same.
Comparing the message curves for DO1,c,h and DO250,c,h indicates that the system discovered by the later DO is very different than the one discovered by the earliest DO. The late arriving node has more than enough opportunities to satisfy its preservation goals when first introduced into the system. DO250,c,h sends all of its messages in one time bin and virtually nothing thereafter. This behavior is constant across all preservation policies and indicates that the late arriving DOs are able to connect with another DO in very short order and almost immediately enter into the maintenance phase of their existence. The maintenance phase of the system corresponds to a combination of the velocity matching and flocking centering.
The system is in a growth phase from about to as shown by the rising curves in the “Sum of all DOs” sub-figures 5(c), 5(f) and 5(i). During the growth phase, the wandering node is sending and receiving a lot of messages while attempting to make its initial connection into the graph. After , the system is in a maintenance phase when the system is attempting to balance the preservation needs of the DOs with the capacity of the hosts. Comparing the messages curves for the entire system Figures 5(c), 5(f) and 5(i) shows that there is no qualitative difference between the number of messages sent and received in the system based on preservation policy. The nuances of the message curves for early DOs is lost as the size of the system increases.
4.5 Messages Sent and Received as the System Grows in Size
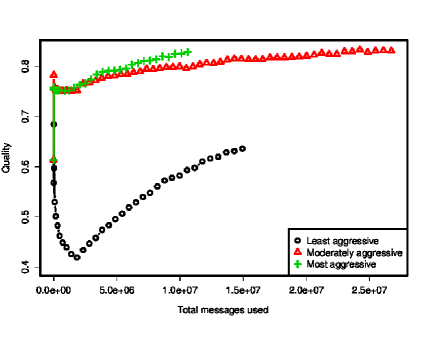
Figures 4 and 5 show the efficacy and communication costs associated with a system with and . These values allowed the simulation to execute quickly, thereby enabling more options and combinations to be investigated. After determining that at least a moderately aggressive preservation policy enabled a high percentage of DOs to meet at least their goals, the next area of investigation was to determine how the total number of messages changes as a function of system size. Figure 5 clearly shows that there different types of communication during the growth and maintenance phases. During the maintenance phase, the DOs are attempting to spread their preservation copies out across all the unique hosts in their friend’s network. A cost function was developed to quantitatively investigate the performance of the various preservation policies focusing on the number of messages sent and received. Each preservation status (see Figure 2) was assigned a value from 1 to 4 corresponding to the range 0 to and scaled 0 to 1. At each the cost performance of the system was evaluated and the number messages sent and received up to that point was summed. The results are shown in Figure 6. The Most aggressive and moderately aggressive policies achieve approximately the same level of effectiveness, but the Most aggressive achieves that level twice as fast as the moderately aggressive and only sending half as many messages.
The current simulation is a Boundary High condition (see Table 1). One of the contributing factors to spreading preservation copies across many hosts is the limited capacity of the hosts to support preservation. In order to remove the effects of maintenance communications and focus purely on the effect of the number of DOs in the system, a series of simulations were run using a Feast condition environment (see Table 1) where . This ensured that there would be room on the host for any DO that discovered the host via one of their friends. Based on the simulations, the total number of messages exchanged during the growth phase approximates and the incremental messaging cost of each new DO to the system is .
5 Conclusion
We have shown that implementing Reynolds’ “boid” model with a limited number of rules in an autonomic system can result in digital objects (DOs) behaving in a manner that works towards the betterment of the whole by occasionally sacrificing an individual. Using simulations, we investigated different policies that DOs could use when make preservation copies of themselves. Based on simulations of 500 DOs and hosts with limited preservation capacity; the Most aggressive preservation policy enabled the DOs to attain the same preservation percentage in half the time as a Moderately aggressive policy while exchanging only half as many messages. An aggressive policy will try to make up to copies as it can at its first opportunity and then single copies thereafter. A Moderately aggressive preservation policy will try to make up to copies at its first opportunity and then single copies thereafter until it reaches . The least aggressive preservation policy attempts to make 1 preservation copy per opportunity until it reaches .
There are two distinct communication message profiles; one prior to all the DOs being introduced into the system and one after. The system’s growth period is characterized by many messages being sent from the wandering DO and few being received while the DO attempts to make its appropriate number of preservation copies. The maintenance period is characterized by a relatively few number of messages as the DO is directed to sacrifice preservation copies for the greater good of the graph, and subsequently having to create copies anew. There are distinct differences between the growth message profiles of new and late arriving DOs, based on the preservation policy.
| Named host capacity | Preservation policy | ||
|---|---|---|---|
| (condition) | Least aggressive | Moderately aggressive | Most aggressive |
| Famine () | Lowest percentage of DOs achieving preservation goal. | Equally marginally effective. | |
| Boundary Low () | |||
| Straddle () | The baseline against which others are measured. | This preservation policy is twice as efficient as the Moderately aggressive policy for these named conditions. | |
| Boundary High () | |||
| Feast () | |||
6 Acknowledgment
This work supported in part by the NSF, Project 370161.
References
- [1] A.-L. Barabási, R. Albert, and H. Jeong. Scale-Free Characteristics of Random Networks: The Topology of the World Wide Web. Physica A, 281(1):69 – 77, June 2000.
- [2] M. Beck, T. Moore, and J. S. Plank. An End-to-End Approach to Globally Scalable Network Storage. In SIGCOMM ’02, pages 339 – 346, 2002.
- [3] B. Bollobás, O. Riordan, J. Spencer, and G. Tusnády. The Degree Sequence of a Scale-Free Random Graph Process. Random Structures and Algorithms, 18(3):279 – 290, 2001.
- [4] C. L. Cartledge and M. L. Nelson. Self-Arranging Preservation Networks. In Proceedings of the 8th ACM/IEEE-CS Joint Conference on Digital Libraries, pages 445 – 445, 2008.
- [5] C. L. Cartledge and M. L. Nelson. Unsupervised Creation of Small World Networks for the Preservation of Digital Objects. In Proceedings of the 9th ACM/IEEE-CS Joint Conference on Digital Libraries, pages 349 – 352, 2009.
- [6] C. L. Cartledge and M. L. Nelson. Analysis of Graphs for Digital Preservation Suitability. In Proceedings of the 21st ACM conference on Hypertext and hypermedia, pages 109 – 118. ACM, 2010.
- [7] C. L. Cartledge and M. L. Nelson. Connectivity Damage to a Graph by the Removal of an Edge or Vertex. Technical report, Arxiv 1103.3075, Old Dominion University, Computer Science Department, Norfolk, VA, 2011.
- [8] I. Clarke, O. Sandberg, B. Wiley, and T. W. Hong. Freenet: A Distributed Anonymous Information Storage and Retrieval System. In International Workshop on Designing Privacy Enhancing Technologies, pages 46 – 66, 2001.
- [9] B. Cooper, A. Crespo, and H. Garcia-Molina. Implementing a Reliable Digital Object Archive. In ECDL ’00, pages 128 – 143, 2000.
- [10] B. F. Cooper and H. Garcia-Molina. Peer-to-Peer Data Trading to Preserve Information. ACM Transactions on Information Systems (TOIS), 20(2):133 – 170, 2002.
- [11] F. Dabek, M. F. Kaashoek, D. Karger, R. Morris, and I. Stoica. Wide-Area Cooperative Storage with CFS. In ACM SOSP ’01, October 2001.
- [12] R. Dingledine, M. J. Freedman, and D. Molnar. The Free Haven Project: Distributed Anonymous Storage Service. In International workshop on Designing privacy enhancing technologies, pages 67 – 95, 2001.
- [13] P. Duchon, N. Hanusse, E. Lebhar, and N. Schabanel. Towards Small World Emergence. In ACM Symposium on Parallelism in Algorithms and Architectures, pages 225 – 232, 2006.
- [14] B. Gaume and F. Mathieu. From Random Graph to Small World by Wandering. Technical Report 6489, Unité de recherche INRIA Rocquencourt, 2008.
- [15] A. V. Goldberg and P. N. Yianilos. Towards an Archival Intermemory. In Advances in Digital Libraries (ADL), pages 147 – 156, 1998.
- [16] D. Gross. What’s the controversial site Megaupload.com all about? CNN Tech, January 21, 2012.
- [17] J. Hunter and S. Choudhury. A Semi-Automated Digital Preservation System Based on Semantic Web Services. In Joint Conference on Digital Libraries ’04, pages 269 – 278, 2004.
- [18] R. Kahn and R. Wilensky. A Framework for Distributed Digital Object Services. International Journal on Digital Libraries, 6(2):115 – 123, 2006.
- [19] J. Kleinberg. The Small-World Phenomenon: An Algorithmic Perspective. In Proceedings of the 32nd ACM Symposium on Theory of Computing, volume 32, pages 163 — 170, 2000.
- [20] K. Klemm and V. M. Eguíluz. Growing Scale-Free Networks with Small-World Behavior. Physical Review E, 65(5):57102, 2002.
- [21] C. Lagoze, H. Van de Sompel, P. Johnston, M. L. Nelson, R. Sanderson, and S. Warner. Object Re-Use & Exchange: A Resource-Centric Approach. arXiv:0804.2273, 2008.
- [22] P. Maniatis, M. Roussopoulos, T. J. Giuli, D. S. H. Rosenthal, and M. Baker. The LOCKSS Peer-to-Peer Digital Preservation System. ACM Transactions on Computer Systems, 23(1):2 – 50, 2005.
- [23] F. McCown and M. L. Nelson. What happens when facebook is gone? In Joint Conference on Digital Libraries ’09, pages 251 – 254, 2009.
- [24] M. Milian. GeoCities’ time has expired, Yahoo closing the site today. Los Angeles Times, October 26, 2009.
- [25] V. Nguyen and C. Martel. Analyzing and characterizing small-world graphs. In ACM-SIAM Symposium on Discrete Algorithms, pages 311 – 320, 2005.
- [26] S. Payette and T. Staples. The Mellon Fedora Project. In ECDL ’02, pages 406 – 421, 2002.
- [27] A. Rajasekar, M. Wan, and R. Moore. MySRB & SRB: Components of a Data Grid. In Symposium on High Performance Distributed Computing, pages 301 – 310, 2002.
- [28] A. Rajasekar, M. Wan, R. Moore, and W. Schroeder. A prototype rule-based distributed data management system. In HPDC workshop on Next Generation Distributed Data Management, 2006.
- [29] S. Ratnasamy, P. Francis, M. Handley, R. Karp, and S. Schenker. A Scalable Content-Addressable Network. In SIGCOMM ’01, pages 161 – 172, 2001.
- [30] C. W. Reynolds. Flocks, Herds and Schools: A Distributed Behavioral Model. SIGGRAPH Computer Graphics, 21(4):25 – 34, 1987.
- [31] S. Rhea, C. Wells, P. Eaton, D. Geels, B. Zhao, H. Weatherspoon, and J. Kubiatowicz. Maintenance-Free Global Data Storage. IEEE Internet Computing, 5(5):40 – 49, 2001.
- [32] J. Rothenberg. Avoiding Technological Quicksand: Finding a Viable Technical Foundation for Digital Preservation. Council on Library and Information Resources, 1999.
- [33] A. Rowstron and P. Druschel. Storage Management and Caching in PAST, a Large-Scale, Persistent Peer-to-Peer Storage Utility. In SOSP ’01, pages 188 – 201, 2001.
- [34] C. Smith. Social Network Friendster Getting Massive Overhaul On May 31. Huffington Post, April 27, 2011.
- [35] M. Smith. DSpace: An Institutional Repository from the MIT Libraries and Hewlett Packard Laboratories. In ECDL ’02, pages 543 – 549, 2002.
- [36] H. Van de Sompel, J. Bekaert, X. Liu, L. Balakireva, and T. Schwander. aDORe: A Modular, Standards-Based Digital Object Repository. The Computer Journal, 48(5):514 – 535, 2005.
- [37] R. Walker. Cyberspace When You’re Dead. The New York Times, January 11, 2011.
- [38] D. Waters and J. Garrett. Preserving Digital Information. Report of the Task Force on Archiving of Digital Information. The Commission on Preservation and Access, 1996.
- [39] D. J. Watts and S. H. Strogatz. Collective dynamics of ‘small world’ networks. Nature, 393:440 – 442, June 1998.
- [40] M. Wohlsen. Digital data that never dies. Associated Press, January 16, 2011.
- [41] S. Yin. Flickr Permanently Deletes User’s Account, 4,000 Photos by Accident. PC Magazine, February 2, 2011.