Femtosecond phase-resolved microscopy of plasmon dynamics in individual gold nanospheres
Abstract
The selective optical detection of individual metallic nanoparticles (NPs) with high spatial and temporal resolution is a challenging endeavour, yet is key to the understanding of their optical response and their exploitation in applications from miniaturised optoelectronics and sensors to medical diagnostics and therapeutics. However, only few reports on ultrafast pump-probe spectroscopy on single small metallic NPs are available to date. Here, we demonstrate a novel phase-sensitive four-wave mixing (FWM) microscopy in heterodyne detection to resolve for the first time the ultrafast changes of real and imaginary part of the dielectric function of single small ( nm) spherical gold NPs. The results are quantitatively described via the transient electron temperature and density in gold considering both intraband and interband transitions at the surface plasmon resonance. This novel microscopy technique enables background-free detection of the complex susceptibility change even in highly scattering environments and can be readily applied to any metal nanostructure.
Metallic nanoparticles exhibit morphology-dependent electromagnetic resonances also called surface plasmon resonances (SPR) which couple to propagating light. These resonances originate from a coherent oscillation of electrons in the metal where the restoring force is due to the electric field created by the corresponding charge displacement. Since this electric field depends on the morphology, the SPR frequency and linewidth is a function of the shape and size of the NP and its dielectric environment Jain et al. (2006); Berciaud et al. (2005); Muskens et al. (2008). The resulting local optical resonances can be exploited to image metallic NPs with high spatial resolution and to probe nanoscale regions in the NP vicinity through the local electric field of the resonance. Especially gold NPs are ideal optical labels for biological applications owing to their bio-compatibility and photostability, and much effort has been devoted recently to develop techniques capable of detecting gold NPs in cells and tissues with high contrast and sensitivity to the single particle level Boyer et al. (2002); van Dijk et al. (2006); Lindfors et al. (2004); Lippitz et al. (2005); Schwartz and Oron (2009); Masia et al. (2009).
Ultrafast optical spectroscopy of metallic NPs is an intriguing area of research investigating the correlated electronic and vibrational dynamics in nanosized metals. Due to limited detection sensitivity, most of the experiments performed so far Voisin et al. (2004); Hartland (2011) used large ensembles of metallic NPs, with the associated difficulty of inhomogeneous NP size, shape and environment fluctuations. Only few reports on ultrafast pump-probe spectroscopy on single small metallic NPs Muskens et al. (2006); van Dijk et al. (2005, 2007); Hartland (2011) are available to date. Importantly, these experiments lacked the ability to extract the change in the NP dielectric function as a complex quantity separating its real and imaginary part not . This however is the key physical quantity of interest, being a function of the electron and lattice temperatures transiently changing during the thermalization dynamics Voisin et al. (2004).
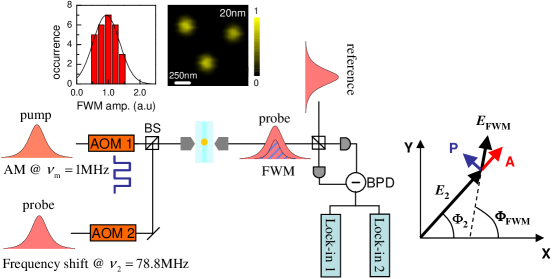
To overcome these limitations we have developed a phase-sensitive transient four-wave mixing microscopy technique as sketched in Fig. 1. Laser pulses of fs Fourier-limited duration with a tuneable center wavelength from 540 nm to 590 nm and MHz repetition rate are split into three beams. One beam acts as pump and excites the NP with an intensity which is temporally modulated by an acousto-optic modulator (AOM) driven with an amplitude modulation of frequency MHz. This implementation replaces the two beam interference used in our previous work Masia et al. (2009), providing a stable phase of the modulation. The change in the NP optical properties induced by this excitation are probed by a second pulse at an adjustable delay time after the pump pulse. A FWM signal proportional to with , electric fields of the pump and probe, respectively, is collected in transmission and detected interferometrically using the third beam acting as reference. We used a heterodyne scheme to discriminate the FWM field from pump and probe pulses and to detect amplitude and phase of the field. By up-shifting the probe optical frequency via a second AOM (driven with a constant amplitude at a frequency of MHz) we detected the interference of the FWM with the reference at the frequency MHz by a dual-channel lock-in amplifier. We simultaneously detect the interference of the transmitted probe with the reference at MHz using a second dual-channel lock-in, and deduced the amplitude () and phase () components of the FWM field relative to the transmitted probe (see sketch in Fig. 1 and supplementary material (SM)). We have previously demonstrated background-free FWM imaging in a highly scattering and fluorescing environment, and sensitivity to the single NP level with a spatial resolution significantly surpassing one photon diffraction Masia et al. (2009). An example of FWM imaging of gold NPs of 20 nm diameter resonantly excited and probed at 550 nm is shown in the inset of Fig. 1 together with an histogram indicating a monomodal size distribution well separated from the noise level (here of the NP signal), confirming that each spot corresponds to a single NP.
To explain how the detection of and enables us to distinguish the transient changes of the real and imaginary part of the dielectric function of a single NP, we write the induced polarization field at the particle as where is the vacuum permittivity, is the dielectric constant of the medium surrounding the NP and is the particle polarizability. For a particle radius much smaller than the wavelength of light (Rayleigh limit), the polarizability is given by with the particle dielectric constant . We denote as an effective dielectric constant, and the FWM field in terms of the nonlinear polarization from the pump-induced change , ie . The complex dielectric constant is then expressed in terms of its amplitude and phase , as well as the probe field , such that . Hence is the phase difference between the FWM field and the probe field at the particle position. The transmitted probe in the far field acquires a phase shift compared to a spherical wave of the FWM field, known as Gouy phase shift for a Gaussian beam. The Gouy phase shift is from the focus to infinity, hence in the far-field the FWM field is phase-shifted relative to the transmitted probe by . The amplitude modulation of the transmitted probe is then (see sketch in Fig. 1) and the phase modulation is . Note that the particle absorption cross-section is proportional to the imaginary part of as can be deduced from Mie theory in the small particle limit, hence is a measure of the change in absorption cross-section.
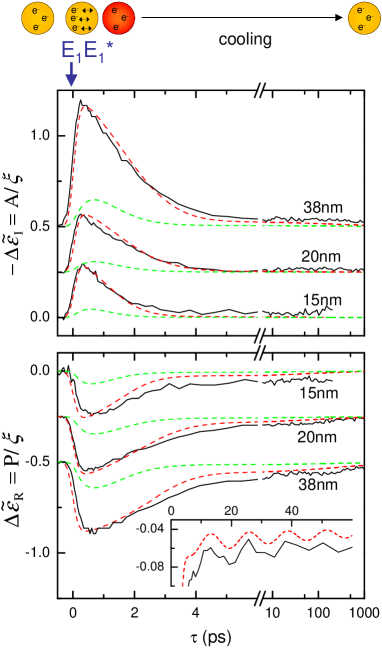
The measured and versus pump-probe delay for single gold NPs of various sizes resonantly excited and probed at 550 nm are shown in Fig. 2. Both exhibit an initial dynamics in the picosecond time scale followed by a decay in the hundreds of picoseconds. Qualitatively, one can understand these dynamics as being related to the pump-induced increase in the electron temperature which provokes a broadening and a shift of the SPR probed by . The picosecond decay is related to the thermalization of the hot electron gas with the cooler lattice by electron-phonon coupling, while the thermalization of the heated NP with the cooler surrounding is providing the subsequent decay. To achieve a quantitative description of the measured dynamics we modeled using the gold NP dielectric function
| (1) |
where is the plasma frequency (, and being the conduction electron density, charge and effective mass respectively), is the inverse of the electron relaxation time, and is the contribution due to bound electrons associated with interband transitions from the d-bands to the conduction band. At room temperature in the absence of optical excitation can be approximated as Voisin et al. (2001)
| (2) |
where is the bulk damping rate, m/s is the Fermi velocity, and parametrizes surface damping effects. For bulk gold we used eV and meV, well reproducing the Drude part of the bulk dielectric constant measured by Johnson and Christy Johnson and Christy (1972). These values also reproduce experimental absorption spectra of single gold nanoparticles in the literature Berciaud et al. (2005). The parameter varies in the literatureBerciaud et al. (2005); Muskens et al. (2008) from 0.2 to 2.2, and even between individual NPs within the same experiment. This variance is likely to be related to the atomistic NP surface structure/faceting Muskens et al. (2008) hence we use as free parameter falling in the range of previously reported values. In the presence of optical excitation we then model the change in the electron temperature and lattice temperature using a two-temperature model Voisin et al. (2001); Muskens et al. (2006)
| (3) |
| (4) |
where is the electronic heat capacity, well described by for Lin et al. (2008) K, is the lattice heat capacity, and is the electron-phonon coupling constant. and are taken as the bulk value scaled to the NP volume (see SM). describes the heat loss from particle to the surrounding and is calculated using the diffusion equation for the temperature of the surrounding medium (see SM). describes the excitation process which has two components, and , related to free and bound electrons, respectively. The bound electron contribution has to be considered since in spherical gold NPs the onset of interband transitions from d-bands to the conduction band at the Fermi surface is energetically close to the SPR.Voisin et al. (2001) is modeled as a rapid ( fs, quasi instantaneous for the 150 fs pulses used) transfer of energy from the resonantly excited SPR to single electron excitations of the conduction band, which thermalize with the free-electron gas creating a hot Fermi-Dirac distribution on a characteristic time scale Voisin et al. (2001, 2004). Similarly originates from the transfer of energy from the SPR to interband excitations and consequent heating of the free electron gas via Auger electron-hole recombination with a characteristic time (see SM). Noticeably, most pump-probe experiments in previous literature use a pump photon energy below the onset of interband transitions, and thus neglect the latter effect Voisin et al. (2004); Hartland (2011). The time integral of is equal to the absorbed energy calculated from the NP absorption cross-section and the pump pulse fluence in the experiment.
The non-equilibrium electron and lattice temperatures modify the electron-electron and electron-phonon scattering processes, which can be describedSmith and Ehrenreich (1982) by with
| (5) |
and
| (6) |
using the equilibrium temperature . The electron and lattice temperatures also affect . To estimate this effect we calculated the imaginary part of due to interband transitions near the X and L points, starting from the description in Refs. Guerrisi et al., 1975; Rosei, 1974. The temperature dependence of results from the Fermi distribution and a spectral broadening proportional to (see SM). The real part of is calculated from using Kramers-Kronig.
The transient change in modifies and is the source of the measured and via and (see Fig. 2) with a constant not . We are able to consistently model all measured dynamics for particle sizes up to 40 nm diameter and for different pump excitation intensities in the J/m2 range with only few particle-dependent (, ) and particle independent (, , , ) parameters. The gold band–structure parameters to calculate are taken from literature Guerrisi et al. (1975); Rosei (1974). The proportionality term scales with and is independent of the pump intensity as expected from the particle polarizability . Larger particles have a polarizability which deviates significantly from the Rayleigh limit used here, and we found that FWM dynamics measured on 100 nm diameter particles can no longer be described by our model (see SM). We calibrated the size of the 38 nm NP investigated in Fig. 2 using the period of the coherent phonon oscillations observed in (see inset in Fig. 2). These are due to the modulation of the plasma frequency by the breathing vibrational mode of the nanoparticle with an oscillation period proportional to the particle radius Voisin et al. (2001); van Dijk et al. (2005); Hartland (2011)(see SM). On NPs smaller than 20 nm the oscillation period was not resolved, possibly because its time scale becomes comparable to the lattice expansion which is no longer impulsively exciting the vibrational mode hence its amplitude falls below the measurement noise. In this case the particle size was derived from the strength of the measured FWM field relative to that of the 38 nm particle, consistently with .
We use fs independent on particle size in the 15-40 nm diameter range from Ref. Voisin et al., 2001, s-1eV-2K-2 and s-1eV-2K-1 consistent with Ref. Smith and Ehrenreich, 1982, and in the range 1.8-1.9 consistent with Ref. Muskens et al., 2008.
The fast rise of and observed in our data reveals a fast d-state Auger recombination time of fs . While this time has not been measured previously in Au, it is within the energy-dependent range of 250-20 fs measured in Cu Knoesel et al. (1998). To clarify the significance of interband transitions in the SPR resonant excitation, we show in Fig. 2 also simulations (green lines) neglecting the heating in Eq. 3 due to the interband transitions. The effect of interband transitions in the excitation is important to account not only for the magnitude of the measured change, but also its dynamics, particularly for the observed fast rise time. We could simulate the measured rise time without the interband contribution only when using fs, much faster than the well characterized 500 fs electron thermalization dynamics Voisin et al. (2001) in bulk gold and gold NPs larger than 10 nm. The faster Auger recombination of the d-holes thus gives rise to a qualitatively different initial dynamics, and can be attributed to a higher density of states available in the scattering involving the lower-lying d-states.
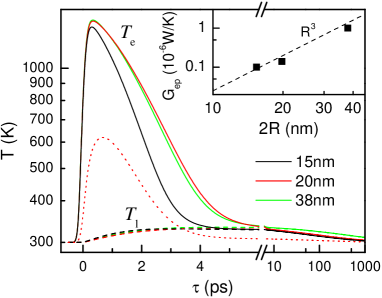
It is instructive to examine the temperature transients of and plotted in Fig. 3. Noticeably the electron temperature reaches a maximum value which is almost independent of NP size. This is a consequence of the volumetric dependence of both the electron heat capacity and the absorption cross-section, balancing each other. The decay of on the picosecond time scale coincides with the rise of due to electron-phonon coupling, and the electron temperature after thermalization is much lower due to the significantly larger lattice heat capacity (). We find that also has a nearly volumetric dependence, and in turn the electron-phonon dynamics exhibits only a weak size dependence in the size range 15-40 nm investigated here, consistent with reports in the literature Arbouet et al. (2003). We also observe that the cooling with the environment is size dependent, with smaller particles cooling faster Hartland (2011). We point out that the average temperature increase at the particle surface is only 1.3 K, 1.9 K, and 4.7 K for 15 nm, 20 nm and 38 nm diameters respectively and can be lowered to 1.3 K for 38 nm diameter at the lowest ( J/m2) pump excitation used in the experiment. Importantly, such low average photothermal heating indicates that our technique is compatible with live cell applications. Finally, the effect of the interband excitation is shown by plotting in its absence (dotted curve in Fig. 3), which shows a delayed rise and reaches only about half of the maximum electron temperature.
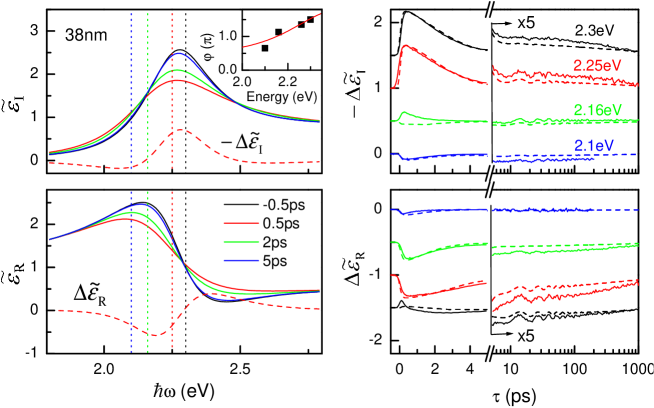
To visualize the origin of the FWM signal in terms of broadening and shift of the SPR we plot in Fig. 4 the spectra of and at different delay times for an excitation at 550 nm. The negative change of probed at 550 nm (see dotted red vertical line in Fig. 4) is mainly a result of the broadening of the SPR and in turn quenching of the resonance. Conversely, the negative change of at 550 nm is a combination of the SPR broadening and its frequency shift toward lower energies. Measurements and simulations of and excited and probed at 540 nm ( eV) and 575 nm ( eV) elucidate the cases of being mostly sensitive to the SPR broadening and to the SPR shift, and vice versa. Specifically we see that at 2.3 eV, is a sensitive probe of the modulation of the SPR by the breathing vibrational mode, while is essentially unaffected by it. We also performed measurements and simulations at 590 nm ( eV) where changes sign. Noticeably, the initial dynamics measured at different wavelengths is consistently reproduced by our model of the fast Auger recombination of the d-holes. Finally, to illustrate that the novel imaging technique presented here can be used to sense SPR shifts relative to the probe wavelength in an intrinsic ratiometric way independent of the signal strength, we show in the inset of Fig. 4 the phase of from the ratio between its imaginary and real part at ps. changes by nearly 180 degrees over only 50 nm wavelength as a direct manifestation of the transition from , (, at 540 nm) to , (, at 575 nm), to , (, at 590 nm).
Our technique is applicable to any NP shape to reveal new physics insights in the electron and lattice dynamics of novel metallic nanostructures. Importantly it is compatible with living cell applications and offers background–free time-resolved detection of the full complex change of the dielectric constant. The intrinsic ratiometric information in the signal phase enables sensing applications such as monitoring nanoscale distance changes with plasmon rulers Sönnichsen et al. (2005) in highly scattering environments such as cells and tissues.
I Methods
Commercially available gold NPs in aqueous suspension (BB International) were drop cast on a glass cover slip at sufficiently low density so that regions with well separated individual NPs were formed, and subsequently embedded in a mounting medium (Cargille Meltmount) index-matched to the oil-immersion microscope objectives used for high-resolution imaging (see also Ref. Masia et al., 2009). The sample is scanned using an xyz piezoelectric stage (Physik Instrumente Nanocube).
Optical pulses were provided by the intra-cavity frequency-doubled optical parametric oscillator (APE-PP2) pumped by a Ti:Sapphire oscillator (Coherent Mira). Pulses were linearly polarized vertically (V) or horizontally (H) in the laboratory system using and waveplates, and a VHH polarization configuration for , and the reference field was used to suppress background from detector nonlinearities Masia et al. (2009).
Acknowledgements.
F.M. acknowledges financial support from the European Union (Marie Curie grant agreement PIEF-GA-2008-220901) and the Welcome Trust (VIP award). P.B. acknowledges the EPSRC UK Research Council for her Leadership fellowship award (grant n. EP/I005072/1).References
- Jain et al. (2006) P. K. Jain, K. S. Lee, I. H. El-Sayed, and M. A. El-Sayed, J. Phys. Chem. B, 110, 7238 (2006).
- Berciaud et al. (2005) S. Berciaud, L. Cognet, P. Tamarat, and B. Lounis, Nano Lett., 5, 515 (2005).
- Muskens et al. (2008) O. L. Muskens, P. Billaud, M. Broyer, N. D. Fatti, and F. Vall e, Phys. Rev. B, 78, 205410 (2008).
- Boyer et al. (2002) D. Boyer, P. Tamarat, A. Maali, B. Lounis, and M. Orrit, Science, 297, 1160 (2002).
- van Dijk et al. (2006) M. A. van Dijk, A. L. Tchebotareva, M. Orrit, M. Lippitz, S. Berciaud, D. Lasne, L. Cognet, and B. Lounis, Phys. Chem. Chem. Phys., 8, 3486 (2006).
- Lindfors et al. (2004) K. Lindfors, T. Kalkbrenner, P. Stoller, and V. Sandoghdar, Phys. Rev. Lett., 93, 037401 (2004).
- Lippitz et al. (2005) M. Lippitz, M. vanDijk, and M. Orrit, Nano Lett., 5, 799 (2005), ISSN 1530-6984.
- Schwartz and Oron (2009) O. Schwartz and D. Oron, Nano Lett., 9, 4093 (2009).
- Masia et al. (2009) F. Masia, W. Langbein, P. Watson, and P. Borri, Opt. Lett., 34, 1816 (2009).
- Voisin et al. (2004) C. Voisin, D. Christofilos, P. A. Loukakos, N. D. Fatti, F. Vallée, J. Lermé, M. Gaudry, E. Cottancin, M. Pellarin, and M. Broyer, Phys. Rev. B, 69, 195416 (2004).
- Hartland (2011) G. V. Hartland, Chem. Rev., 111, 3858 (2011).
- Muskens et al. (2006) O. L. Muskens, N. D. Fatti, and F. Vallée, Nano Lett., 6, 552 (2006).
- van Dijk et al. (2005) M. A. van Dijk, M. Lippitz, and M. Orrit, Phys. Rev. Lett., 95, 267406 (2005).
- van Dijk et al. (2007) M. A. van Dijk, M. Lippitz, D. Stolwijk, and M. Orrit, Optics Express, 15, 2273 (2007).
- (15) Van Dijk et al. van Dijk et al. (2007) detected the transmission interferometrically using a reference field to distinguish changes in amplitude and phase. However, their set-up utilizes probe and reference pulses traveling through the sample separated in time by 10 ps, which resulted in the measurement of the 10 ps-difference in the pump-induced change of the field. This quantity is only indirectly related to the change in the NP complex dielectric function which could not be extracted from their data.
- Voisin et al. (2001) C. Voisin, N. D. Fatti, D. Christofilos, and F. Vallee, J. Phys. Chem. B, 105, 2264 (2001).
- Johnson and Christy (1972) P. B. Johnson and R. W. Christy, Phys. Rev. B, 6, 4370 (1972).
- Lin et al. (2008) Z. Lin, L. V. Zhigilei, and V. Celli, Phys. Rev. B, 77, 075133 (2008).
- Smith and Ehrenreich (1982) J. B. Smith and H. Ehrenreich, Phys. Rev. B, 25, 923 (1982).
- Guerrisi et al. (1975) M. Guerrisi, R. Rosei, and P. Winsemius, Phys. Rev. B, 12, 557 (1975).
- Rosei (1974) R. Rosei, Phys. Rev. B, 10, 474 (1974).
- (22) To represent the measurement conditions in the detection, the calculated is convoluted with the pulse intensity gaussian profile.
- Knoesel et al. (1998) E. Knoesel, A. Hotzel, and M. Wolf, Phys. Rev. B, 57, 12812 (1998).
- Arbouet et al. (2003) A. Arbouet, C. Voisin, D. Christofilos, P. Langot, N. D. Fatti, F. Vallee, J. Lerme, G. Celep, E. Cottancin, M. Gaudry, M. Pellarin, M. Broyer, M. Maillard, M. P. Pileni, and M. Treguer, Phys. Rev. Lett., 90, 177401 (2003).
- Sönnichsen et al. (2005) C. Sönnichsen, B. M. Reinhard, J. Liphardt, and A. P. Alivisatos, Nat. Biotech., 23, 741 (2005).