-
Citations to Australian Astronomy: 5 and 10 Year Benchmarks
Abstract:
Expanding upon Pimbblet’s informative 2011 analysis of career -indices for members of the Astronomical Society of Australia, we provide additional citation metrics which are geared to a) quantifying the current performance of b) all professional astronomers in Australia. We have trawled the staff web-pages of Australian Universities, Observatories and Research Organisations hosting professional astronomers, and identified 384 PhD-qualified, research-active, astronomers in the nation — 132 of these are not members of the Astronomical Society of Australia. Using the SAO/NASA Astrophysics Data System, we provide the three following common metrics based on publications in the first decade of the 21st century (2001–2010): -index, author-normalised citation count and lead-author citation count. We additionally present a somewhat more inclusive analysis, applicable for many early-career researchers, that is based on publications from 2006–2010. Histograms and percentiles, plus top-performer lists, are presented for each category. Finally, building on Hirsch’s empirical equation, we find that the (10-year) -index and (10 year) total citation count can be approximated by the relation for .
Keywords: sociology of astronomy — publications, bibliography — astronomical databases, surveys.
1 Introduction
Quantitative metrics, which we all experienced through school and university —– and which many of us now apply to individuals in our own classes –— are common in science. Assessment systems based upon numerical indicators for scientific research invariably include some form of bibliometric indicator of quality. While sheer numbers of papers were once favoured, there is thankfully now an increased emphasis on quality rather than quantity. ‘Citations’ are liked (by most) for their objective and quantitative ability to grade our most common research product, namely our papers. Citations reflect the global perception of the relevance and usefulness of a paper. Such community-weighted global opinion offers a means to avoid potentially discrepant personal opinions, which can at times be misplaced or outdated.
The most frequently used criteria for quantifying the research impact and visibility of astronomers are, partly for the reasons given above, citations. While acknowledging that quality and visibility are not always synonymous, objective measures are generally more equitable and preferable than subjective commentary in science. Citation-based rankings actually apply to many aspects of our profession, including not only research papers (Burstein 2000; Pearce 2004), but also telescope and observatory performance (Abt 1985, 2003; Peterson 1987; Trimble 1995; Grothkopf et al. 2007), Australian Research Centres (through the Federal Government’s research quality assurance audit known as ‘Excellence in Research for Australia’ (ERA)111http://www.arc.gov.au/era), Universities (through the ‘Academic Ranking of World Universities’ (ARWU)222http://www.arwu.org conducted by the Shanghai Jiaotong University), and even countries (Sánchez & Benn 2004). Not surprisingly, journals themselves, including this one, are evaluated upon citations, with Thompson Scientific generating annual (Garfield 1972a,b) Impact Factors333http://thomsonreuters.com/products_services/science/free/essays.
Here we provide a transparent, Australia-wide impact assessment of astronomical research over the past 5 and 10 years through the use of several clearly-defined, objective citation metrics. While a decade is an acceptable time frame for measuring stable, long-term, levels of performance by established researchers, the 5-year interval is additionally applicable to early-career researchers and it better matches the time frame used by the Australian Research Council when reviewing one’s immediate past performance. The objective statistics and benchmarks herein are expected to be of interest to Australian astronomers and, as also noted by Pimbblet (2011), have some relevance to nationally competitive grant schemes. In time, such surveys may also acquire some historical value, in particular because they can be used to track changes and show trends. Moreover, this paper is in the same vein as the Federal Government’s November 2011 Focusing Australia’s Publicly Funded Research review which called for “a rigorous, transparent, system-wide Australian research impact assessment mechanism”.
Pimbblet (2011) used the Hirsch (2005) -index, sometimes mis-referred to as the Hirsch-index, to provide a histogram and “top ten” table of individual career -indices for members of the Astronomical Society of Australia. Here we also provide a community histogram and “top ten” table of -indices, but for -indices acquired over the same time interval, specifically, the first decade of this century. Due to shared rankings, this table is found to contain some 20 names. As recognised by others, such a metric, along with the “total citation count”, is at some level reflective of the performance of the teams, and facilities, that one has belonged to rather than purely an individuals performance. We therefore also provide histograms, percentiles, and top-20 lists for author-normalised citations and lead-author citations from 2001–2010 and from 2006-2010. We have allowed one year (2011) for citations to accrue; for comparison, Pearce (2004) allowed 6 months.
We additionally report on the demographics of our nation’s research-active, PhD-qualified astronomers, which we have discovered now tallies nearly 400. Contributing to this much higher than anticipated number has been the establishment and growth of new astronomy Centres over the last decade. We note that our survey includes over 100 astronomers missing from the analysis by Pimbblet (2011) because they are not voluntary members of the Astronomical Society of Australia. Our survey thus represents the largest current census of professional astronomers in the nation.
1.1 Important caveats
Before proceeding, it may be of interest for some to learn that within the journal Scientometrics and the Journal of Informetrics, there is an increasing amount of publications re-assessing the merits of the -index and discussing many alternatives, such as the -index (Egghe 2006) or the and indices (Jin et al. 2007), which can also have their cons. A prominent critical review of the -index can be found in a report by the joint Committee on Quantitative Assessment of Research (Adler et al. 2008), while the extensive article by Panaretos & Malesios (2009) also critically reviews the -index, and alternative single metrics (see also Moed & van Leeuwen 1996 and Bornmann & Daniel 2007). Issues raised, some by Hisrch (2005) himself, include the fact that references can be both favourable and not, the index does not discriminate between single authorship and co-authorship, self-citations increase with the number of publications, popular references may be used to flesh out Introductions even though they have no real connection with the essence of the paper, and something referred to as “cronyism” (Meho 2007) in which those having many co-operating scientists may receive lots of citations. Most recently, Balaban (2012) have further reviewed the limitations of the -index, but note that despite these the -index has gained widespread acceptance due to its simplicity. In spite of its inadequacies, it would be remiss of us if we did not include the -index, especially given that we are building on the study by Pimbblet (2011).
Astronomers spend varying amounts of their office (and home) life undertaking research, teaching, grading, instrumentation, service and administration, public outreach and other work-related duties. Citations are a recognition of only one of these activities, which is not to belittle any of the other essential tasks. Indeed, credit for performance in the other areas exist: Carrick Awards recognise Australian university teaching, as do several Australian Museum Eureka Prizes, which also reward public outreach and many other worthy activities. There is additionally the American Astronomical Society’s Joseph Weber Award for Astronomical Instrumentation, the (British) Royal Astronomical Society’s Jackson Gwilt medal, Australia Day honours for service, and others.
Citations are in essence a reflection of relevance to the research interests of others. The most brilliant article in the world will not attract citations unless there are other scientists who are (eventually) interested. Similarly, there may well be geniuses working in a discipline which has only a small community of active researchers. Their citations will not, at the present time at least, climb to the heights of those working on say cosmology or exoplanets (see the discussion by Abt 2006, and/or the treatise by Wouters 1999). Citations are therefore not a perfect measure of capability but a reflection of productivity which others are interested in. Furthermore, although some articles are destined to never receive vast citations, they can still contain elements of interest to some in the community and be worthy of publication, such as, hopefully, this one.
2 The Astronomers
To complete the tasks mentioned above, we searched for astronomers currently based in Australia who had during the first decade of this century published citable articles as catalogued within the Astrophysics Data System444http://adsabs.harvard.edu (ADS) operated by the Smithsonian Astrophysical Observatory (SAO) under a National Aeronautics and Space Administration (NASA) grant. Our nation’s 150+ PhD students in astronomy were however excluded to avoid considerably skewing the following histograms and percentiles by scholars who have not yet had 5 or 10 years of publication history. While the choice of database can of course influence the results, the ADS is the preferred database of astronomers, invariably yielding more complete results (for astronomers) than those obtained from subscription-based databases such as Scopus555http://www.scopus.com/scopus and the Web of Knowledge666http://www.isiwebofknowledge.com, and free search engines such as Google Scholar777http://scholar.google.com. Being a free service, it also has the advantage that it can be checked and used by all.
Our search for Australian-based astronomers was conducted using the staff web-pages within: our nation’s many Universities (we found astronomers in 21 of these, sometimes located in multiple departments or schools); the Commonwealth Scientific and Industrial Research Organisation’s (CSIRO’s) Astronomy and Space Science (CASS) and Materials Science and Engineering (MSE) divisions; the Australian Defence Force Academy (through the University of New South Wales); the Australian Astronomical Observatory (AAO), the Perth Observatory and a couple of Planetariums. Apologetically, we did not, however, manage to include those at the Space Weather Branch of the Bureau of Meteorology, in particular the IPS Radio and Space Services888http://www.ips.gov.au. We then used the membership list of the Astronomical Society of Australia999http://asa.astronomy.org.au (ASA) to search for missed astronomers who are Full Members, Associate Members or Fellows of the ASA that are based in Australia and have published astronomy articles this past decade.
The data acquired from the ADS was obtained from 2011 December 6–9. For accuracy, this was re-checked from 2011 December 12–16. Although the ADS is fairly complete, no claim to 100% accuracy is made.101010http://doc.adsabs.harvard.edu/abs_doc/faq.html#complete
Some care was taken to identify the relevant publications when a common author’s name, such as Peterson, was encountered. However, as noted by Pimbblet (2011), some errors will inevitably creep in. While the use of a middle initial greatly facilitated the exclusion of publications from extraneous individuals with the same surname and first initial, roughly 10% of the entries are biased high by a few percent due to erroneous citation accreditation from other individuals. Only nine individuals with common names (plus a common first initial), such as Smith and Jones, were excluded due to the time that would have been required to acquire their true citation record. Given the comings and goings of postdoctoral researchers and astronomers each year in Australia, this is considered an acceptable tolerance. Finally, we note that some care, albeit on a best-effort basis, was also given to the use of multiple variants of names, for example Dick=Richard, Betty=Elizabeth=Liz, Bob=Robert, etc. Unfortunately no allowances for disturbances such as long-term illnesses, maternity/paternity leave, job/life relocation, etc. could be made. Our final citation catalogue is comprised of 375 (=384-9) research astronomers in Australia.
| Location | # of Astronomers | # of ASA members |
|---|---|---|
| CSIRO (CASS) | 58 | 41 (71%) |
| CSIRO (MSE) | 1 | 0 (0%) |
| The Australian National University (MSSSO) | 40 | 27 (68%) |
| The Australian National University (non-MSSSO) | 9 | 6 (67%) |
| The University of Sydney | 39 | 28 (72%) |
| Swinburne University of Technology | 31 | 22 (71%) |
| The University of Western Australia (ICRAR) | 24 | 14 (58%) |
| The University of Western Australia (non-ICRAR) | 5 | 5 (100%) |
| Australian Astronomical Observatory | 26 | 19 (73%) |
| Curtin University of Technology | 25 | 14 (56%) |
| Monash University | 23 | 14 (61%) |
| Macqaurie University | 17 | 10 (59%) |
| The University of New South Wales | 13 | 11 (85%) |
| University of Tasmania | 12 | 7 (58%) |
| The University of Melbourne | 10 | 8 (80%) |
| La Trobe University | 9 | 0 (0%) |
| James Cook University | 7 | 5 (71%) |
| The University of Queensland | 7 | 5 (71%) |
| Australian Defence Force Academy | 5 | 3 (60%) |
| The University of Newcastle | 5 | 0 (0%) |
| The University of Adelaide | 4 | 4 (100%) |
| Perth Observatory | 3 | 3 (100%) |
| University of Southern Queensland | 3 | 1 (33%) |
| University of South Australia | 2 | 0 (0%) |
| Queensland University of Technology | 1 | 1 (100%) |
| University of Western Sydney | 1 | 1 (100%) |
| University of Wollongong | 1 | 0 (0%) |
| Other | 3 | 3 (100%) |
| Total | 384 | 252 (66%) |
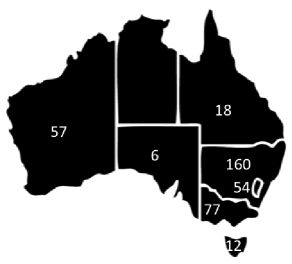
Table 1 and Figure 1 provide a breakdown of where the 384 astronomers can be found. In total, 132 of these astronomers are not members of the Astronomical Society of Australia111111For those who may be curious, and for comparison, roughly 60 of the 384 Australian astronomers are members of the American Astronomical Society. according to the online list121212http://physics.usyd.edu.au/asamail/asa_membership/members_html.php. What this means is that relative to this membership number of 252 (=384-132) non-retired Australian-based astronomers, an additional 50% of our nation’s professional astronomers are not members of the Astronomical Society of Australia. Of immediate surprise is this high number of PhD-qualified astronomers now working in Australia. This is in part due to a number of notable initiations over the last decade, including the growth of the Department of Physics and Astronomy at Macquarie University, Swinburne University of Technology’s Centre for Astrophysics — due to a University push to increase its research profile — and Curtin University’s Institute of Radio Astronomy (CIRA) coupled with The University of Western Australia’s International Centre for Radio Astronomy Research (ICRAR), both established in anticipation of the AUD$2bn Square Kilometre Array131313http://www.skatelescope.org (SKA) radio telescope being built in Western Australia and operational from 2020. Collectively these three Centres employ some 80 astronomers and are training a growing number of PhD students. Furthermore, the Federal Government’s recent Super Science Fellowships141414http://www.arc.gov.au/ncgp/ssf/ssf_default.htm has enabled the recruitment of some 30 astronomy postdoctoral researchers over the last couple of years. Given the global financial crisis over the past 3 years, which has seen a hiring freeze at many US Universities, Australia’s expansion has indeed been fortunate.
3 The Citation Data
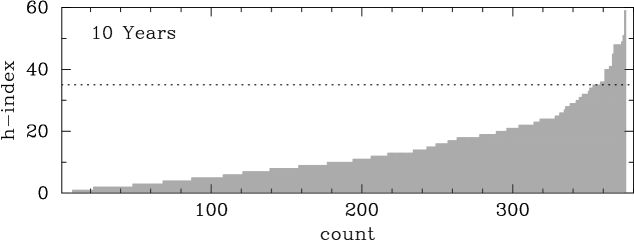
Figure 2 is a histogram of individual Hirsch (2005) -indices from publications over the first decade of this century, i.e. years 2001–2010. Hirsch (2005) argued that this index, representing an author’s number of papers having citation number , is preferable to the total number of citations. In contrasting the upper echelon of career -indices between members of the Astronomical Society of Australia and the American Astronomical Society (Conti et al. 2011), Pimbblet (2011) did however note that “membership of very large observational programmes can boost a researcher’s h-index above mean values”. Indeed, multiple author papers are known to attract more citations than single author articles (Abt 1984), possibly due to a greater advertisement of the work (Rao & Vahia 1986) or because of the greater input and/or grander issues tackled. Among the top dozen Australian names (see the Appendix, Table 3), eight are former members of the highly successful 2 degree Field (2dF) Galaxy Redshift Survey151515http://www2.aao.gov.au/2dFGRS (e.g. Colless et al. 2001), with one additionally belonging to the Sloan Digital Sky Survey161616http://www.sdss.org (SDSS; e.g. Adelman-McCarthy et al. 2008). Large collaborations at other wavelengths, such as the High Energy Stereoscopic System171717http://www.mpi-hd.mpg.de/hfm/HESS (HESS; e.g. Egberts et al. 2008) and the H Parkes All Sky Survey181818http://hipass.anu.edu.au (HIPASS; e.g. Barnes et al. 2001), can also bolster one’s -index. Furthermore, one can expect a similar positive outcome from membership of current large observing programmes on the Australian Astronomical Telescope191919http://www.aao.gov.au (AAT), such as WiggleZ202020http://wigglez.swin.edu.au (e.g. Drinkwater et al. 2006; Blake et al. 2009) and the Galaxy and Mass Assembly (GAMA) survey212121http://www.gama-survey.org (e.g. Driver et al. 2008; Robotham et al. 2010).
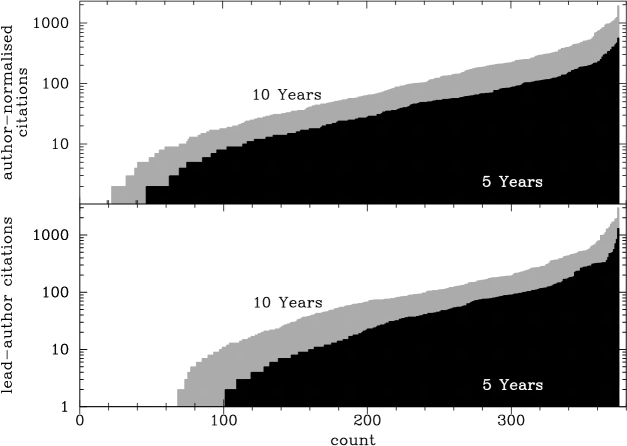
We have therefore presented two additional citation metrics which reflect the fact that authors of multiple-author papers (e.g. Bains et al. 2009; Robertson et al. 2010; Waite et al. 2011) would have all contributed to those papers, while the lead-author will have likely performed the bulk of the work. Figure 3 shows the normalized citation count (a sorting option within ADS in which each article’s total citation count is divided by the number of contributing authors), and an individuals total citation count when they are the lead-author (achieved by placing the carat symbol, ^, in front of an author’s name within the ADS web-form). The large range in citations, exemplified by the factors of 20 to 40 increase from the median to the highest values, and the factors of 2 to 4 increase from the 20th to the top ranked individuals, necessitated the use of a logarithmic scale in Figure 3. For the curious, the 20 top-ranked individuals from each of the above two citation metrics are listed in the Appendix (Tables 4 to 5, respectively).
The above analysis was repeated on publications from the 5 year interval 2006–2010, with the exception of the -index which may suffer from ‘small number’ statistics. The results are provided in Figure 3, with the top-ranking names again shown in the Appendix (Tables 6 to 7). Looking for anomalies, it is of interest to note, and credit, that the stratospheric result at the top of Table 7 is due to 1100+ citations to the highly successful paper by Croton et al. (2006). Many works by Asplund, such as Asplund et al. (2005, 2009), on the chemical composition of our Sun have also been incredibly useful and popular. It is also noteworthy that in the upper panel of Figure 3, the author-normalised citation count is seen to be remarkably log-linear from a count above 10 (8) for the 10 (and 5) year intervals, until the final 5-10% of the population is reached.
From the histograms in Figures 2 and 3, one can readily determine the 25%, 50%, 75%, 90% and 95% percentiles from each distribution, and these are shown in Table 2.
| Metric | 25% | 50% | 75% | 90% | 95% |
|---|---|---|---|---|---|
| -index, 10 yrs | 5 | 10 | 19 | 28 | 35 |
| normalised, 10 yrs | 17 | 57 | 186 | 387 | 563 |
| lead-author, 10 yrs | 10 | 59 | 164 | 424 | 650 |
| normalised, 5 yrs | 7 | 25 | 68 | 139 | 206 |
| lead-author, 5 yrs | 1 | 17 | 76 | 170 | 311 |
4 Discussion
Pimbblet (2011) recognised three issues with the histograms of career -indices that he presented: (i) there needs to be a calibration relative to the number of years in the business — which is why Hirsch (2005) introduced the -index222222The -index is essentially the -index divided by the number of years (minus 1) that one has been publishing.; (ii) that membership of large research programmes can inflate one’s -index; and (iii) an unknown fraction of our nation’s astronomers were excluded from his analysis. Indeed, his concluding remarks spoke to this, along with the instructive nature that such surveys can have for future comparisons.
In an effort to address point (i), Pimbblet first published a table of percentiles for the -index distribution based on one’s membership class within the Astronomical Society of Australia: a rough, and admittedly limited, measure of seniority and thus number of years publishing. This was then superseded by a table of percentiles for the -index distribution based on the number years since one’s PhD was (roughly) awarded, albeit with several caveats and the use of crude time-interval bins. Points (ii) and (iii) were not addressed. Abt (2012) tackled issue (i) by dividing the -index by the number of decades, or fractions thereof, that have elapsed since publication of a researcher’s first paper. Here we have endeavoured to correct for all three issues. This has been achieved through a rigorous search for research-active astronomers in Australia, and additionally providing metrics which may better reflect an individuals, rather than a team’s, performance. Unlike with career -indices, there is no need for us to provide plots and tables of the -index because our analysis is based on the same fixed 5 and 10 year interval for all involved. The results presented here do not however replace the good work of Pimbblet (2011), but rather build upon it. As noted previously, we have identified an additional 132 PhD-qualified astronomers in Australia.
The histograms and percentiles presented here provide a valuable snapshot of the performance of our nation’s astronomers, and also allow individuals to see how they may be fairing. Furthermore, it is of interest to see where our astronomers are currently distributed across the country (Table 1 and Figure 1). With the growth of astronomy, and the associated publication pressure if one is to remain competitive, comes an increased global number of citations. Pearce (2004) showed that, as of November 2003, the top 10% and 1% of the world’s astronomers based on author-normalised citations over the preceding 5 years (plus 6 months), had 41 and 168 author-normalised citations. Some 8 years later, the figures for Australian astronomers (albeit allowing an additional 12 rather than 6 months for citations to accrue, and thus a probable 15% increase) are 139 and 400.
4.1 Total Citations
Hirsch (2005, his equation 1) found that an author’s total number of citations is proportional to , with the constant of proportionality ranging from 3 to 5, i.e. . Accommodating for the fact that when , Spruit (2012) has recently argued that in astrophysics the -index correlates very tightly with , such that the mean relation is given by
| (1) |
Indeed, his data defining this relation showed very little scatter and he concluded that the -index therefore does not appear to measure anything significantly different to total citations. Having additionally collected total citations at the same time as the -index was collected, we are in a position to explore this claim using three times more data. Spruit’s self-recognised “non-random selection process” of 113 authors tended to select individuals with -indices typically greater than 10. As seen in Table 2, over the 10-year interval from 2001–2010 — let alone over a 5-year interval — half of our community have not acquired a -index as high as this, and it therefore remains to be established how and if the above expression applies to much of the community.
In Figure 4 we have plotted the -index against the total citation count, with both sets of values accrued from publications during 2001–2010. Figure 4 reveals (i) notably more scatter than Spruit observed, (ii) that Spruit’s relation is not applicable for less than 10, and (iii) that his expression defines something of an upper envelope rather than the actual mean distribution of our larger and less subjective data set. Above we do however observe a dense band similar to that found by Spruit (2012), while also observing a scatter roughly corresponding to a factor of 3 in total citation count at any given value of . Figure 4 also reveals that our distribution is better described by the mean relation
| (2) |
We find that we are also able to approximate the lower envelope of the distribution by the expression
| (3) |
which can be considered the counterpart to Spruit’s expression which matches the upper envelope of the distribution.
As Spruit (2012) noted, the relation between -index and total citation count, at least above 7–10, does indeed reveal that these quantities are related, which implies that, not surprisingly, one’s total citation count is also likely to be ‘stretched’ in the same way that the -index is due to membership of large research teams. Some 20 years ago this was not the concern that it is today, although it was always recognised that such values can be disproportionately affected by a single publication of major influence. The ease of communication via the internet has greatly facilitated the ability of large numbers of researchers at distant locations to colloborate on and contribute to large projects (Frogel 2010). Unfortunately, our once favoured metrics are now something of a reflection of a team’s collective performance rather than that of an individuals contribution and performance.
Spruit (2012) additionally showed that author-normalised citations and author-normalised -indices are also related by equation 1, and that the outliers in the –(total citation) diagram are removed when one uses metrics which have been normalised by the number of contributing authors. While we did not collect the data to test it, one may speculate if such a modified -index derived from author-normalised citations rather than total citations (e.g. Batista et al. 2006) may provide a useful index. It could be referred to as one’s -index, with the letter both following alphabetically after the letter and better referring to an “individual” performance. Although, we note that while the validity of the -index may now be questioned in the new era of large research teams, the -index may also have its problems, in particular for those who chose to only work in large research teams. Therefore, a number of objective, normalised metrics, rather than solely one, seems likely to persist. As argued by Panaretos & Malesios (2009), these should also be used in combination with other criteria such as memberships on editorial boards, awards, invitations or peer reviews when assessing the quality of individual researchers.

Acknowledgments
The first four authors undertook this research / survey as Year 10 work experience students at the Swinburne University of Technology. The ‘Astronomers’ were identified, and the data was collected, during 2011 December 6–9 (AP, JT, AZ). This was checked, and slightly expanded upon, from 2011 December 12–16 (KHK). The text, figures and equations 2 and 3 were provided by AWG, with useful comments from Duncan A. Forbes and Matthew Colless, and helpful links to Scientometrics articles kindly provided by Rebecca Parker. This work was conducted under the supervision of Duncan A. Forbes and AWG. AWG is supported by the Australian Research Council through a Future Fellowship (project FT110100263). The views expressed herein are those of the authors and are not necessarily those of the Australian Research Council. This research has made use of the SAO/NASA Astrophysics Data System.
References
- [1] Abt, H.A. 1984, PASP, 96, 746
- [2] Abt, H.A. 1985, PASP, 97, 1050
- [3] Abt, H.A. 2003, Astrophysics and Space Science Library, 287, 55
- [4] Abt, H.A. 2006, Bulletin of the American Astronomical Society, 38, 1057
- [5] Abt, H.A. 2012, Scientometrics, online first: http://dx.doi.org/10.1007/s11192-011-0525-4
- [6] Adelman-McCarthy, J.K., Agüeros, M.A., Allam, S.S., et al. 2008, ApJS, 175, 297
- [7] Adler, R., Ewing, J., Taylor, P. 2008, Citation Statistics. Joint IMU/ICIAM/IMS-Committee on Quantitative Assessment of Research (http://www.mathunion.org/fileadmin/IMU /Report/CitationStatistics.pdf).
- [8] Asplund, M., Grevesse, N., Sauval, A.J. 2005, Cosmic Abundances as Records of Stellar Evolution and Nucleosynthesis, 336, 25
- [9] Asplund, M., Grevesse, N., Sauval, A.J., Scott, P. 2009, ARA&A, 47, 481
- [10] Bains, I., Breen, S.L., Burton, M.G., et al. 2009, PASA, 26, 110
- [11] Balaban, A.T. 2012, Scientometrics, online first: http://dx.doi.org/10.1007/s11192-012-0637-5
- [12] Barnes, D.G., Staveley-Smith, L., de Blok, W.J.G., et al. 2001, MNRAS, 322, 486
- [13] Batista, P.D., Campiteli, M.G., Kinouchi, O. 2006, Scientometrics, 68, 179
- [14] Blake, C., Brough, S., Couch, W., et al. 2008, Astronomy and Geophysics, 49, 5.19
- [15] Bornmann, L., Daniel, H.-D. 2007, Journal of the American Society for Information Science and Technology, 58, 1381
- [16] Burstein, D. 2000, BAAS, 32, 917
- [17] Colless, M., Dalton, G., Maddox, S., et al. 2001, MNRAS, 328, 1039
- [18] Conti, A., Lowe, S., Accomazzi, A., DiMilia, G. 2011, AAS, 217, #145.01 (http://dl.dropbox.com/u/473509/Astro-HR.pdf)
- [19] Croton, D.J., Springel, V., White, S.D.M., et al. 2006, MNRAS, 365, 11
- [20] Drinkwater, M., Pimbblet, K., Jurek, R., et al. 2006, AAO Newsletter, 110, 3
- [21] Driver, S.P., et al. 2008, AAO Newsletter, 114, 3
- [22] Egberts, K., et al. 2008, Advances in Space Research, 41, 477
- [23] Egghe, L. 2006, Scientometrics, 69, 121–129
- [24] Frogel, J.A. 2010, Pub. Astron. Soc. Pacific, Volume 122, issue 896, p.1214
- [25] Garfield, E. 1972a, Science, 178, 471
- [26] Garfield, E. 1972b, Current Contents, 10(25), 3
- [27] Grothkopf, U., Melo, C., Erdmann, C., Kaufer, A., Leibundgut, B. 2007, The Messenger, 128, 62
- [28] Hirsch, J.E. 2005, PNAS, 102, 16569
- [29] Jin, B., Liang, L., Rousseau, R., Egghe, L. 2007, Chinese Science Bulletin, 52(6), 855
- [30] Meho, L.I. 2007, Physics World, 29(1), 32
- [31] Moed, H., van Leeuwen, T. 1996, Nature, 381, 186
- [32] Panaretos, J., Malesios, C. 2009, Scientometrics, 81(3), 635
- [33] Pearce, F. 2004, Astronomy and Geophysics, 45, 15
- [34] Peterson, C.J. 1987, JRASC, 81, 30
- [35] Pimbblet, K.A. 2011, PASA, 28, 140
- [36] Rao, A.R., Vahia, M.N. 1986, PASP, 98, 511
- [37] Robertson, P., Cozens, G., Orchiston, W., Slee, B., Wendt, H. 2010, PASA, 27, 402
- [38] Robotham, A., Driver, S.P., Norberg, P., et al. 2010, PASA, 27, 76
- [39] Sánchez, S.F., Benn, C.R. 2004, Astronomische Nachrichten, 325, 445
- [40] Spruit, H.C. 2012 (arXiv:1201.5476)
- [41] Trimble, V. 1995, PASP, 107, 977
- [42] Waite, I.A., Marsden, S.C., Carter, B.D., Alécian, E., Brown, C., Burton, D., Hart, R. 2011, PASA, 28, 323
- [43] Wouters, P. 1999, The Citation Culture, Doctoral thesis, The Royal Netherlands Academy of Arts and Sciences, Amsterdam
5 Appendix: Tables
| # | Author | count | (career) |
|---|---|---|---|
| 1 | Karl Glazebrook | 59 | (74) |
| 2 | Gavin Rowell | 51 | (54) |
| 3 | Bruce Peterson | 49 | (76) |
| =4 | Joss Bland-Hawthorn∗ | 48 | (60) |
| =4 | Matthew Colless | 48 | (59) |
| =4 | Warrick Couch | 48 | (64) |
| =4 | Simon Driver | 48 | (53) |
| =4 | Ken Freeman | 48 | (80) |
| 5 | Richard Manchester | 45 | (72) |
| =6 | Bryan Gaensler | 41 | (46) |
| =6 | Carole Jackson | 41 | (43) |
| =7 | Russell Cannon | 40 | (52) |
| =7 | Geraint Lewis | 40 | (45) |
| =7 | Brian Schmidt | 40 | (54) |
| =8 | Martin Asplund | 36 | (42) |
| =8 | David McClelland | 36 | (38) |
| =8 | John Norris | 36 | (61) |
| =9 | Michael Drinkwater | 35 | (41) |
| =9 | Alister Graham | 35 | (36) |
| =9 | Gerhardt Meurer | 35 | (43) |
| =9 | Lister Staveley-Smith | 35 | (46) |
| =9 | Chris Tinney | 35 | (44) |
| =10 | Duncan Forbes | 34 | (45) |
| =10 | Chris Lidman | 34 | (43) |
Twenty-four names make up the top-10 ranking of
384 Australian astronomers according to
Hirsch -indices from publications in 2001–2010.
The equals symbol ‘=’ is used here to help
designate equally-ranked astronomers.
All authors listed here have been publishing since the start
of the decade in question, while Cannon and
Peterson retired but kept publishing (which may have helped or hindered
their productivity).
The “career” -indices were computed on January 31, at the request of the
referee, to provide a helpful frame of reference.
∗The career -index for J. Bland-Hawthorn also includes early works published as J. Bland.
| # | Author | count |
|---|---|---|
| 1 | Martin Asplund | 1931 |
| 2 | Alister Graham | 1237 |
| 3 | Stuart Wyithe | 1183 |
| 4 | Karl Glazebrook | 1097 |
| 5 | Joss Bland Hawthorn | 1067 |
| 6 | Ken Freeman | 1013 |
| 7 | Richard Manchester | 978 |
| 8 | Bryan Gaensler | 970 |
| 9 | Geraint Lewis | 964 |
| 10 | Andrew Hopkins | 936 |
| 11 | Duncan Forbes | 841 |
| 12 | Kenji Bekki | 839 |
| 13 | Holger Baumgardt | 789 |
| 14 | Warrick Couch | 757 |
| 15 | Michael Dopita | 736 |
| 16 | John Norris | 705 |
| 17 | Simon Driver | 692 |
| 18 | Michael Murphy | 596 |
| 19 | Darren Croton | 563 |
| 20 | Yuri Levin | 530 |
Author-normalised citations from publications in 2001–2010. The total
citation count of each article is divided by the number of contributing
authors.
| # | Author | count |
|---|---|---|
| 1 | Martin Asplund | 3015 |
| 2 | Holger Baumgardt | 1948 |
| 3 | Stuart Wyithe | 1911 |
| 4 | Alister Graham | 1712 |
| 5 | Kenji Bekki | 1693 |
| 6 | Darren Croton | 1567 |
| 7 | Andrew Hopkins | 1387 |
| 8 | Michael Murphy | 1296 |
| 9 | Bryan Gaensler | 1278 |
| 10 | Matthew Colless | 1109 |
| 11 | Scott Croom | 1011 |
| 12 | Richard Manchester | 994 |
| 13 | Gerhardt Meurer | 991 |
| 14 | Chris Blake | 803 |
| 15 | George Hobbs | 793 |
| 16 | Duncan Galloway | 755 |
| 17 | Jarrod Hurley | 694 |
| 18 | Daniel Price | 669 |
| 19 | Tim Bedding | 650 |
| 20 | David Yong | 618 |
| # | Author | count |
|---|---|---|
| 1 | Martin Asplund | 566 |
| 2 | Darren Croton | 468 |
| 3 | Alister Graham | 439 |
| 4 | Stuart Wyithe | 404 |
| 5 | Andrew Hopkins | 402 |
| 6 | Daniel Price | 363 |
| 7 | Bryan Gaensler | 342 |
| 8 | Holger Baumgardt | 339 |
| 9 | Richard Manchester | 308 |
| 10 | Kenji Bekki | 308 |
| 11 | Yuri Levin | 298 |
| 12 | Geraint Lewis | 276 |
| 13 | John Norris | 250 |
| 14 | Duncan Forbes | 235 |
| 15 | John Lattanzio | 229 |
| 16 | Karl Glazebrook | 219 |
| 17 | Michael Murphy | 218 |
| 18 | Quentin Parker | 216 |
| 19 | Jill Rathborne | 206 |
| 20 | Ken Freeman | 201 |
| # | Author | count |
|---|---|---|
| 1 | Darren Croton | 1311 |
| 2 | Martin Asplund | 845 |
| 3 | Holger Baumgardt | 709 |
| 4 | Andrew Hopkins | 563 |
| 5 | Alister Graham | 502 |
| 6 | Kenji Bekki | 482 |
| 7 | Daniel Price | 478 |
| 8 | Daniel Zucker | 409 |
| 9 | Tamara Davis | 363 |
| 10 | James Bolton | 334 |
| 11 | Stuart Wyithe | 329 |
| 12 | Jill Rathborne | 329 |
| 13 | Michael Brown | 323 |
| 14 | Bryan Gaensler | 322 |
| 15 | Michael Murphy | 322 |
| 16 | Amanda Karakas | 321 |
| 17 | Simon Driver | 318 |
| 18 | Richard Hunstead | 315 |
| 19 | Duncan Galloway | 311 |
| 20 | David Yong | 290 |