Optical and
near-infrared spectroscopy of the black hole GX 3394
I. A focus on the continuum in the low/hard and
high/soft states ††thanks: Based on observations
performed with European Southern Observatory (ESO) Telescopes at the
Paranal Observatory under programmes ID 284.D-5056 and 285.D-5007
Abstract
The microquasar GX 3394, known to exhibit powerful compact jets that dominate its radio to near-infrared emission, entered an outburst in 2010 for the fifth time in about fifteen years. An extensive radio to X-ray multi-wavelength campaign was immediately triggered, and we report here on ESO/FORS2+ISAAC optical and near-infrared spectroscopic observations, supported by ATCA radio and RXTE/Swift X-ray quasi-simultaneous data. GX 3394 was observed at three different epochs, once in the soft state and twice in the hard state. In the soft state, the optical and near-infrared continuum is largely consistent with the Raleigh-Jeans tail of a thermal process. As an explanation, we favour irradiation of the outer accretion disc by its inner regions, enhanced by disc warping. An excess is also present at low frequencies, likely due to a M subgiant companion star. During the first hard state, the optical/near-infrared continuum is well-described by the optically thin synchrotron emission of the compact jet combined with disc irradiation and perhaps another component peaking in the ultraviolet. The spectral break where the jet transits from the optically thick to thin regimes, located below Hz, is not detected and the extension of the optically thin synchrotron is consistent with the 3–50 keV spectrum. In contrast, the emission during the second hard state is more difficult to understand and points toward a more complex jet continuum. In both cases, the near-infrared continuum is found to be variable at timescales at least as short as 20 s, although these variabilities are smoothed out beyond a few hundred seconds. This implies rapid variations – in flux and frequency – of the location of the spectral break, i.e. dramatic short timescale changes of the physical conditions at the base of the jet, such as the magnetic field and/or the base radius.
keywords:
binaries: close X-rays: binaries Infrared: stars accretion, accretion discs Stars: individual: GX 3394 ISM: jets and outflows1 Introduction
| Obs. # | FORS2 | ISAAC | RXTE | Swift | ATCA | ATCA flux density | |
|---|---|---|---|---|---|---|---|
| 5.5 GHz | 9.0 GHz | ||||||
| 1 | 55261.39 | 55261.37 | 55261.19 | 55261.05 | 55261.89 | 9.020.10 | 9.600.05 |
| 2 | 55262.39 | 55262.38 | 55262.93 | – | 55262.91 | 8.240.05 | 8.050.10 |
| 3 | 55307.29 | 55307.24 | 55307.02 | – | |||
While microquasars radiate over the whole electromagnetic spectrum, the optical and near-infrared (near-IR) domains are of strong interest. Indeed, most of the components in the system can be detected at these wavelengths, including the companion star, the accretion disc, and material ejecta. In the last category, the best known are the so-called compact jets, which are only detected in the hard state (HS) and emit both through optically thick and thin synchrotron radiation. Within the most accepted scheme (Blandford & Konigl, 1979; Falcke & Biermann, 1995), their emission is well-modelled by a flat or weakly-inverted power law (optically thick regime, with ) from the radio to some spectral break, beyond which ranges between and depending on the electron energy distribution (optically thin regime). The location of the break, thought to occur in the IR domain, is a crucial piece of information as it is closely related to the physical conditions at the base of the jet, such as the magnetic field, the base radius of the jet, and the total energy of the electron population. So far, it has only been detected in three sources, GX 3394, 4U 0614+091, and Cygnus X1 (Corbel & Fender, 2002; Gandhi et al., 2011; Migliari et al., 2006; Migliari et al., 2010; Rahoui et al., 2011), with additional observational evidence that this break can move with luminosity (Coriat et al., 2009; Rahoui et al., 2011; Gandhi et al., 2011; Russell et al., 2011).
If a broken power law is a good approximation of a compact jet, this very simple modelling is also plagued with severe limitations. First, it is doubtful that the jet can sustain a single power law-like spectrum from the radio to the spectral break, and a change of the optically thick spectral index is expected. Moreover, their emission could simply be more complicated than a broken power law, in particular when cooling is taken into account (Pe’er & Casella, 2009). Finally, compact jets could contribute to the optical/near-IR (OIR) through other processes such as pre-shock synchrotron, which would enhance significantly their emission at these wavelengths (see e.g. Markoff et al., 2005). OIR spectroscopic observations of microquasars are therefore crucial for correctly constraining the properties of compact jets; GX 3394 is obviously one of the best targets to fulfil this goal as the jets strongly dominate the OIR emission in the HS (see e.g. Buxton & Bailyn, 2004; Homan et al., 2005).
In early 2010, GX 3394 entered an outburst, only the fifth time in fifteen years. Considering the rarity of such an event, we triggered a large multi-wavelength observational campaign of the source, which included X-ray (INTEGRAL, RXTE, Swift), OIR (ESO, Faulkes), and radio (ATCA). Here, we report on the OIR spectroscopy of the source in the HS and soft state (SS), focusing on the spectral continuum in the presence and absence of compact jets. A companion paper (Cadolle Bel et al., 2011) presents an overview of this multi-wavelength campaign, with a particular focus on X-ray behaviour. Finally, a detailed study of the spectroscopic content of the OIR spectra will be object of a third paper (Rahoui et al., in prep). Sect. 2 is devoted to the data reduction and analysis. In Sect. 3, we present spectral energy distribution (SED) modelling. We discuss the outcomes in Sect. 4 and conclude in Sect. 5.
2 Observations and data reduction
GX 3394 was observed through low-resolution spectroscopy on 2010 March 6 (hereafter Obs. 1), March 7 (Obs. 2), and April 21 (Obs. 3) quasi-simultaneously in the optical with ESO/FORS2 and in the near-IR with ESO/ISAAC, mounted on the VLT/UT2 and UT3, respectively (PI F. Rahoui). In the framework of the Galactic bulge monitoring, the source was also quasi-simultaneously observed with the Rossi X-ray Timing Experiment (RXTE, the data are immediately public). Moreover, the Swift satellite also observed the field of GX 3394 on a regular basis during the 2010 outburst, and one of these pointed observations (Obs. ID 00030943010, P.I. M. Cadolle Bel) was conducted quasi-simultaneously to Obs. 1. Finally, GX 3394 was detected in the radio domain during Obs. 1 and 2 with the Australia Telescope Compact Array (ATCA, P.I. S. Corbel) at 5.5 and 9.0 GHz. All these observations are listed in Table 1.
2.1 Near-IR ESO/ISAAC observations
| Obs. # | – | (dof) | |||||||
|---|---|---|---|---|---|---|---|---|---|
| – | () | (keV) | (keV) | (keV) | – | – | – | ||
| 1 | – | 1.06 (651) | |||||||
| 2 | 0.58 (fixed) | – | 0.95 (74) | ||||||
| 3 | 0.58 (fixed) | - | 1.03 (73) |
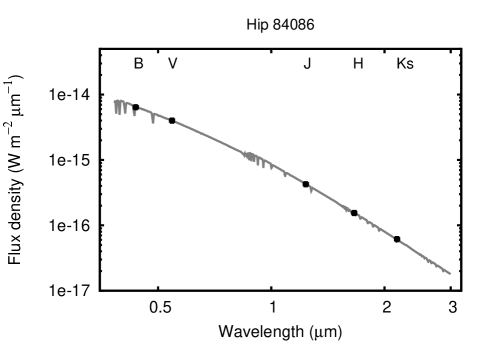
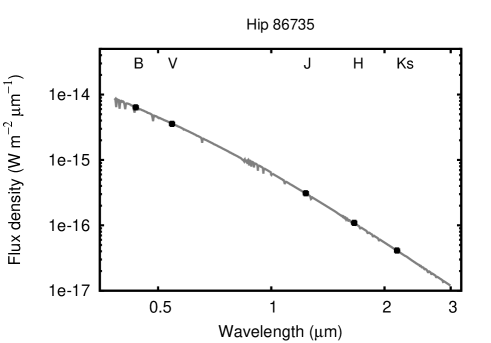
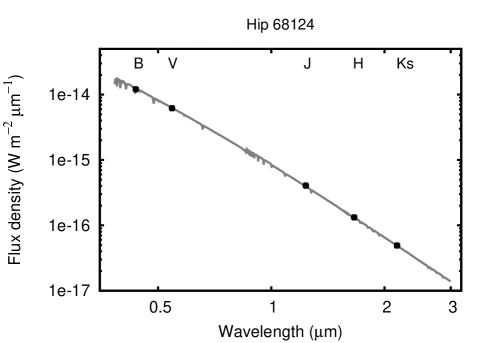
GX 3394 was observed through the SWLR1 arm (1″slit aperture) with the J, H, and K filters ( and 1.102.5 m spectral coverage). The sky was clear, and the airmass and seeing at corresponding central wavelengths were lower than 1.2 and 075, respectively. The total exposure time in each filter was 240 s, divided in s dithered frames for standard ABBA sky removal. The same nights, the telluric standard stars HIP 84086 (B8/9V, March 6 2010), HIP 86735 (B5/6III, March 7 2010), and HIP 68124 (B2/3V, April 21 2010), were observed under the same conditions.
We reduced all the data with IRAF111IRAF is distributed by the National Optical Astronomy Observatories, which are operated by the Association of Universities for Research in Astronomy, Inc., under cooperative agreement with the National Science Foundation. by performing correction for crosstalk and bad pixels, flatfielding, and sky subtraction. The spectra were then extracted, wavelength-calibrated by matching the spectral dispersion axis with that of an ArXe arc, and the atmospheric signatures were corrected with the telluric task. This routine aligns the source’s and standard star’s spectra and scale them according to their respective airmass; they are then divided to remove the telluric features and atmospheric extinction. The output, once corrected for the exposure time discrepancies between the source and the standard star observations, can therefore be multiplied by the flux-calibrated standard star’s spectrum to obtain that of the source. Unfortunately, very few spectro-photometric standard stars exist in the near-IR, and none of them was observed during our program. The way we proceeded to flux-calibrate the GX 3394’s ISAAC spectra therefore deserves some detailed explanations.
We started from three synthetic Kurucz spectra corresponding to the HIP 84086, HIP 86735, and HIP 68124 spectral types. They were then reddened, convolved by Cousins-Bessel and 2MASS filters, and scaled to match, through fitting, the measured B, V, J, H, and K flux densities of our three standard stars (see Figure 7). The initial value of the optical extinction along their line-of-sight (LOS) were obtained from their colour indices using the standard relation with (corresponding to the diffuse ISM) and . The intrinsic colours were taken from Cramer (1984) for the corresponding spectral types, and we made use of the extinction law given in Fitzpatrick (1999) to get the values at other wavelengths. Once flux-calibrated, the standard stars’ synthetic spectra were multiplied by the telluric outputs to get the final GX 3394’s flux-calibrated spectra. It is worth mentioning that the ESO/REM J, H, and K photometric observations quasi-simultaneous with Obs. 1 (Cadolle Bel et al., 2011), are consistent, with less than 5% discrepancies, with our result. Therefore, in our analysis, we adopt an intrinsic 5% uncertainty for the flux-calibration.
2.2 Optical ESO/FORS2 observations
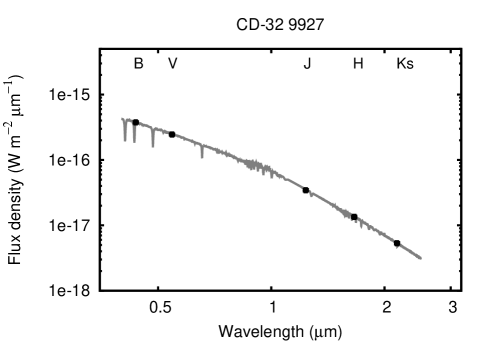
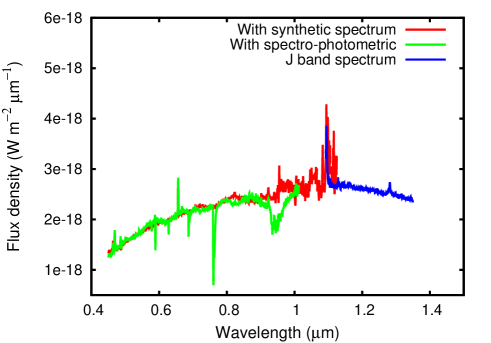
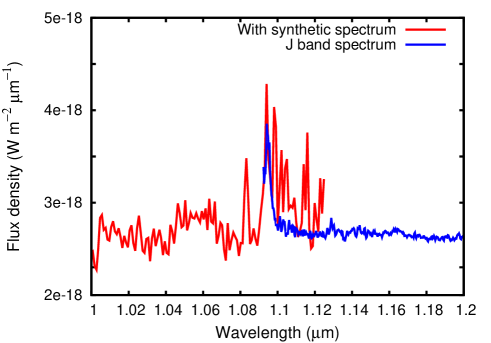
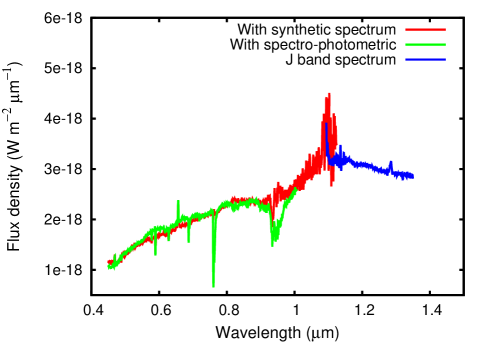
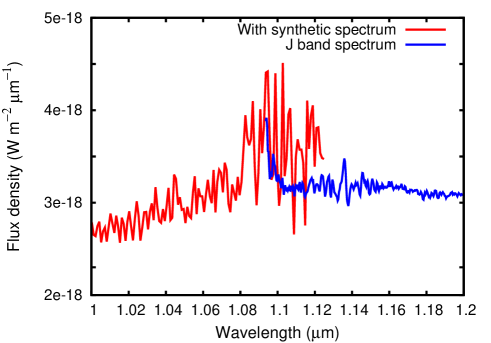
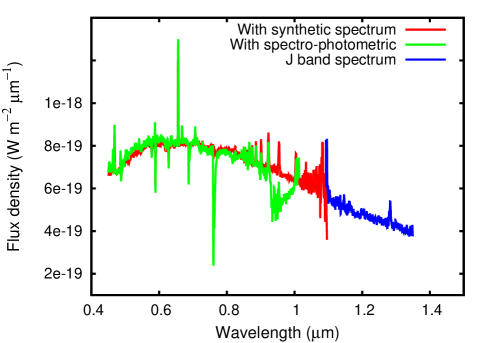
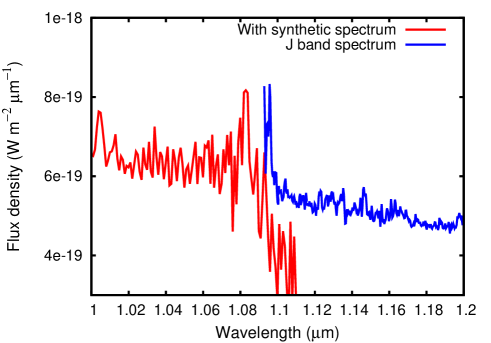
We used the 300V and 300I grisms (1″ aperture) with the GG435 and OG590 filters, respectively. The exposure time was set to 120 s in each filter, and the atmospheric conditions were good, with a clear sky and airmass and seeing lower than 1.14 and 07, respectively. For flux calibration purposes, the ESO spectro-photometric standard stars Hiltner 600 (B3V) and CD32 9927 (A0V) were observed under the same conditions. We reduced the data using the IRAF suite. The process consisted of bad pixels correction, bias subtraction, flatfielding, spectral extraction, and wavelength calibration by matching the spectral dispersion axis with that of an HeAr arc lamp. The resulting GX 3394 1D spectra were then flux-calibrated using the CTIO extinction and flux tables222ctioextinct.dat, h600.dat, and cd32.dat available with IRAF. The flux levels in the overlapping region of the GG435 and OG590 filters appear consistent, with discrepancies less than 5%, which allowed us to safely combine them. However, the strong limitation of this method is that the resulting optical spectra do not overlap with the near-IR ones because the ESO spectro-photometric standard stars are not defined beyond 1.02 m. To cover the gap between the optical and near-IR, we also reduced and flux-calibrated the FORS2 spectra with the same procedure as that used for the ISAAC data (see Figure 8, for the flux-calibrated synthetic Kurucz spectra). This gives very similar results, as showed in Figure 9 (left panel). The optical spectra flux-calibrated with the ESO spectro-photometric standards are displayed in green, those flux-calibrated with synthetic spectra in red. We also display the J band spectra in blue, and a good match between the optical and near-IR continuum levels is reached (right panel). Note that the displayed red spectra were rebinned to a third of their resolution to improve the visibility of the optical/J overlapping region. However, only the original ones were used for SED fitting.
2.3 RXTE and Swift observations
We present here the reduction and analysis of the high-energy data we made use of. We use this only for the determination of the spectral state of GX 3394 during the FORS2+ISAAC observations, as well as the level of emission from the main components, i.e. the accretion disc and the corona/jet. A far more comprehensive X-ray study of GX 3394 during the 2010 outburst is presented in Cadolle Bel et al. (2011).
2.3.1 Data reduction
| HS1 | ||
 |
 |
 |
| HS2 | ||
 |
 |
 |
| SS1 | ||
 |
 |
 |
The RXTE data were reduced using the HEASOFT v. 6.11 software package, following the standard procedure described in the RXTE cookbook333http://heasarc.gsfc.nasa.gov/docs/xte/data_analysis.html. Spectra were extracted from the Proportional Counter Array (PCA; Jahoda et al., 2006), in the 3–50 keV range. We only used the top layer of the Proportional Counter Unit (PCU) 2 as it is the best-calibrated detector out of the five PCUs. Systematic errors of 0.5 per cent were added to all channels.
We reduced the data from the X-ray telescope (XRT) on board Swift with the xrtpipeline v. 0.12.6 using standard quality cuts and event grades 0D2. The data were collected in windowed timing (WT) mode to avoid pile-up. We used xselect v. 2.4 to extract source and background spectra using square boxes as extraction region, in the range 0.5–10 keV. The boxes have a size of 40 pixels along the only spatial dimension available in WT mode. We generated the ancillary response file (ARF) with xrtmkarf and used the latest version (v. 012) of the response matrices provided by the Swift team. We finally rebinned the spectrum to get a minimum of 20 counts per channel.
2.3.2 Spectral state classification
To identify the spectral state of GX 3394 during Obs. 1, 2, and 3 we fitted, with XSPEC v. 12.7, the three high-energy spectra with a model combining the contributions from the accretion disc (diskbb, Mitsuda et al., 1984), an iron line around 6.4 keV (Gaussian), as well as a power law, all modified by photoelectric extinction (phabs, abundances and cross-sections from Anders & Grevesse, 1989; Balucinska-Church & McCammon, 1992). When needed, a reflection component reflect was added for an inclination angle fixed to the most recent measured value, (Shidatsu et al., 2011). However, it is worth remembering that several other measurements between 10 and 50∘ exist (see Table 6 in Shidatsu et al., 2011, for a review), but the use of a inclination angle does not change significantly the fits. Moreover, the disc’s contribution during Obs. 2 was too low to be detected with PCA so that diskbb was not used in the modelling. The best-fit parameters are listed in Table 2. The results unambiguously show that GX 3394 is in the HS during Obs. 1 and Obs. 2 (hereafter HS1 and HS2) , and in the SS during Obs. 3 (hereafter SS1).
3 Nature and properties of the OIR emission
We use spectral fitting to understand the origin of the OIR continuum of GX 3394. To that purpose, we built the SEDs for the three observations with all the available data listed in Table 1. The OIR spectra were corrected for ISM extinction along the LOS with the law derived in Fitzpatrick (1999). Among the several consistent values for the optical absorption (see e.g Buxton & Vennes, 2003; Hynes et al., 2004), we adopted (see Gandhi et al., 2011, and reference therein), but it is however worth remembering that it is not well constrained and may be higher (e.g. Zdziarski et al., 1998). In adopting the lower , our subsequent results, especially those related to the disc emission in the optical, should be considered as lower limits. Throughout HS1 and HS2, the source was detected in the radio domain with a relatively flat emission and we therefore expect a strong contribution from the compact jets (Corbel et al., 2003). In contrast, the continuum should be dominated by the accretion disc during SS1.
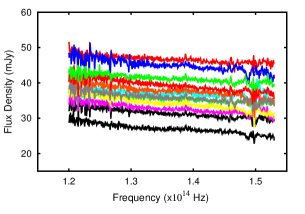
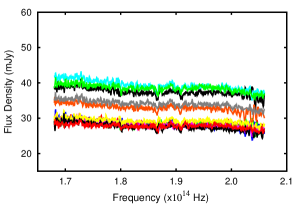
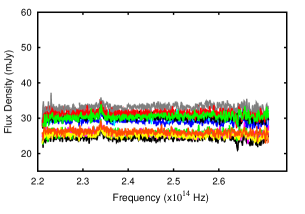
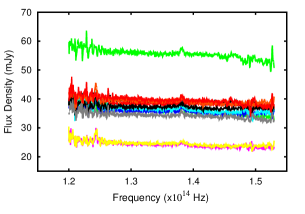
3.1 Near-IR continuum variations at short timescales
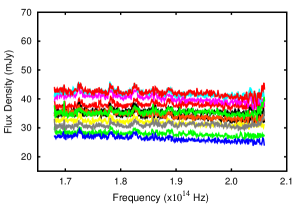
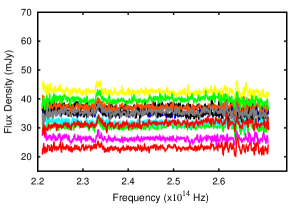
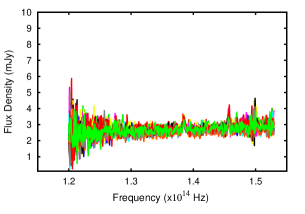
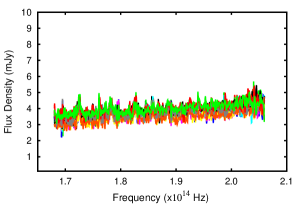
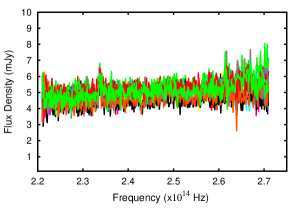
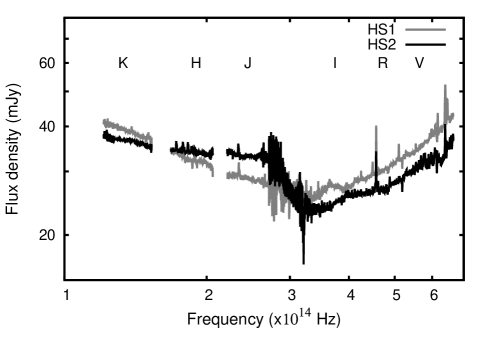
Figure 1 displays, for the three observations and in each near-IR band, the twelve deredenned “sub-spectra” that were all obtained with a good signal-to-noise ratio (S/N). The comparison of their respective continuum may therefore give reliable information about the intrinsic spectral variations of GX 3394 at timescales at least as short as 20 s, both in the HS and SS. However, the optical spectra being the result of one exposure only, their time-dependent behaviour cannot be known.
During SS1, the near-IR emission of GX 3394 is constant in each band over the s exposures. On the contrary, in the HS the emission is strongly variable in all bands on timescales as low as 20 s. While this behaviour is consistent with the near-IR flickering already observed through photometry (Casella et al., 2010), it could also be the result of changing observing conditions, in particular variable slit-losses due to a variable seeing. However, the seeing was always lower than the 1″ slit width, and the flux-calibration we reached during Obs. 1 is consistent within 5% with the ESO/REM photometry (Cadolle Bel et al., 2011); this very likely points towards low slit-losses. Moreover, the atmospheric conditions were each time stable over the whole integration. Indeed, the airmass-corrected seeing at central wavelength, measured by ESO, was clustered in the ranges 062–073, 063–074, and 057–066 during Obs. 1, Obs. 2, and Obs. 3, respectively. When considered per filter, the maximum-to-minimum variations were always lower than 10%, and even 5% during Obs. 1. This by itself does not exclude slit-loss variations, but it is reasonable to assume that their effect is weak. Finally, the fact that the continuum is constant during SS1 and variable during HS1 and HS2 despite similar atmospheric and instrumental conditions strengthens the intrinsic origin of the variations in the HS.
That said, the average maximum-to-minimum flux ratios in J, H, and K are , , and during HS1, as well as , , and during HS2, respectively. Because J precedes H which itself precedes K, it is not relevant to compare the variations in a filter with respect to one another; it is however still possible to compare both hard states. In J and H, the continuum is clearly more variable during HS2. In K, although HS2 exhibits a higher maximum-to-minimum flux ratio, it only stems from three sub-spectra and otherwise. Overall, the variations are therefore bluer in HS2 than in HS1, in agreement with their respective average continuum (see Sect. 3.3 and Figure 5); this likely points towards two different origins.
3.2 The average OIR continuum during SS1
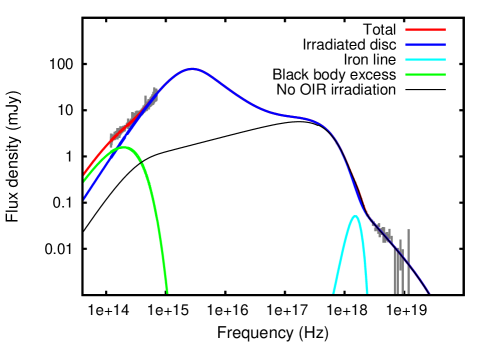
The standard multicolour accretion disc alone is unable to reproduce the OIR spectrum, and a possible explanation is an excess due to X-ray reprocessing within the disc. In order to get a quantitative understanding of this phenomenon, we considered the diskir model (Gierliński et al., 2008, 2009) combined with a Gaussian, to fit the OIR to X-ray SED. Roughly, it is an extension of the diskbb model that includes comptonisation of the blackbody disc’s photons by a corona of hot electrons (based on nthcomp, Zdziarski et al., 1996), as well as disc irradiation, both from the inner region of the disc itself and from the corona. The model has nine parameters: the disc’s temperature and normalisation N (same as diskbb), the photon index of the hard X-rays power law and the temperature of the comptonising photons, the ratio between the corona’s and the disc’s luminosity , the fraction of hard X-ray emission that illuminates the disc , the irradiated radius expressed in terms of the disc inner radius, the fraction of soft X-ray emission which is thermalised in the outer disc , and the logarithm of the outer radius of the disc expressed as a function of the inner radius. The first seven parameters are completely defined by the high-energy data while the two latter are characterised by the OIR ones. We fixed several parameters: (1) the comptonisation temperature was unconstrained and pegged to the upper boundary whatever it was. We fixed it to 250 keV, a value high enough to mimic a power law like hard X-ray spectrum, (2) was fixed to 0.3, well-suited for the SS of microquasars ( 0.1 in the HS, Poutanen et al., 1997; Ibragimov et al., 2005; Gilfanov, 2010) (3) after several unsuccessful attempts, was fixed to 1.1 as it systematically pegged to the lower value (Gierliński et al., 2009). Moreover, this model alone was never able to describe the whole SED due to a near-IR excess. We therefore added a black body for completion, but it is important to note that this excess could have other explanations. The best-fit parameters are listed in Table LABEL:parobs3 and the best-fit SED is displayed in Figure 2. It is clear that accretion disc irradiation dominates the OIR continuum during SS1. Nevertheless, the derived proportion of reprocessed X-rays within the disc, , is very high and at least one order of magnitude larger than previously found in XTE J1817 (Gierliński et al., 2009) and twice the value for GRS 1915+105 (Rahoui et al., 2010). Although we cannot exclude that this is due to an overestimation of the optical extinction, no lower value has ever been confirmed yet. Hynes et al. (2004) derived from the interstellar Na doublet, but acknowledged that it was probably too low because the NaD features were saturated. It is therefore very likely that either another source of thermal emission contributes to the optical spectrum of GX 3394 during SS1, and/or irradiation is enhanced. \ctable[ caption = Best parameters obtained from the fit to the GX 3394 ISAAC+FORS2+PCA SED during SS1. The best-fit model is phabs(diskir+gaussian+bbody). The errorbars are given at the 90% confidence level, label = parobs3, ]cc \tnote[a]Same as diskbb \FL\FLParameters&Best-fit value \ML ()0.58 (fixed)\NN (keV)0.78\NN \NN (keV) (fixed)\NN \NN 0.30 (fixed)\NN \NN () \NN \tmark[a]\NN (keV)5.97 (fixed)\NN (keV)1.33 (fixed)\NN (K)\NN (/kpc)\NN (d.o.f)0.97 (4442)\LL
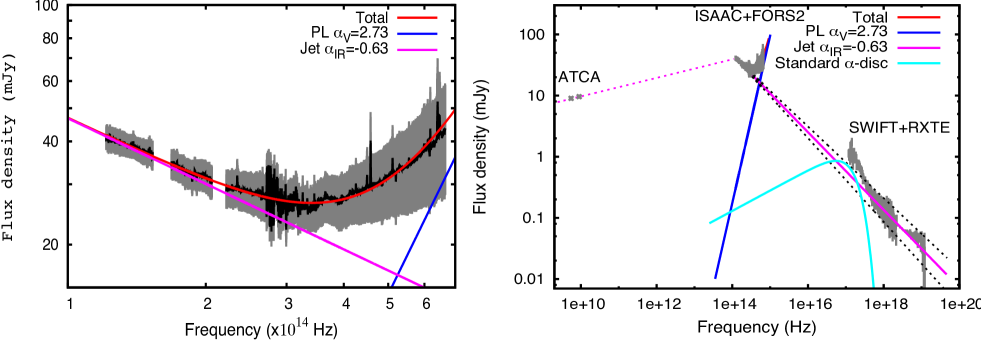
Right: ATCA+ISAAC+FORS2+XRT+PCA SED of GX 3394 during HS1. The jet’s optically thick power law (, magenta dotted-line) is extended to the near-IR. The optically thin emission is roughly consistent, within the 3 uncertainties (black dotted-lines) with the X-ray spectrum beyond about Hz, i.e. 2.5 keV. The accretion disc, derived from the X-ray fitting, is also superimposed.
3.3 The average OIR continuum during HS1
Figure 3 displays the deredenned OIR spectrum of GX 3394 during HS1 (left panel), as well as the radio to X-ray SED (right panel). The OIR spectrum is best-described by two power laws whose spectral indices at a significance are , typical of optically thin synchrotron emission from compact jets, and . Moreover the extension, from the radio domain, of the optically thick emission () matches the near-IR spectrum, in agreement with a spectral break, which we do not detect, located close to Hz (see Gandhi et al., 2011). Likewise, the extension of the jet optically thin emission is consistent with the high energy spectrum beyond about Hz, i.e. 2.5 keV (see right panel, Figure 3). In the optical, the value of is larger than the spectral index expected for the Raleigh-Jeans tail of a thermal emission (), which may mean that besides disc irradiation, another component contributes to the ultraviolet/optical emission of GX 3394 during HS1. Now, this could also be due to an overestimation of the optical extinction and considering the large optical error bars, a good fit is also obtained when is fixed to 2 (Figure 4, left panel). In this case, , still consistent with optically thin synchrotron from the jet, but the extension of the jet power law does not match the X-ray spectrum (Figure 4, right panel). To perform a more quantitative analysis, we used diskir combined with a jet near-IR power law to describe the OIR/X-ray SED, but the best-fit, although statistically good, is rather unphysical. Indeed, the fraction of reprocessed X-rays is found to be between 0.1 and 0.5, and the ratio between the corona’s and disc’s luminosities as well as the temperature of the disc are unconstrained. This either means that the use of diskir is not relevant, or that disc irradiation combined with the optically thin emission of the jet is not sufficient to describe the OIR continuum of GX 3394 during HS1.
3.4 The average OIR continuum during HS2
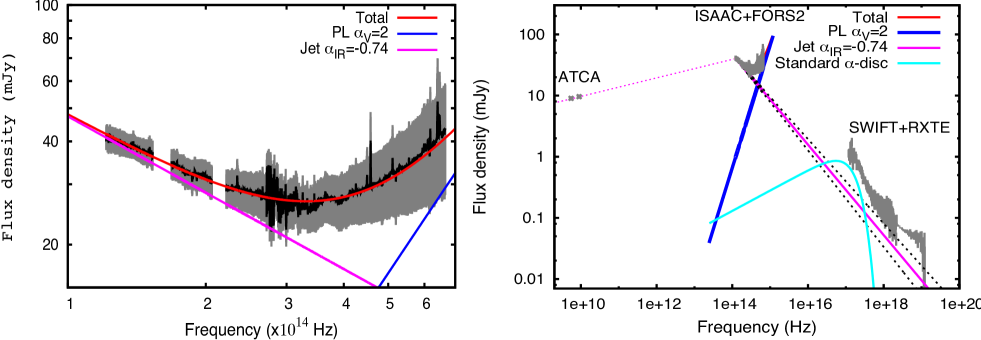
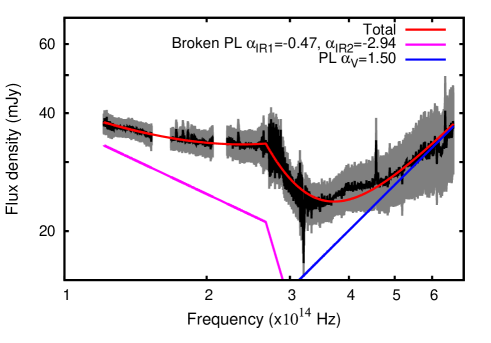
Figure 5, which displays the OIR spectra during HS1 and HS2, shows that the two spectra are very different. First, the HS2 spectrum is clearly flatter in the near-IR, with a continuum lower in K but higher in H and J. Then, the flux drops dramatically and it becomes fainter again from I. We can exclude any calibration issue as the explanation since the level reached in the optical matches very well to that of the J band. Moreover, we are not aware of any FORS2 and/or ISAAC instrumental problem that could have occurred, so that we are forced to conclude that this drop is real, although the phenomenon responsible for such peculiar continuum is difficult to understand. That said, we tested the straightforward explanation, i.e. the detection of the jet’s spectral break, by fitting the spectrum with a model combining a broken and a simple power laws. We obtained a good fit, but the inferred slope ( beyond the break at about Hz) is steeper than expected for optically thin synchrotron (see Figure 6). This either implies a more complicated emission mechanism within the jet scenario and/or another origin for the OIR continuum during HS2.
4 Discussion
In the SS, the OIR continuum can be best described by irradiation of the outer parts of the accretion disc. However, the fit to the data with an irradiated disc model implies a high level of reprocessing, and an excess appears at lower frequencies. In the HS, not only do the near-IR jet-dominated spectra exhibit rapid variations, but at least one other process besides disc irradiation and optically thin synchrotron must be taken into account to explain the spectral continuum.
4.1 GX 3394 in the SS
4.1.1 Enhanced irradiation of the accretion disc
Irradiation of the accretion disc has long been thought to dominate the UV/optical emission of microquasars in the SS (see e.g. Vrtilek et al., 1990; van Paradijs & McClintock, 1994), and this is certainly the case for GX 3394. However, the derived , although poorly constrained due to deredenning uncertainties, is at least twice the value previously measured for GRS 1915+105 (Rahoui et al., 2010). It would even be larger if we considered a higher value for the extinction along the LOS, (e.g. , Zdziarski et al., 1998). We therefore believe that disc irradiation in GX 3394 is enhanced, and two scenarios may be invoked:
-
1.
Pringle (1996) and Maloney et al. (1996) showed how non-axisymmetric radiation forces could induce warping of a flat disc. In such a configuration, the disc’s surface illuminated by the central source would be larger, and the higher the degree of warping, the higher the illumination. It is therefore possible that the high level of X-ray reprocessing observed in GX 3394 is the consequence, at least partially, of a very warped accretion disc irradiated by the inner regions (see e.g. Esin et al., 2000, concerning GS 112468 and A062000).
-
2.
GX 3394’s accretion disc is known to launch winds at large radii (Miller et al., 2004). Part of the X-ray and/or UV emission could therefore be up-scattered by these winds back towards the disc to heat it up locally. This would also enhance the self-irradiation of the disc, and would be added to the effect of warping (see e.g. Dubus et al., 1999).
4.1.2 The presence of a near-IR excess
GX 3394’s emission exhibits a near-IR excess with respect to the irradiated accretion disc emission. Before proceeding further with our interpretation, we acknowledge that it could be due to discrepancies between the unknown spectral continuum of the standard star HIP 68124 and the B2/3V synthetic model we made use of in place to flux-calibrate our data. That said, the excess’s magnitudes in the 2MASS J, H, and Ks filters are , , and , respectively, approximatively similar to the lowest published near-IR magnitudes to date (, , and , Chaty et al., 2002; Buxton & Vennes, 2003). Considering that the source is in the SS, when the radio activity is quenched (Fender et al., 1999), it is reasonable to assume that a compact jet contribution is at best marginal. We rather think that the near-IR excess is due to the secondary and, although a very simple modelling, we believe that the use of a black body is appropriate. The companion star has never been identified, but based on the orbital parameters and lowest magnitudes in the optical bands, it is thought to be a G, K, or M giant or subgiant (Shahbaz et al., 2001; Hynes et al., 2004; Zdziarski et al., 2004; Muñoz-Darias et al., 2008). The temperature K that we derive is consistent with a M star. Moreover, a mass ratio (Muñoz-Darias et al., 2008) and a semi-amplitude km s-1 (Hynes et al., 2004) lead to and (Zdziarski et al., 2004), hence . The value (for a minimum distance kpc, Hynes et al., 2003), not unusual for an M subgiant, is therefore consistent if the inclination , in agreement with previous estimates. This implies and , which again are consistent with the orbital parameters of the system. However, Shahbaz et al. (2001) measured in the off-state, and claimed that the undetected companion star was responsible for 30% of the flux at maximum, which gives . The inferred magnitude of the black body is . While this seems to invalidate the companion star hypothesis, such difference could actually be explained by orbital variability (e.g. 0.4 magnitude in the band, Cowley et al., 2002), companion star irradiation by the accretion disc, and, more importantly, by the discrepancies in the optical between a cool star spectrum and a black body. We therefore believe that this excess is indeed due to a M subgiant companion star, but further near- and mid-IR spectroscopic observations of the source in the off-state are necessary for confirmation.
4.1.3 The HS1 case
There is a strong contribution of the optically thin synchrotron emission of the jet to the OIR continuum. While this emission seems to extend to the X-ray domain, whether or not it means that the jet is responsible for the hard X-ray emission is discussed below. This result is not new and was first given in Corbel & Fender (2002). Nevertheless, the use of spectroscopic OIR data here instead of photometric ones brings better constraints on the continuum, especially in the optical. As already mentioned, accretion disc irradiation as modelled with the diskir model cannot alone explain the level of optical emission, as the derived fraction of reprocessed X-rays is 10–50%, against 5% in the SS. Indeed, de Jong et al. (1996) found that a maximum of a few percent of the incoming photons were absorbed by the accretion disc, and it is hard to believe that disc warping and/or wind up-scattering could increase the fraction to such a level. Moreover, the spectral index of the optical power law may be too high compared to that expected for the Raleigh-Jeans tail of a thermal process, although our data do not allow us to be definitive. We therefore believe that besides irradiation, there must be some other physical, perhaps non-thermal, process to account for the OIR excess in the emission of GX 3394. A self-consistent model including a more complex jet and/or accretion physics is beyond the scope of this paper. Here, we mention two processes that we believe to be the best candidates, at least in the case of GX 3394:
-
1.
the first is pre-shock synchrotron as described in the framework of the jet model presented in Markoff et al. (2005). It corresponds to the emission of a magnetised reservoir of electrons coming from the accretion flow (similar to a corona), that remain in a thermal distribution at the base of the jet before they are accelerated into power laws. This region can produce a significant UV/OIR emission, whose intensity and peak frequency roughly depend on the region’s size and the distance within the jet from where the acceleration starts,
-
2.
the second, recently proposed in Veledina et al. (2011), also involves synchrotron radiation from electrons located in a corona close to the BH. Nonetheless, the population has a non-thermal distribution. This region produces a strong OIR emission, whose intensity and peak frequency mainly depend on its size, and an X-ray/OIR anti-correlation is found. Combined with the time-lagging X-ray/OIR correlation due to X-ray reprocessing within the disc, this model can explain the pattern observed in the optical/X-ray cross-correlation function of GX 3394 (Gandhi et al., 2008).
4.1.4 The HS2 case
4.2 GX 3394 in the HS
We are unsure of the phenomenon responsible for such peculiar continuum. A possible interpretation is that it is due to the same process that might be responsible, in addition to disc irradiation, for the optical excess during HS1. Indeed, we may be witnessing a shift of this component to the lower frequencies, where it peaks in H or J. This would explain the flatter slope of the optical excess, more consistent with disc irradiation. Such shift is predicted for the two processes described in Sect. 4.2.1. For instance, Maitra et al. (2009), using the jet model presented in Markoff et al. (2005), showed how changes in the emitting region’s size and/or the distance from which acceleration starts led to pre-shock synchrotron peaking either in the UV/optical or the near-IR (Figure 4 in their paper). However, another explanation could be a more complex compact jet’s spectral continuum, such as those presented in Pe’er & Casella (2009). In their paper, the authors take adiabatic losses into account, both for power law and Maxwellian distributions. Depending on the value of the magnetic field, they show that this gives a large sample of continuum shapes. In particular, Figures 6, 7, and 8 in their paper, which displays profiles corresponding to a Maxwellian distribution for different magnetic field values, could correspond to the compact jet emission during HS2.
4.2.1 Understanding the rapid near-IR continuum variability
During HS1, the variability must be mainly driven by rapid fluctuations in the compact jet, and it is interesting that this phenomenon has almost no effect on the slope. This is a hint that the optically thin synchrotron emission is rapidly moving upwards or downwards. This may imply rapid changes in the location – in flux and frequency – of the undetected spectral break (Gandhi et al., 2011), i.e. significant variations at timescales at least as low as 20 s of the physical conditions at the base of the jet, such as the magnetic field and/or the base radius. Moreover, the fact that during HS1, the optical, J, H, and K spectra, although non-simultaneous, are all consistent with each other and that the extension of the near-IR jet power law to the high energy domain roughly describes the 3–50 keV RXTE spectrum is surprising. It means that the optical and near-IR sub-second flickering observed in the HS (se e.g. Gandhi et al., 2010; Casella et al., 2010) are smoothed out and that we observe the average behaviour of the compact jet beyond about a few hundred seconds. This is in good agreement with the existence of tight near-IR/X-ray correlations in microquasars in general and GX 3394 in particular (see e.g. Gleissner et al., 2004; Coriat et al., 2009). In any case, in a recent study of Cygnus X1 (Rahoui et al., 2011), we argue that the extension of the optically thin synchrotron emission from the spectral break we detect in the mid-IR to the ray domain matches pretty well to the ten-year averaged polarised emission mentioned in Laurent et al. (2011). In contrast, the contribution of the compact jets to the X-ray spectrum (RXTE/PCA+HEXTE) is found marginal, a hint that it probably comes from a hot corona. In this context, a confirmation of the domination of compact jets in the GX 3394’s X-ray emission could mean that both microquasars belong to two distinct families, perhaps differentiated by the mass-accretion rate level and/or luminosity (Russell et al., 2010; Coriat et al., 2011; Sobolewska et al., 2011).
Considering that we do not clearly understand the origin of the near-IR emission of GX 3394 during HS2, it is difficult to speculate about the observed variations. The continuum is more variable in H and J than during HS1 and, although K exhibits a higher maximum-to-minimum flux ratio, it only stems from three sub-spectra and otherwise. This behaviour could mean that the variations are not driven by the same processes, or that the compact jet contributes more to the H and J bands, in other terms that the spectral break is located in the near-IR. It is also puzzling that the discrepancies observed in the OIR between both HS have no equivalent in the RXTE/PCA spectra. The reason could be that the X-ray data were obtained more than half a day after the OIR ones, i.e. an event could have occurred while GX 3394 was being observed in the OIR before returning to the “normal” during the RXTE observations. But it could also mean that the hard X-ray emission is due to another component, and whatever happens to the jets has no consequence in the high energy domain, at least not at these timescales.
5 Conclusion
We presented a comprehensive multi-wavelength study of GX 3394 in the SS and HS, with a focus on the OIR spectral continuum. We showed that the SS is dominated by enhanced irradiation of the accretion disc, with an additional contribution from a M subgiant companion star. In one of the HS, the OIR emission stems from the compact jet, disc irradiation, and maybe synchrotron from the inner regions. The second HS spectrum exhibits a peculiar continuum which could be a hint of a more complex emission. In both cases, the near-IR spectrum is strongly variable on timescales at least as short as 20 s, which we suggested is a manifestation of rapid variations of the magnetic field and/or nozzle radius. Our results highlight the complexity of the OIR emission of a microquasar like GX 3394, and a good understanding of the source’s behaviour in this spectral domain requires further in-depth spectroscopic observations as well as theoretical modelling. In particular, the use of an instrument allowing simultaneous integrations in the whole OIR range, such as ESO/X-shooter, would be of great help to investigate the variations – at long and short timescales – of the continuum in a more robust way. Finally, this strengthens the need of the James Webb Space Telescope (JWST) for microquasar studies, as the unmatched sensitivity of NIRSpec and MIRI will allow a simultaneous spectroscopic coverage from 1 to 30 m.
Acknowledgments
We thank the anonymous referee for his/her useful comments. FR thanks the ESO staff who performed the service observations. FR and JCL thanks the Harvard Faculty of Arts and Sciences and the Harvard College Observatory. MCB acknowledges support from the Faculty of the European Space Astronomy Centre (ESAC). JAT acknowledges partial support from NASA under Swift Guest Observer grant NNX10AF94G. SC and JR acknowledges partial funding from the European Community’s Seventh Framework Programme (FP7/2007-2013) under grant agreement number ITN 215212 “Black Hole Universe”. DMR acknowledges support from the Netherlands Organisation for Scientific Research (NWO) Veni Fellowship. This research has made use of data obtained from the High Energy Astrophysics Science Archive Research Center (HEASARC), provided by NASA’s Goddard Space Flight Center. The Australia Telescope Compact Array is part of the Australia Telescope which is funded by the Commonwealth of Australia for operation as a National Facility managed by CSIRO. This research has made use of NASA’s Astrophysics Data System, of the SIMBAD, and VizieR databases operated at CDS, Strasbourg, France.
References
- Anders & Grevesse (1989) Anders E., Grevesse N., 1989, GeCoA, 53, 197
- Balucinska-Church & McCammon (1992) Balucinska-Church M., McCammon D., 1992, ApJ, 400, 699
- Blandford & Konigl (1979) Blandford R. D., Konigl A., 1979, ApJ, 232, 34
- Buxton & Vennes (2003) Buxton M., Vennes S., 2003, MNRAS, 342, 105
- Buxton & Bailyn (2004) Buxton M. M., Bailyn C. D., 2004, The Astronomer’s Telegram, 316, 1
- Cadolle Bel et al. (2011) Cadolle Bel M., Rodriguez J., D’Avanzo P., Russell D. M., Tomsick J., Corbel S., Lewis F. W., Rahoui F., Buxton M., Goldoni P., Kuulkers E., 2011, A&A, 534, A119+
- Casella et al. (2010) Casella P., Maccarone T. J., O’Brien K., Fender R. P., Russell D. M., van der Klis M., Pe’Er A., Maitra D., Altamirano D., Belloni T., Kanbach G., Klein-Wolt M., Mason E., Soleri P., Stefanescu A., Wiersema K., Wijnands R., 2010, MNRAS, 404, L21
- Chaty et al. (2002) Chaty S., Mirabel I. F., Goldoni P., Mereghetti S., Duc P.-A., Martí J., Mignani R. P., 2002, MNRAS, 331, 1065
- Corbel & Fender (2002) Corbel S., Fender R. P., 2002, ApJL, 573, L35
- Corbel et al. (2003) Corbel S., Nowak M. A., Fender R. P., Tzioumis A. K., Markoff S., 2003, A&A, 400, 1007
- Coriat et al. (2009) Coriat M., Corbel S., Buxton M. M., Bailyn C. D., Tomsick J. A., Körding E., Kalemci E., 2009, MNRAS, 400, 123
- Coriat et al. (2011) Coriat M., Corbel S., Prat L., Miller-Jones J. C. A., Cseh D., Tzioumis A. K., Brocksopp C., Rodriguez J., Fender R. P., Sivakoff G. R., 2011, MNRAS, 414, 677
- Cowley et al. (2002) Cowley A. P., Schmidtke P. C., Hutchings J. B., Crampton D., 2002, AJ, 123, 1741
- Cramer (1984) Cramer N., 1984, A&A, 132, 283
- de Jong et al. (1996) de Jong J. A., van Paradijs J., Augusteijn T., 1996, A&A, 314, 484
- Dubus et al. (1999) Dubus G., Lasota J.-P., Hameury J.-M., Charles P., 1999, MNRAS, 303, 139
- Esin et al. (2000) Esin A. A., Kuulkers E., McClintock J. E., Narayan R., 2000, ApJ, 532, 1069
- Falcke & Biermann (1995) Falcke H., Biermann P. L., 1995, A&A, 293, 665
- Fender et al. (1999) Fender R., Corbel S., Tzioumis T., McIntyre V., Campbell-Wilson D., Nowak M., Sood R., Hunstead R., Harmon A., Durouchoux P., Heindl W., 1999, ApJL, 519, L165
- Fitzpatrick (1999) Fitzpatrick E. L., 1999, PASP, 111, 63
- Gandhi et al. (2011) Gandhi P., Blain A. W., Russell D. M., Casella P., Malzac J., Corbel S., D’Avanzo P., Lewis F. W., Markoff S., Cadolle Bel M., Goldoni P., Wachter S., Khangulyan D., Mainzer A., 2011, ApJL, 740, L13+
- Gandhi et al. (2010) Gandhi P., Dhillon V. S., Durant M., Fabian A. C., Kubota A., Makishima K., Malzac J., Marsh T. R., Miller J. M., Shahbaz T., Spruit H. C., Casella P., 2010, MNRAS, 407, 2166
- Gandhi et al. (2008) Gandhi P., Makishima K., Durant M., Fabian A. C., Dhillon V. S., Marsh T. R., Miller J. M., Shahbaz T., Spruit H. C., 2008, MNRAS, 390, L29
- Gierliński et al. (2008) Gierliński M., Done C., Page K., 2008, MNRAS, 388, 753
- Gierliński et al. (2009) Gierliński M., Done C., Page K., 2009, MNRAS, 392, 1106
- Gilfanov (2010) Gilfanov M., 2010, in T. Belloni ed., Lecture Notes in Physics, Berlin Springer Verlag Vol. 794 of Lecture Notes in Physics, Berlin Springer Verlag, X-Ray Emission from Black-Hole Binaries. pp 17–+
- Gleissner et al. (2004) Gleissner T., Wilms J., Pooley G. G., Nowak M. A., Pottschmidt K., Markoff S., Heinz S., Klein-Wolt M., Fender R. P., Staubert R., 2004, A&A, 425, 1061
- Homan et al. (2005) Homan J., Buxton M., Markoff S., Bailyn C. D., Nespoli E., Belloni T., 2005, ApJ, 624, 295
- Hynes et al. (2003) Hynes R. I., Steeghs D., Casares J., Charles P. A., O’Brien K., 2003, ApJL, 583, L95
- Hynes et al. (2004) Hynes R. I., Steeghs D., Casares J., Charles P. A., O’Brien K., 2004, ApJ, 609, 317
- Ibragimov et al. (2005) Ibragimov A., Poutanen J., Gilfanov M., Zdziarski A. A., Shrader C. R., 2005, MNRAS, 362, 1435
- Jahoda et al. (2006) Jahoda K., Markwardt C. B., Radeva Y., Rots A. H., Stark M. J., Swank J. H., Strohmayer T. E., Zhang W., 2006, ApJSS, 163, 401
- Laurent et al. (2011) Laurent P., Rodriguez J., Wilms J., Cadolle Bel M., Pottschmidt K., Grinberg V., 2011, Science, 332, 438
- Maitra et al. (2009) Maitra D., Markoff S., Brocksopp C., Noble M., Nowak M., Wilms J., 2009, MNRAS, 398, 1638
- Maloney et al. (1996) Maloney P. R., Begelman M. C., Pringle J. E., 1996, ApJ, 472, 582
- Markoff et al. (2005) Markoff S., Nowak M. A., Wilms J., 2005, ApJ, 635, 1203
- Migliari et al. (2006) Migliari S., Tomsick J. A., Maccarone T. J., Gallo E., Fender R. P., Nelemans G., Russell D. M., 2006, ApJL, 643, L41
- Migliari et al. (2010) Migliari S., Tomsick J. A., Miller-Jones J. C. A., Heinz S., Hynes R. I., Fender R. P., Gallo E., Jonker P. G., Maccarone T. J., 2010, ApJ, 710, 117
- Miller et al. (2004) Miller J. M., Raymond J., Fabian A. C., Homan J., Nowak M. A., Wijnands R., van der Klis M., Belloni T., Tomsick J. A., Smith D. M., Charles P. A., Lewin W. H. G., 2004, ApJ, 601, 450
- Mitsuda et al. (1984) Mitsuda K., Inoue H., Koyama K., Makishima K., Matsuoka M., Ogawara Y., Suzuki K., Tanaka Y., Shibazaki N., Hirano T., 1984, PASJ, 36, 741
- Muñoz-Darias et al. (2008) Muñoz-Darias T., Casares J., Martínez-Pais I. G., 2008, MNRAS, 385, 2205
- Pe’er & Casella (2009) Pe’er A., Casella P., 2009, ApJ, 699, 1919
- Poutanen et al. (1997) Poutanen J., Krolik J. H., Ryde F., 1997, MNRAS, 292, L21
- Pringle (1996) Pringle J. E., 1996, MNRAS, 281, 357
- Rahoui et al. (2010) Rahoui F., Chaty S., Rodriguez J., Fuchs Y., Mirabel I. F., Pooley G. G., 2010, ApJ, 715, 1191
- Rahoui et al. (2011) Rahoui F., Lee J. C., Heinz S., Hines D. C., Pottschmidt K., Wilms J., Grinberg V., 2011, ApJ, 736, 63
- Russell et al. (2011) Russell D. M., Curran P. A., Muñoz-Darias T., Lewis F., Motta S., Stiele H., Belloni T., Miller-Jones J. C. A., Jonker P. G., O’Brien K., Homan J., Casella P., Gandhi P., Soleri P., Markoff S., Maitra D., et al. 2011, MNRAS, in press, arXiv 1109.3654
- Russell et al. (2010) Russell D. M., Maitra D., Dunn R. J. H., Markoff S., 2010, MNRAS, 405, 1759
- Shahbaz et al. (2001) Shahbaz T., Fender R., Charles P. A., 2001, A&A, 376, L17
- Shidatsu et al. (2011) Shidatsu M., Ueda Y., Tazaki F., Yoshikawa T., Nagayama T., Nagata T., Oi N., Yamaoka K., Takahashi H., Kubota A., Cottam J., Remillard R., Negoro H., 2011, PASJ, in press, arXiv 1105.3586
- Sobolewska et al. (2011) Sobolewska M. A., Papadakis I. E., Done C., Malzac J., 2011, MNRAS, 417, 280
- van Paradijs & McClintock (1994) van Paradijs J., McClintock J. E., 1994, A&A, 290, 133
- Veledina et al. (2011) Veledina A., Poutanen J., Vurm I., 2011, ApJL, 737, L17+
- Vrtilek et al. (1990) Vrtilek S. D., Raymond J. C., Garcia M. R., Verbunt F., Hasinger G., Kurster M., 1990, A&A, 235, 162
- Zdziarski et al. (2004) Zdziarski A. A., Gierliński M., Mikołajewska J., Wardziński G., Smith D. M., Harmon B. A., Kitamoto S., 2004, MNRAS, 351, 791
- Zdziarski et al. (1996) Zdziarski A. A., Johnson W. N., Magdziarz P., 1996, MNRAS, 283, 193
- Zdziarski et al. (1998) Zdziarski A. A., Poutanen J., Mikolajewska J., Gierlinski M., Ebisawa K., Johnson W. N., 1998, MNRAS, 301, 435
Appendix A Flux-calibrated synthetic telluric spectra
In the near-IR, the lack of spectro-photometric standard stars implies the use of synthetic spectra for flux-calibration purpose. Figure 7 displays the Kurucz spectra we used in the near-IR, and Figure 8 displays the ones we used in the optical in order to extend the wavelength coverage beyond 1.02 m.
 |
 |
 |
 |
 |
Appendix B Comparison of GX 3394’s optical spectra derived from the two methods
Figure 9 displays a comparison, for each observation, between the optical spectra of GX 3394 obtained using either the ESO spectro-photometric calibration or Kurucz templates (left panel), as well as a zoom-in the optical/J overlapping region (right panel). The use of synthetic spectra is necessary to extend the wavelength coverage and cover the gap with the near-IR.
 |
 |
 |
 |
 |
 |