Investigation of the new cataclysmic variable 1RXS J180834.7+101041
Abstract
We present the results of our photometric and spectroscopic studies of the new eclipsing cataclysmic variable star 1RXS J180834.7+101041. Its spectrum exhibits double-peaked hydrogen and helium emission lines. The Doppler maps constructed from hydrogen lines show a nonuniform distribution of emission in the disk similar to that observed in IP Peg. This suggests that the object can be a cataclysmic variable with tidal density waves in the disk. We have determined the component masses ( and ) and the binary inclination () based on well-known relations between parameters for cataclysmic variable stars. We have modeled the binary light curves and showed that the model of a disk with two spots is capable of explaining the main observed features of the light curves.
1 Introduction
Cataclysmic variables (CVs) are currently believed to be close binary systems at a late evolutionary stage (Warner 1995). As a rule, CVs consist of a more massive white dwarf (WD) (primary) and a less massive red dwarf (secondary). The secondary overfills its Roche lobe, causing mass transfer to the primary. Since the matter accreting onto the WD has a significant angular momentum, it does not fall directly onto it but forms an accretion disk around the WD (at weak WD magnetic fields ). At magnetic fields (intermediate polars), the WD magnetic field destroys the accretion disk at radii smaller than the Alfven radius. Further out, accretion occurs along WD magnetic field lines. At strong WD magnetic fields (polars), the magnetic field prevents the formation of a disk and the matter moves along magnetic field lines from the outset. Whether this binary will be a polar or an intermediate polar depends not only on the WD magnetic field strength but also on the accretion rate and the WD Roche lobe size, i.e., on the binary period and the component mass ratio. Clearly, short-period binaries with a low accretion rate will be polars with a higher probability.
The secondaries of long-period CVs often have radii exceeding appreciably those of single main sequence stars with the same mass (Patterson et al. 2005). This is apparently a consequence of additional heating of the secondary at the common-envelope stage (Schreiber and Gänsicke 2003; Shimanskii et al. 2009). However, the secondaries manage to relax in the time of a fairly long accretion-free evolutionary stage in the 2-3 h period gap and their radii become close to those of single main-sequence stars. This allows the well-known theoretical stellar mass-radius relation to be used, which, in turn, makes it possible to uniquely relate the secondary mass and the binary period (Howell et al. 2001). The red dwarf mass-orbital period relations () derived from observations confirm the theoretical results (Patterson et al. 2005; Knigge 2006).
The accretion disk is currently believed to have a fairly complex structure. A hot spot is formed at the accreting gas stream-accretion disk impact site (for a classical study of the observed properties of the hot spot in quiescence of the dwarf nova Z Cha, see Wood et al. 1986). It is easiest to assume that the hot spot is the matter heated by a shock during the stream-disk impact. However, there are numerical gasdynamic calculations that show that the stream and the accretion disk are a morphologically single structure and their interaction is impactless (see, e.g., the review by Fridman and Bisikalo 2008). In the calculations of this group, an extended shock emerges along the back (relative to the direction of orbital motion) side of the stream where the accretion disk matter collides with it (the so-called ”hot line”).
Another factor breaking the axial symmetry of the accretion disk is the tidal interaction of the secondary. Under certain conditions, it can give rise to spiral density waves in the disk (Boffin 2001), which were first detected in IP Peg from observations (Steeghs et al. 1997; Steeghs 2001; Papadaki 2008). The calculations of the already mentioned group (Fridman and Bisikalo 2008) showed that the tidal effect from the secondary could give rise to a spiral density wave consisting of one arm in the outer and partially inner disk (for a hot accretion disk) or two arms in the outer disk (for a cold disk). For cold accretion disks, hydrodynamic modeling predicts the formation of a precessional density wave in the inner disk that is almost stationary relative to a remote observer. For hot accretion disks, even if the mass transfer rate in the binary changes only slightly, modeling predicts (Bisikalo et al. 2001) the formation of a one-armed density wave in the inner disk that revolves around the WD approximately a factor of 5 faster than does the secondary. This leads to emission variability with a period of .
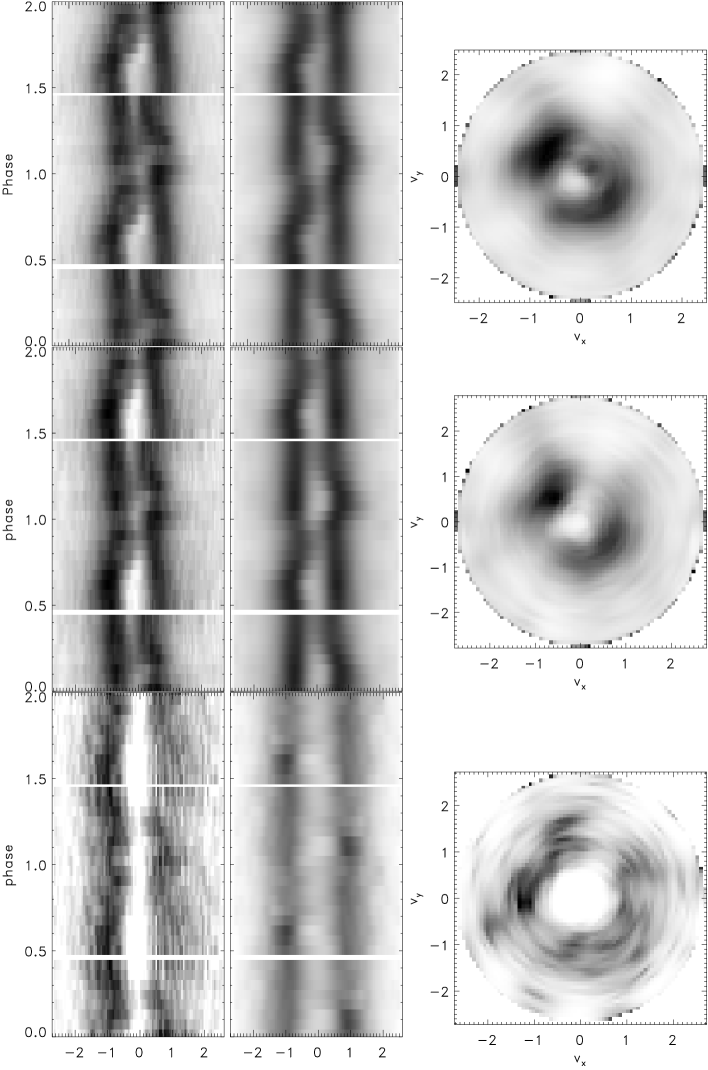
Thus, both observations and gasdynamic calculations suggest a complex structure of the accretion disks; their further studies in CVs are needed for a better understanding of this structure. The best tool for such studies is the method of Doppler tomography proposed by Marsh and Horne (1988). The one-dimensional emission line profiles obtained with a high spectral resolution during one or more complete orbital periods serve as the input data. Using these profiles and knowing the basic parameters of the binary, we can reconstruct the Doppler tomogram, which is a map of the intensity distribution for a given emission line in velocity space I(Vx,Vy). The assumption that a distinctive radial velocity corresponds to the observed intensity at each point of the emission line profile underlies the method. Thus, the line profile at a given orbital phase is considered as a record of the projection of the velocity field for the emitting material onto the line of sight corresponding to this orbital phase. Having a set of such projections (spectral line profiles) for a set of phases covering the entire period, we can reconstruct the intensity distribution map in velocity space and study the spatial distribution of the emitting plasma in terms of the adopted model for the motion of matter (for example, by assuming the matter to rotate in Keplerian orbits in the disk around the white dwarf). Any nonuniformity in the distribution of emission over the disk will be reflected in such a tomogram.
The object 1RXS J180834.7+101041 = USNO-B1 1001-0317189 (, ), 1RXS J1808 for short, was first detected by the ROSAT orbital X-ray observatory as an X-ray source and was then identified as an eclipsing close binary system with an accreting white dwarf (a cataclysmic variable) with a brightness of - (Denisenko et al. 2008). Denisenko et al. (2008) determined the orbital period of the binary (0.d070037(1)) and detected its emission variability with an amplitude of on time scales of several weeks, which gave grounds to classify the binary as a polar. However, a double-peaked structure of the hydrogen and helium emission lines was detected in the binary spectrum (Bikmaev and Sakhibullin 2008). This suggests the existence of an accretion disk around the white dwarf and is in conflict with the nature of polars.
In this paper, we study in detail 1RXS J1808 based on our analysis of new spectrometric and photometric observations. We have investigated the brightness distribution over the accretion disk in several emission lines by Doppler tomography, obtained the parameters of the radial velocity curve, and determined the binary parameters. We have modeled the binary light curves, which allowed the parameters of the bright spots on the accretion disk to be refined.
2 Observations
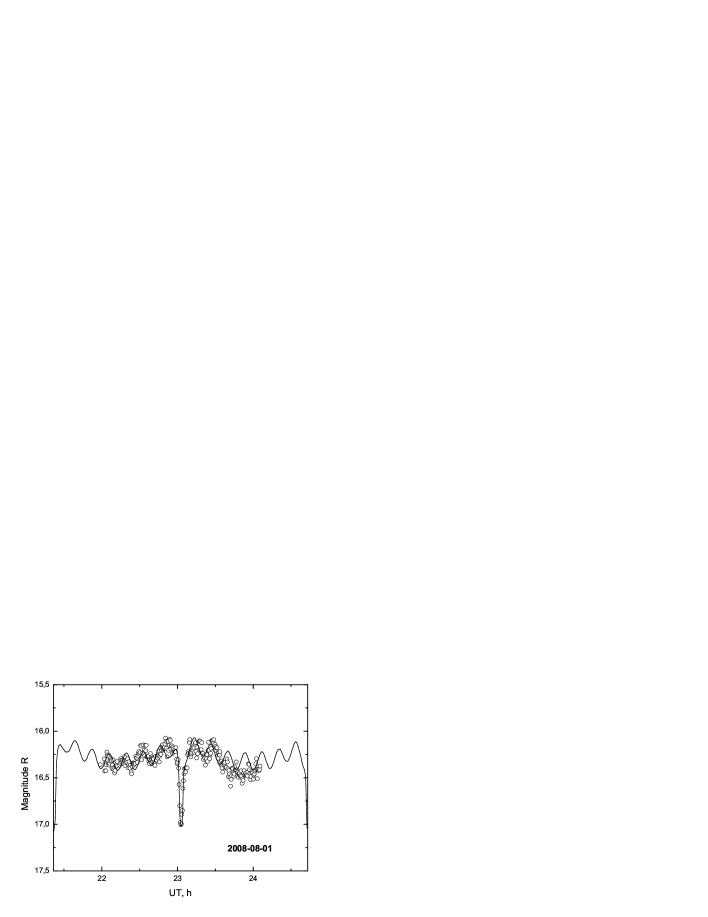
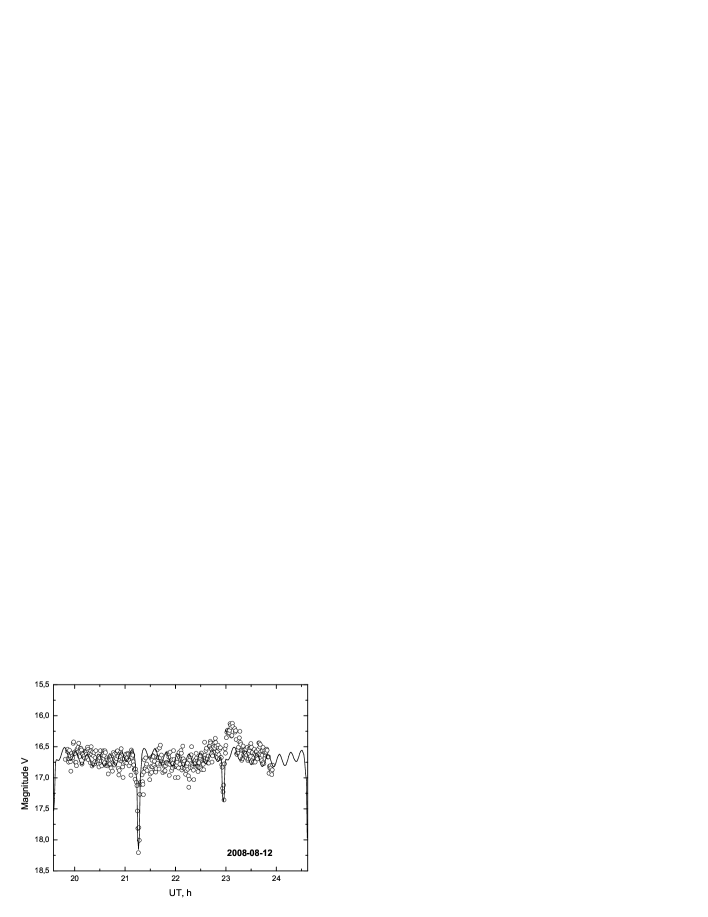
The photometric observations of 1RXS J1808 were performed with the 1.5-m Russian-Turkish telescope RTT-150 at the TUBITAK National Observatory (Turkey). We used a thermoelectrically cooled ANDOR CCD array (DW436, pixels, and a pixel size of m) at a temperature of -60∘C mounted at the Cassegrain focus of the telescope. The observations were carried out on August 1/2, 2008, in the R band with an exposure time of 10 s and on August 12/13, 19/20, and 20/21, 2008, in the V band with exposure times of 15 and 20 s. The total observing time was about 13 h. Landolt’s standard stars were used for the photometric calibration. The light curves are shown in Fig. 1.
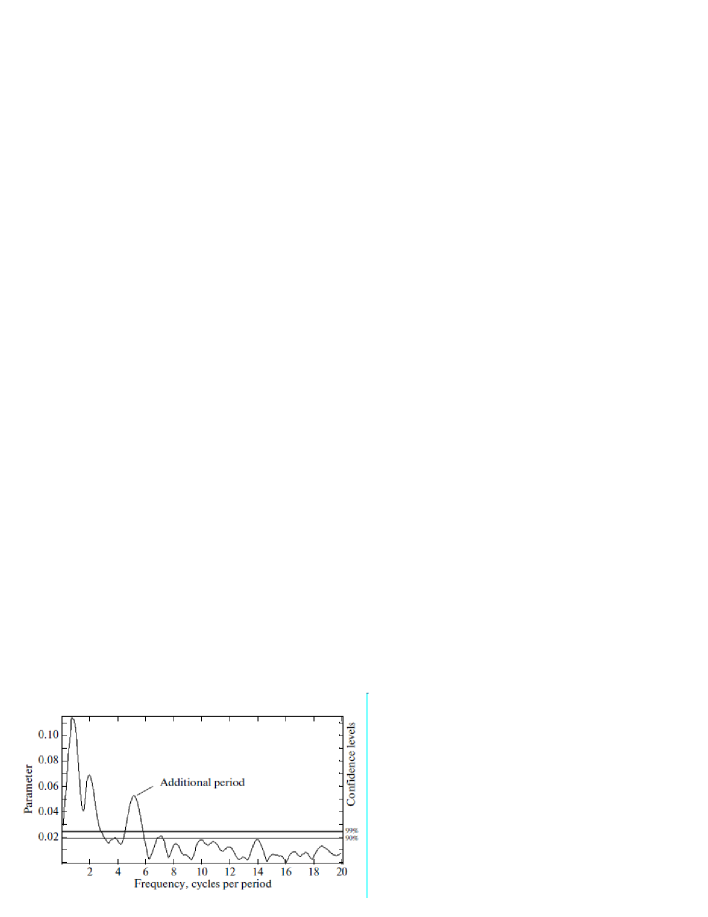
Analysis of the light curves shows that the eclipse depth can differ significantly from eclipse to eclipse (see the light curve for August 12, 2008) and a general irregular change in the binary brightness by 0m.3 – 0m.5 unrelated to eclipses is observed. Some delay in the brightening typical of binaries with an appreciable contribution from the hot spot is noticeable at the brightening phase after an eclipse (see, e.g., Smak 1994). The R-band light curve reveals a quasiperiodicity in the binary brightness variations with a period of 01331 (). This is confirmed by our analysis of the power spectrum (Fig. 2) computed with the EFFECT code (V. Goransky, the Sternberg Astronomical Institute, Moscow). We failed to reveal the corresponding brightness oscillations in the V band light curves because of the lower signal-to-noise ratio in the observational data.


The spectroscopic observations of 1RXS J1808 were performed with the 6-m BTA telescope at the Special Astrophysical Observatory of the Russian Academy of Sciences using the SCORPIO focal reducer in the mode of long-slit spectroscopy (Afanasiev et al. 2004) and an detector ( pixels with a pixel size of m) mounted at the prime focus. The spectra were taken with a VPHG1200g (1200 lines/mm) prism, which provided the spectral resolution Å in the working wavelength range 3950–5700 Å. The observations were carried out on August 9/10, 2008, under good seeing. We took a total of 16 spectrograms with the same exposure time of 300 s. The log of observations is presented in Table 1 and contains data on the times of observations HJD and the orbital phases calculated from the known binary period and the eclipse time on the night from August 1 to August 2. Consequently, the error in the phase is 0.002 phase. The mean signal-to-noise ratio in the spectrograms is –. For the wavelength calibration, we simultaneously took the spectra of an ––-lamp. We reduced the spectrograms according to a standard scheme using the Scorpio2K astronomical data reduction tools in the IDL environment. Examples of the spectra are given in Fig. 3. The Hβ, Hγ, Hδ and HeI, HeII lines are clearly seen in the spectrum. The lines are emission ones and have a double-peaked structure typical of accretion disks. The interpeak minima near the line centers have different depths at different phases. In several lines (for example, in the neutral helium lines and Hϵ), the flux at the interpeak minimum is lower than that in the continuum at some phases. Both these facts suggest the presence of not only emission line components but also absorption ones in the spectrum. The relative height of the Balmer line peaks also changes with orbital phase. The changes near an eclipse are most pronounced. Before phase 0.9, the relative intensity of the blue peak is higher than that of the red one; subsequently, the intensity of the red peak becomes more intense during the eclipse and the flux again becomes higher in the blue peak after the eclipse (phases greater than 0.09).
3 Analysis of the spectroscopic observations
3.1 Radial Velocity Measurement
The radial velocities for several lines were obtained by the Shafter (1983) method and their dependence on the orbital phase was fitted by a sine wave. In this case, the points near the eclipse (the phases from -0.1 to 0.1) were disregarded. In the method used, two narrow (compared to the width of the investigated line) Gaussians whose centers are separated by a distance (Å) are cut out in the blue and red emission line wings. By concurrently moving both Gaussians over the spectrum and comparing the fluxes in the line wings cut out by the Gaussians, it is necessary to achieve the equality of these fluxes. The wavelength corresponding to half the separation between the Gaussians can then be considered to correspond to the wavelength of the entire investigated line and its radial velocity can be measured. Obviously, the result will depend on the chosen separation between the Gaussians . In an ideal case, the emission line width is believed to be determined only by the Doppler effect due to the Keplerian rotation of the matter in the accretion disk, while the line intensity distribution over the disk is axisymmetric. It can then be assumed that the radiation in the line wings is formed closest to the WD and it is the change in the positions of the emission line wings that best reflects the the WD radial velocity. Therefore, it is assumed in the method under consideration that the larger the separation , the more accurate the WD radial velocity obtained. At the same time, however, cannot be chosen to be too large, because the Gaussians will begin to go outside the emission line into the continuum. This manifests itself in a significant increase in the relative error of the amplitude of the sine wave fitting the derived velocity curve. Therefore, the largest value of at which the relative error of the amplitude is still small is commonly chosen.
| 603 | 688.341 | 0.520 |
|---|---|---|
| 604 | 688.345 | 0.582 |
| 605 | 688.349 | 0.634 |
| 606 | 688.353 | 0.697 |
| 607 | 688.357 | 0.754 |
| 608 | 688.361 | 0.811 |
| 609 | 688.365 | 0.868 |
| 610 | 688.369 | 0.924 |
| 611 | 688.373 | 0.981 |
| 612 | 688.377 | 0.039 |
| 613 | 688.381 | 0.096 |
| 614 | 688.385 | 0.154 |
| 615 | 688.389 | 0.211 |
| 616 | 688.393 | 0.268 |
| 617 | 688.397 | 0.325 |
| 618 | 688.401 | 0.382 |
The corresponding diagnostic diagrams showing the variation in the parameters of the fitting sine waves with for Hβ. data as an example are presented in Fig. 4. As we see from the diagnostic curves, the parameters of the sine wave change greatly for different , but the relative error in begins to increase greatly at Å. Therefore, the parameters corresponding to =22 Å were taken as the final ones.
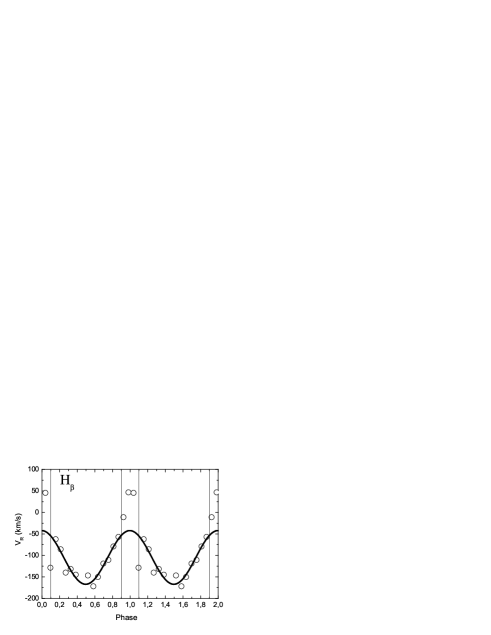
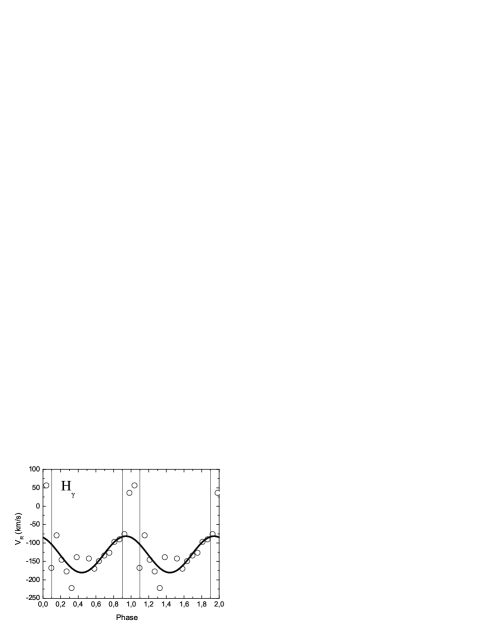
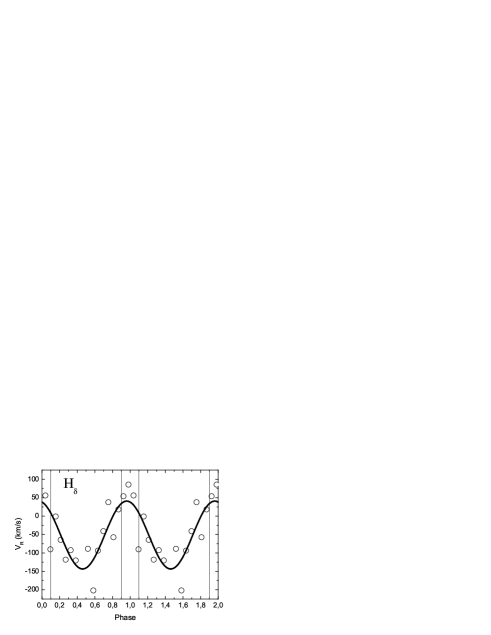
The derived radial velocity curves with their best fits are shown in Fig. 5 for the Hβ, Hγ, Hδ lines. Zero phase corresponds to the eclipse. The parameters of the fits are presented in Table 2. The averaged amplitude is = 63 8 km s-1.Note that the error in the parameters increases greatly with Balmer line number.
Note that the velocity near the maximum of the radial velocity curves rather than the center-of-mass velocity, as it must be for the orbital motion, occurs at zero phase in all cases. Therefore, we believe that the derived radial velocity curves do not describe the orbital motion of the white dwarf but more likely reflect the radial velocity of the bright spots in the disk, where these lines originate. The radial velocities determined from helium lines are random and unsuitable for analysis.
| Line | |||
|---|---|---|---|
| Mean |

3.2 Doppler Tomography
The binary was Doppler mapped using the computer code developed by Spruit (1998). We mapped the brightness distribution in the binary velocity space in the Hβ, Hγ, Hδ, HeI, HeII, HeI lines. The maps of three lines are presented in Fig. 6. The brightness distribution in all three hydrogen lines has a similar structure with two bright spots of different intensities. The brighter spot with -600 km s-1 and 400 km s-1 is near the accreting gas stream-accretion disk impact site. The second spot is more extended and lies on the opposite side of the disk relative to the white dwarf. The bright spots are much less distinct in the maps from the neutral helium lines and are absent altogether in the map corresponding to the ionized helium line. This is indicative of a relatively low temperature ( 7000-9000 K) in the Balmer line emission region. The constructed Doppler maps are very similar to the brightness distribution maps for IP Peg in quiescence (Neustroev et al. 2002), where the two bright spots are interpreted as two-armed spiral density waves.
As has already been noted in the Introduction, the three-dimensional hydrodynamic modeling of accretion disks performed by Bisikalo et al. (2001) predicts the existence of a density perturbation in the disk that rotates around the white dwarf with a period of and that is capable of producing the binary brightness oscillations with the same period. The second spot visible in the binary Doppler maps can be associated with this density perturbation.
4 Determination of binary parameters
For cataclysmic variables with short orbital periods (), there exists a fairly accurate semiempirical relation between the secondary mass and the binary period. For 1RXS J1808, the mass-period relations give (Knigge 2006) and (Howell et al. 2001). Therefore, we can take the mass to be .
The eclipse duration is related to the binary the relation between and (Horne 1985). For our object, the observed eclipse duration is approximately =0.03, which allows the relation between and presented in Fig. 7 to be derived.
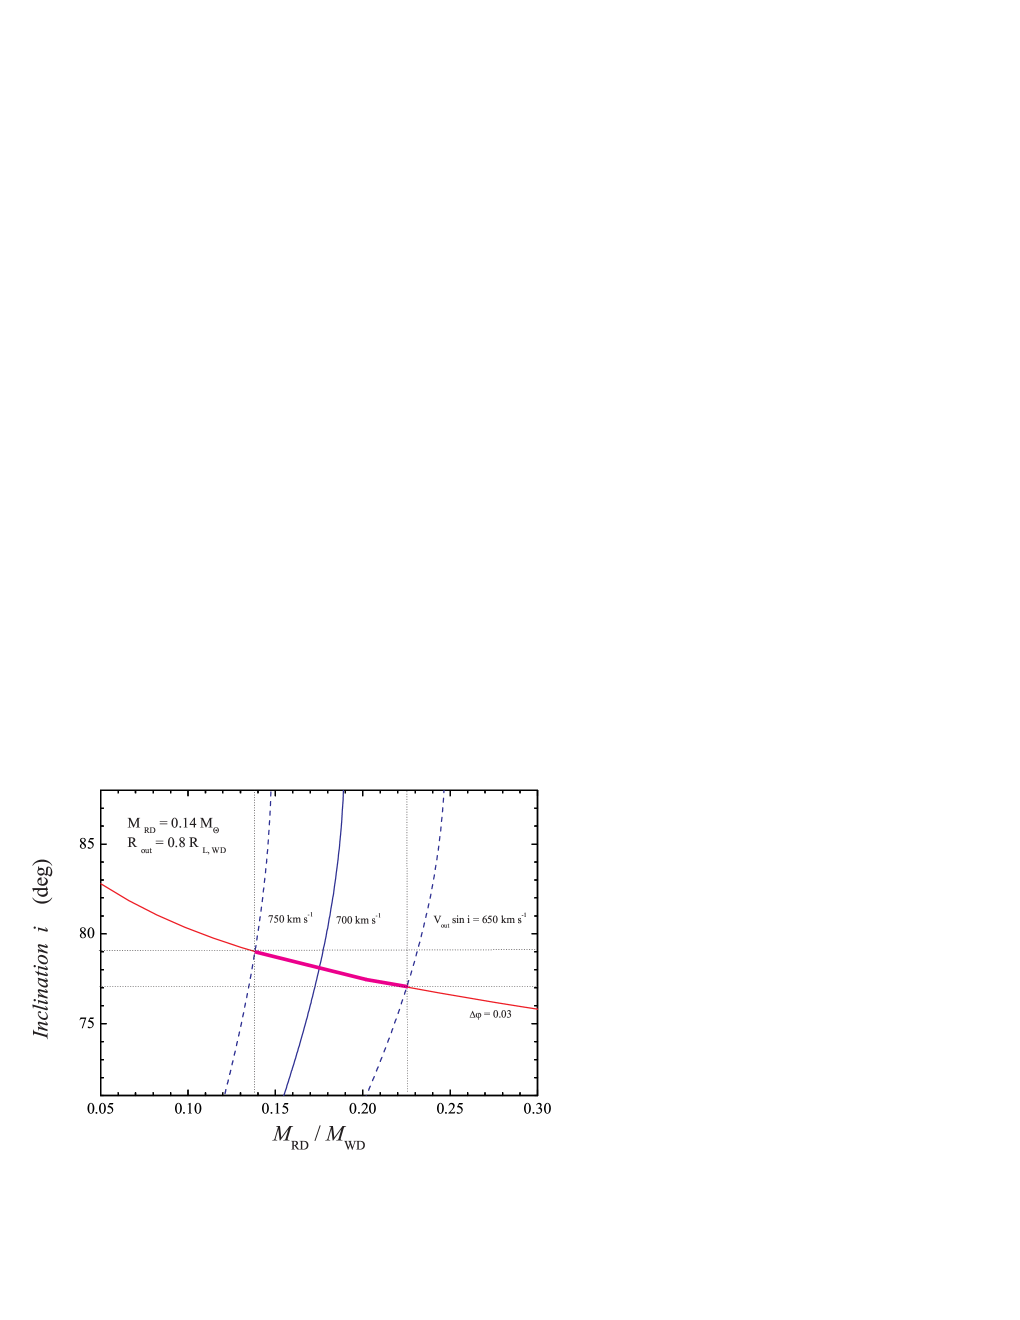
An additional relation between and is needed to determine the parameters. Using the radial velocity curve is undesirable because of the large initial phase shift ( 0.25). Instead, we used the relation between and based on the assumption that the separation between the peaks of double-humped emission lines corresponds to twice the projection of the Keplerian velocity at the outer disk edge onto the line of sight:
| (1) |
The outer disk radius is limited by the tidal interaction of the secondary star (Paczynski 1977) and it is approximately 0.8 of the effective Roche lobe radius (Eggleton 1983). The separation between the emission line peaks depends weakly on the orbital phase. Therefore, we used the separation between the peaks at phase 0.5, when the hot spot has the weakest effect on the line profile, which corresponds to the velocity at the disk edge = 700 50 km s-1. Using relation (1), we calculated the domain of admissible values in the – relation (Fig. 7) The parameters and were determined from it. As a result, we obtain , for , = 700 50 km s-1 and . We note, the calculated orbital velocity of the white dwarf for these binary parameters is 70 km s-1, which closely corresponds to obtained from the radial velocity curve (see Table 2).
5 Light curve modeling
The R-band light curve of the binary being investigated (Fig. 1) exhibits quasi-periodic brightness oscillations with a period of .01331 (). This is confirmed by our analysis of the power spectrum (Fig. 2) computed with the EFFECT code (V. Goransky, the Sternberg Astronomical Institute, Moscow). The corresponding brightness oscillations are not observed in the V band light curves (Fig. 1) most likely because of the poorer quality of the observational data, but a significant change in the depths of neighboring eclipses was found in the August 12 observations.
To explain the period found in the R band and the change in the depth of the August 12 eclipse in the V band, we modeled these light curves using a modified Magnitude code written by M. Stupalov (Shimanskii et al. 2002).
The model included a secondary, a white dwarf with a surface temperature = 50000 K, and a standard accretion disk (Shakura and Sunyaev 1973) with an external hot line formed from the stream of the secondary and a spot revolving around the white dwarf with a period and corresponding to a density wave (see the Section ”Analysis of the Spectroscopic Observations”). The second spot is needed to describe the quasi-periodic brightness oscillations and the different depths of neighboring eclipses. The revolution period of the spot differs from the observed period of the binary brightness oscillations (), because the brightness oscillation period is the beat period between the revolution period of the spot around the WD and the orbital period of the binary .
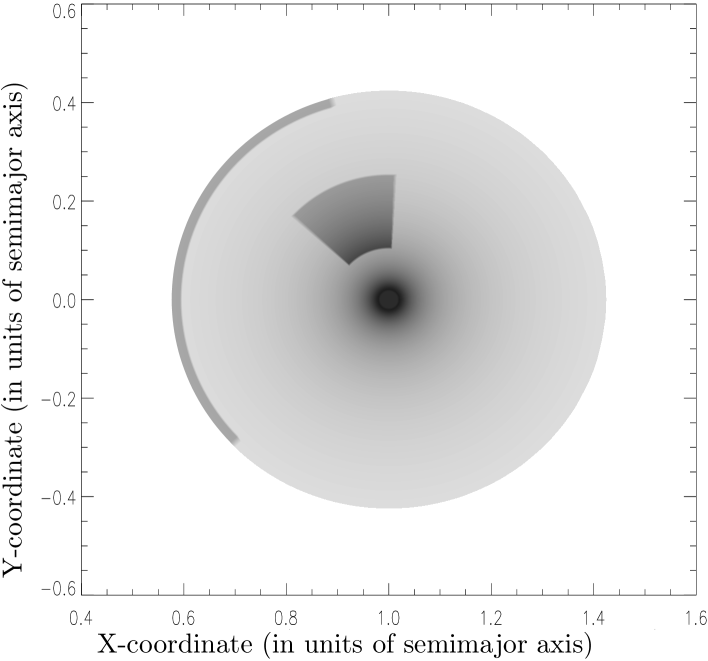
The essence of our modeling consists in dividing the surface of objects into surface elements and calculating the radiation intensity in the blackbody approximation, the visibility condition, and the possibility of an eclipse for each surface element. To calculate the total flux from the binary, we add up the fluxes from all surface elements visible at a given phase. The binary parameters found above were used in the model. The best fit is achieved at an accretion rate g s-1 (). The positions of the spots are shown in Fig. 8. The first spot with = 5200 K corresponding to the stream. disk impact site (hot line) is located near the outer disk radius, has the relative width =0.017 , and lies between the azimuth angles . The azimuth angle is measured from the straight line connecting the centers of mass of the WD and the secondary. The direction opposite to the direction to the WD was taken as zero angle. The angles in Fig. 8 are measured counterclockwise. The second spot has the opening angle and is bounded by the radii of 0.22 and 0.58 . Here, is the outer disk radius. The brightness temperature in the spot is almost a factor of 2 higher than that in the disk and changes from 18000 to 10000 K. It should be noted that the parameters of the second spot are not rigidly determined and admit concurrent temperature and size variations in fairly wide ranges (approximately by a factor of 2) without any noticeable deterioration of the accuracy of the fit to the observed light curves. For example, the azimuthal extent of the second spot can change from 25 to 100 degrees with the corresponding change in mean temperature from 16000 to 9700 K. The modeling results are presented in Fig. 9. The proposed model is capable of explaining the different depths of neighboring eclipses in the V band and describing some of the quasi-periodic oscillations in the R band. In reality, the disk apparently has a more complex structure changing with time. For example, the V-band observations suggest that the hot spot clearly has different intensities at different times, while the R-band observations reveal no quasi-periodic brightness oscillations after phase 0.3 (23.5 h).
6 Discussion
Let us consider in more detail the final model. The derived accretion rate g/s year corresponds to the expected accretion rate from a CV with this period (Howell et al. 2001). The estimated effective temperature at the outer disk edge K at cm is lower than that required for a steady-state accretion disk in outburst ( K, Cannizzo and Wheeler 1984). This may imply that the component mass ratio can be higher than the mean value that we adopted in our modeling and it is closer to 0.22. The outer disk radius may also be smaller than the value of 0.8 we adopted.
Let us investigate the possible physical nature of the radiation from the second spot. If the derived color temperature of the spot is assumed to be close to the effective one, then its bolometric luminosity can be estimated. Its value ( erg s-1) is approximately of the same order of magnitude as the bolometric luminosity of the disk erg s-1 and exceeds the luminosity of the same area of the disk without any spot by a factor of 7-16. No additional energy dissipation in the density wave is apparently capable of providing such a luminosity. External irradiation by the central regions of the disk and WD can be another source of energy for the radiation from the second spot. However, the irradiating flux in cataclysmic variables is usually lower than the intrinsic flux in the disk. Let us make simple estimates. The intrinsic flux in a standard steady-state disk is
| (2) |
the external flux from the central parts of the disk can be estimated as (Shakura and Sunyaev 1973)
| (3) |
and the irradiating flux from an isotropic central source of luminosity located at height above the disk plane is expressed as
| (4) |
Here, is the disk half-thickness at radius . As a result, the ratio of the irradiating flux to the intrinsic one is
| (5) |
The above formulas are valid for geometrically thin () steady-state -disks (Shakura and Sunyaev 1973). It is also assumed that the luminosity of the central source is provided by accretion (a boundary layer or an accretion column) and its maximum possible luminosity is equal to the disk luminosity. Accordingly, the height of the central source above the disk plane cannot exceed .
According to the constructed model, cm, cm, and cm (see, e.g., Suleimanov et al. 2007). This means that the disk half-thickness in the region of the second spot, even if the probable disk thickening is taken into account, is comparable to the WD radius and the external irradiation flux cannot exceed considerably the intrinsic flux from the disk. Strong irradiation of the disk is possible only in binaries with neutron stars whose radii (cm) are much smaller than those of white dwarfs at the same geometrical sizes of the disks. Given that not all of the externally incident flux is thermalized, it may be ultimately concluded that external irradiation cannot provide the radiation of the second spot.
This conclusion is valid only if the luminosity of the second spot was determined correctly. If, alternatively, its radiation is not thermalized and exceeds the disk luminosity by several tens of percent only in the optical spectral range (for example, due to emission lines), then external irradiation is, in principle, capable of providing the observed optical variability, just as in intermediate polars.
Consider the possibility that 1RXS J1808 is an intermediate polar. Several objects of this type, for example, DQ Her (Walker 1956; Saito and Baptista 2009) and LS Peg (Rodrigez-Gil et al. 2001), exhibit variability both with the WD spin period and with the beat period between the orbital and spin periods. The amplitude of the optical brightness oscillations with the WD spin period is low ( for DQ Her and for LS Peg), while the detection of the beat period produced by the reflected radiation is most significant in the hydrogen emission lines and HeII 4686.
The HeII 4686 line in emission is formed mainly through photoionization by external hard radiation and is a good indicator of external disk irradiation. For example, in the spectrum of DQ Her (Chanan et al. 1978), the flux in HeII 4686 is comparable to that in the Balmer lines. Therefore, the weakness of the HeII 4686 line and the Bowen blend in the spectrum of the source being investigated serves as direct evidence for insignificant external irradiation of the disk in 1RXS J1808. This is also suggested by the absence of any structure in the Doppler tomogram of the HeII 4686 line.
If the source of additional optical radiation that we consider to be the second spot were associated with the rotating WD, then the eclipses would be deeper against the background of an enhanced brightness of the binary outside eclipse, whereas the reverse is true – the eclipses are deeper at a general reduction in the binary brightness (see Fig. 1), which is consistent with the model of a second spot on the disk presented here. On the whole, the central regions of the disk near the WD are the main eclipsed source of optical radiation. The WD itself, even if very hot (we took a temperature of 50000 K), makes a minor contribution to the total brightness of the binary. We modeled the binary light curves by assuming the inner disk radius to exceed the WD radius. Thus, we simulated the appearance of a magnetosphere around a magnetized WD. Satisfactory results can be achieved only at an inner disk radius that does not exceed 3–4 WD radii ( cm). At the accretion rate under consideration (even when its increase by several times as the inner disk radius increases is taken into account), the WD magnetic field strength turns out to be less than 105 G. Taking into account all of the above arguments, we may conclude that 1RXS J1808 is not an intermediate polar with a high probability.
The only remaining possibility is the release of energy in the second spot through direct accretion apart from the disk (Hellier 1993, see also Neustroev et al. 2011). This requires assuming that part of the accreting material moves under the accretion disk and is stopped by a thickening on it in the form of a tidal density wave. If the mass accretion rate above the disk is comparable to that in the disk, then the interaction of the accreting stream with the density wave located at a distance of 5–6 WD radii provides the required bolometric luminosity of the spot. The possibility that the presumed stream of matter interacts not with the density wave but with the WD magnetosphere must not be ruled out. However, in this case, to explain the spot revolution around the WD, we have to assume that the magnetosphere is highly asymmetric. The hypothesis of a tidal wave is also supported by the coincidence of the revolution period of the second spot with the theoretically predicted value (Bisikalo et al. 2001).
7 Conclusions
We showed that 1RXS J1808 is a cataclysmic variable with a nonuniform brightness distribution in the disk with the component masses , and the binary inclination . Our Doppler mapping and light curve modeling revealed at least two spots in the accretion disk, at the stream.disk impact site, and a spot corresponding to a density wave and revolving around the white dwarf with a period of .. The luminosity of the second spot is most likely related to direct accretion of matter onto the disk thickening produced by a tidal density wave.
This binary is most likely a cataclysmic variable star in outburst similar in properties to nova-like stars, and further photometric and spectroscopic observations are required to confirm this conclusion.
We sincerely thank the Big Telescope Committee of the Special Astrophysical Observatory of the Russian Academy of Sciences for the long-term support of our programs of research on the spectra of close binary systems. We are also grateful to the TUBITAK for partial support in using RTT-150 (the Russian-Turkish 1.5-m telescope in Antalya). We thank A.I. Galeev for help in the photometric observations with RTT-150. This work was supported by the Russian Foundation for Basic Research (project no. -- r-povolzhie-a)
References
- Afanasiev et al. (2004) V. L. Afanasiev, E. B. Gazhur, S. R. Zhelenkov, et al., Soobshch. SAO RAN 58, 90 (2004).
- Afanasiev et al. (2004) I. F. Bikmaev and N. A. Sakhibullin, Astron. Telegram. 1648 (2008).
- Afanasiev et al. (2004) D. V. Bisikalo, A. A. Boyarchuk, A. A. Kilpio, et al., Astron. Rep. 45, 611 (2001).
- Afanasiev et al. (2004) H. M. Boffin, Astrotomography Indirect Imaging Methods in Observational Astronomy, Lecture Notes in Physics, Vol. 573, Ed. by H. M. J. Boffin, D. Steeghs, and J. Cuypers (Springler, Berlin, 2001), p. 69.
- Afanasiev et al. (2004) J. K. Cannizzo and J. C. Wheeler, Astrophys. J. Suppl. Ser. 55, 367 (1984).
- Afanasiev et al. (2004) G. A. Chanan, J. E. Nelson, and B. Margon, Astrophys. J. 226, 963 (1978).
- Afanasiev et al. (2004) D. V. Denisenko, T. V. Kryachko, and B. L. Satovskiy, Astron. Telegram. No. 1640 (2008).
- Afanasiev et al. (2004) P. P. Eggleton, Astrophys. J. 268, 368 (1983).
- Afanasiev et al. (2004) A. M. Fridman and D. V. Bisikalo, Phys. Usp. 51, 551 (2008).
- Afanasiev et al. (2004) C. Hellier, Mon. Not. R. Astron. Soc. 265, L35 (1993).
- Afanasiev et al. (2004) K. Horne, Mon. Not. R. Astron. Soc. 213, 129 (1985).
- Afanasiev et al. (2004) S. B. Howell, L. A. Nelson, and S. Rappaport, Astrophys. J. 550, 897 (2001).
- Afanasiev et al. (2004) C. Knigge, Mon. Not. R. Astron. Soc. 373, 484 (2006).
- Afanasiev et al. (2004) T.R. Marsh, K. Horne, MNRAS 235, 269 (1988).
- Afanasiev et al. (2004) V. V. Neustroev, N. V. Borisov, H. Barwig, et al., Astron. Astrophys. 393, 239 (2002).
- Afanasiev et al. (2004) V. V. Neustroev, V. F. Suleimanov, N. V. Borisov, et al., Mon. Not. R. Astron. Soc. 410, 963 (2011).
- Afanasiev et al. (2004) B. Paczynski, Astrophys. J. 216, 822 (1977).
- Afanasiev et al. (2004) C. Papadaki, H. M. Boffin, andD.Steeghs,J.Astron. Data 14, 2 (2008).
- Afanasiev et al. (2004) J. Patterson, J. Kemp, D. A. Harvey, et al., Publ. Astron. Soc. Pacif. 117, 1204 (2005).
- Afanasiev et al. (2004) P. Rodrigez-Gil, J. Casares, I. G. Martinez-Pais, et al., Astrophys. J. 548, L49 (2001).
- Afanasiev et al. (2004) E. Romero-Colmenero, B. Potter Stephan, D. A. H. Buckley, et al., Mon. Not. R. Astron. Soc. 330, 685 (2002).
- Afanasiev et al. (2004) R. K. Saito and R. Baptista, Astrophys. J. 693,L16 (2009).
- Afanasiev et al. (2004) M. R. Schreiber and B. T. Gänsicke, Astron. Astrophys. 406, 305 (2003).
- Afanasiev et al. (2004) A. W. Shafter, Astrophys. J. 267, 222 (1983).
- Afanasiev et al. (2004) N. I. Shakura and R. A. Sunyaev, Astron. Astrophys. 24, 337 (1973).
- Afanasiev et al. (2004) V. V. Shimanskii, N. V. Borisov, N. A. Sakhibullin, et al., Astron. Rep. 13, 656 (2002).
- Afanasiev et al. (2004) V. V. Shimanskii, S. A. Pozdnyakova, N. V. Borisov, et al., Astrophys. Bull. 64, 349 (2009).
- Afanasiev et al. (2004) J. Smak, Acta Astronomica. 44, 59 (1994).
- Afanasiev et al. (2004) H. C. Spruit, astro-ph/9806141 (1998).
- Afanasiev et al. (2004) D. Steeghs, E.T.Harlaftis,and K. Horne, Mon. Not. R. Astron. Soc. 290, 28 (1997).
- Afanasiev et al. (2004) D. Steeghs, Astrotomography Indirect Imaging Methods in Observational Astronomy, Lecture Notes in Physics, Vol. 573, Ed. by H. M. J. Boffin, D. Steeghs, and J. Cuypers (Springler, Berlin, 2001), p. 45.
- Afanasiev et al. (2004) V. F. Suleimanov, G. V. Lipunova, N. I. Shakura, Astron. Rep. 51, 549 (2007).
- Afanasiev et al. (2004) M. F. Walker, Astrophys. J. 123, 68 (1956).
- Afanasiev et al. (2004) B. Warner, Cataclysmic Variable Stars (Cambridge Univ. Press, Cambridge, 1995).
- Afanasiev et al. (2004) J. Wood, K. Horne, G. Berriman, et al., Mon. Not. R. Astron. Soc. 219, 625 (1986).