Quantum Enhanced Magnetometer with Low-Frequency Squeezing
Abstract
We report the demonstration of a magnetometer with noise-floor reduction below the shot-noise level. This magnetometer, based on a nonlinear magneto-optical rotation effect, is enhanced by the injection of a squeezed vacuum state into its input. The noise spectrum shows squeezed noise reduction of about 2 dB spanning from close to 100 Hz to several megahertz. We also report on the observation of two different regimes of operation of such a magnetometer: one in which the detection noise is limited by the quantum noise of the light probe only, and one in which we see additional noise originating from laser noise which is rotated into the vacuum polarization.
pacs:
42.50.Gy, 07.55.Ge, 32.60.+i, 03.65.Ta, 42.50.Lc, 42.50.DvOptical magnetometers now reach the sub-femtotesla/ level of sensitivity Wasilewski et al. (2010); Budker and Romalis (2007), surpassing superconducting quantum interference device (SQUID) magnetometers Seton et al. (2005). Ultimately, such optical magnetometers are limited by quantum-mechanical noise sources, in particular by the photon shot-noise at detection, spin projection atomic noise, and the back action of light noise onto atoms Fleischhauer et al. (2000); Wasilewski et al. (2010); Budker and Romalis (2007). The former noise source can be addressed with injection of polarization-squeezed light states Wolfgramm et al. (2010), while the spin projection noise can be suppressed via the use of atoms prepared in spin-squeezed states Kitagawa and Ueda (1993); Budker and Romalis (2007) or with quantum nondemolition measurements Koschorreck et al. (2010); Napolitano et al. (2011).
In this manuscript, we demonstrate a quantum-enhanced, all-atomic optical magnetometer based on a nonlinear magneto-optical (Faraday) rotation (NMOR) Budker et al. (1998, 2000, 2002); Novikova and Welch (2002); Novikova et al. (2000, 2005), with the injection of a vacuum-squeezed state into the polarization orthogonal to that of the probe field. We also demonstrate the transition from a shot-noise-limited magnetometer at lower atomic densities, to a region where the magnetometer is affected by the interaction of the light noise with the atoms at higher atomic densities. In contrast to a previously reported magnetometer, with squeezing generated via parametric down conversion in a nonlinear crystal Wolfgramm et al. (2010), our setup uses an atomic squeezer based on the polarization self-rotation (PSR) effect Matsko et al. (2002); Ries et al. (2003); Mikhailov and Novikova (2008); Mikhailov et al. (2009); Agha et al. (2010); Barreiro et al. (2011); Horrom et al. (2012). Unlike its crystal counterpart, the PSR squeezer does not require a powerful pump laser, but uses a pump laser with only several milliwatts of power in a single-path configuration. While the original simple model predicts about 6 dB of squeezing Matsko et al. (2002) and a detailed treatment predicts about 8 dB of squeezing with cold Rb atoms Horrom et al. (2011), the best demonstrated squeezing via PSR in hot Rb atoms so far is 3 dB Barreiro et al. (2011). Our squeezer generates about 2 dB of noise reduction, starting from close to 100 Hz and ranging up to several megahertz. This is the lowest frequency quantum noise sideband suppression generated at a wavelength of 795 nm to date. This unique squeezer allows for a quantum enhanced all-atomic magnetometer with improvements to the signal-to-noise ratio for measurements in the same range of frequencies. This is potentially useful for gravitational wave detectors Harry et al. (2002), geophysics, astronomy, biophysics, and medical applications. It is particularly useful for detecting low-frequency magnetic signatures against a background of a constant field.
The setup of our experiment is depicted in Fig. 1. It contains two important components: the squeezer, which prepares the polarization-squeezed probe beam, and the magnetometer, which can be probed with either the squeezed or shot-noise-limited (unsqueezed) beam.
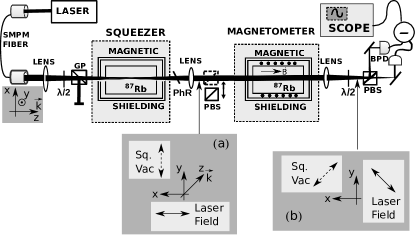
The operation of this squeezer is discussed in detail in Ref. Horrom et al. (2012). The output of a DL100 Toptica external cavity semiconductor laser, locked to the D1 line transition of 87Rb with zero detuning, passes through a single-mode polarization-maintaining (SMPM) fiber to achieve an axially symmetric Gaussian intensity distribution of the pump laser beam. The Glan-laser polarizer (GP) purifies the polarization of the pump beam and ensures its linear x-polarization. The pump laser beam, with a power of 7 mW, is focused inside the Rb cell (which contains isotopically enriched 87Rb vapor and no buffer gas) with a beam waist of 100 m. The Pyrex cell has a length of 75 mm and is enclosed in three layers of -metal magnetic shielding to screen out ambient laboratory magnetic fields and guarantee zero field inside the cell. We maintain the cell at 66∘ Celsius, corresponding to an atomic number density of atoms/cm3. We find these parameters experimentally to be optimal for noise suppression (squeezing) of 2 dB with respect to the shot-noise level at frequencies in the range of several kHz to 1 MHz, and once we account for detection noise, we see noise suppression to frequencies as low as 100 Hz (see Fig. 6). This squeezed vacuum state is linearly polarized in the y-direction (orthogonal to the x-polarized pump laser field) as shown in Fig. 1(a). After the first cell, we make a collimated magnetometer probe beam from the squeezer output with a waist size of 900 m. We must treat this probe quantum mechanically and thus describe quantum fluctuations in both x and y polarizations. The mixing of the squeezed-vacuum field in the y-polarization, with the strong pump field in the orthogonal polarization, creates a polarization-squeezed state Chirkin et al. (1993), as was first demonstrated in Hald et al. . When we set a polarizing beam splitter at 45∘ with respect to polarization of the squeezed vacuum (see Fig. 1(b)), and thus split the laser power 50/50 for the balanced photodetector (BPD), we make the detector sensitive to the quantum fluctuations in the squeezed vacuum field Hald et al. ; Barreiro et al. (2011); Wolfgramm et al. (2010). We use this polarization-squeezed beam as the probe field for our magnetometer and refer to it as the squeezed probe everywhere in the text. The laser power of this squeezed probe is 6 mW after absorption loss in the squeezing cell.
The magnetometer itself consists of a similar cell of isotopically enriched 87Rb with the addition of 2.5 Torr Ne buffer gas. This cell is also enclosed in the magnetic shielding, but an internal solenoid controls the magnetic field () which is parallel to the direction of probe beam propagation. We also vary the magnetometer cell temperature to see what density of atoms provides an optimal magnetometer response.
After the magnetometer cell, we have a detection scheme to measure the polarization rotation angle of the probe through the atoms. The scheme consists of a polarizing beam splitter (PBS) set to 45∘ with respect to the probe light polarization, which splits the probe field at a 50/50 ratio and directs it to the balanced photodetector (BPD). The signal from the BPD is sent to an SRS SR560 voltage preamplifier and then to a Lecroy 640Zi oscilloscope to analyze the response of the system to the magnetic field and also measure the quantum noise spectrum (with the spectrum analyzer feature enabled by the scope). We tilt the phase-retarding plate after the squeezer (implemented with a quarter-wave plate set so that the axes of birefringence coincide with the polarizations of the probe and squeezed fields) to control the phase shift between orthogonal polarizations and adjust the squeezing angle of the vacuum field relative to the probe field. In this way, we can choose the phase-angle to achieve the maximum quantum noise suppression.
We can remove the squeezed-vacuum field from the squeezed-probe beam by inserting a PBS before the magnetometer, which rejects squeezed vacuum in the y-polarization and thus creates a shot-noise-limited, unsqueezed, coherent vacuum quantum state in this polarization, orthogonal to the x-polarized pump laser. Meanwhile, it leaves the intensity and the quantum state along the x-polarization of the probe virtually unaffected (we disregard small optical losses inside the PBS). We use this normal unsqueezed beam to calibrate the response of our magnetometer, and we call it the coherent probe everywhere in the text. Such a probe allows us to see the shot-noise limit (standard quantum limit (SQL) of our magnetometer.
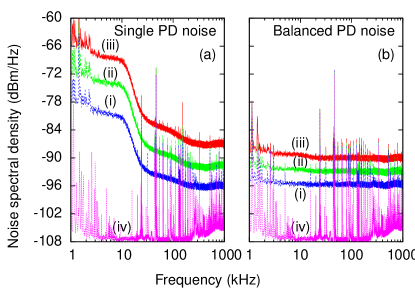
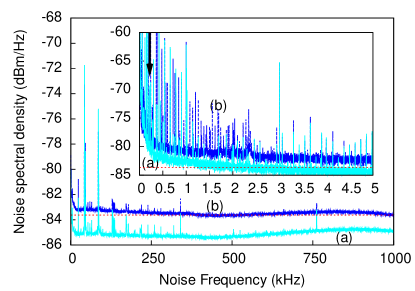
Unfortunately, our laser had a rather large intensity noise and thus was not shot-noise limited along the x-polarization. We demonstrate this by inserting a PBS into the squeezed field, bypassing the magnetometer cell, and directing the laser to detection with one PD of the balanced setup blocked from the light. In this configuration, the detector is sensitive to the amplitude noise quadrature of the x-polarization of the probe field. As can be seen in Fig. 2(a), the noise spectrum is not flat and increases by 6 dBm/ at every subsequent doubling of the laser power: traces (i), (ii), and (iii). In other words, the noise spectral density scales as the square of the laser power, which is a signature of residual intensity noise (RIN). However, our BPD detection is shot noise limited at most detection frequencies, and we detect noise at the level of the standard quantum limit (SQL). To prove this, we open both PD of the BPD and carefully match beam intensities arriving to each. As can be seen in Fig. 2(b), the spectral density now scales linearly with the laser beam power, i.e. it increases by 3 dBm/ at each doubling of the laser beam power (see traces (i), (ii), and (iii)). The noise spectrum is generally flat with exceptions of the resonant noise peaks from the electronics (compare to trace (iv) depicting the detector dark noise). Comparing traces in Fig. 2(a), where one PD is blocked, and Fig. 2(b), where both PD are open, we see that we can easily achieve about 25 dB RIN suppression. Unfortunately, this is insufficient for truly shot noise limited detection at frequencies lower than 200 kHz, indicated by the small rise above the SQL level of the noise spectral density at such frequencies (see also Fig. 6). Therefore, while our squeezer offers noise suppression at detection frequencies as low as 100-200 Hz, we are only shot noise limited to start with in this experiment at frequencies above 200 kHz due to laser noise.
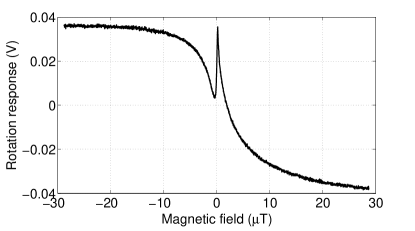
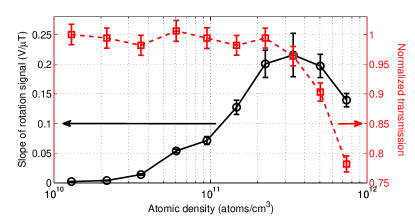
When we apply a longitudinal magnetic field to the magnetometer cell, the polarization of the probe field rotates due to the NMOR effect and the photodiodes detect a signal proportional to the angle of rotation (for small angles) and the incident intensity of the light. We fix the intensity of light; thus the BPD signal is proportional only to the angle of rotation. A characteristic response curve is depicted in Fig. 3. The broad S-like response is governed by the Zeeman splitting of the ground-state magnetic sublevels and their decoherence time subject to power broadening (time of flight of the atom, in the probe beam is estimated to be around 3.3 s, which corresponds to a resonance width of 300 kHz, which in turn, governs the relevant Zeeman splitting to be about 50 T for our S-like resonance). The narrow resonance at zero magnetic field is due to velocity changing collisions and repeated interaction of the atoms that diffuse away from the laser beam and then return back to the beam Zibrov et al. (2001); Novikova et al. (2005). We attribute the asymmetric shape to the presence of other hyperfine levels nearby that break symmetry. For such atoms, the effective lifetime in the beam is significantly longer, resulting in a narrower spectral feature. We note that if we reduce the power of the probe beam below 12 mW, the narrow resonance disappears, since the probe beam intensity drops below that required to saturate the narrow resonance. The smallest detectable magnetic field (i.e. sensitivity) of the magnetometer is inversely proportional to the slope of this curve; the slope is measured on the steepest part of the response curve on the left side of the narrow peak. This narrow resonance thus increases the response of the magnetometer to very small magnetic fields, and so we maintain the intensity of the probe light at the level of several milliwatts. An easy way to boost the response of the magnetometer is to increase the number of interacting atoms in the magnetometer cell (i.e. increase the cell temperature). The rotation signal slope (and thus the magnetometer response) grows with increasing density for small atomic densities (see Fig. 4) but then tends to saturate since with increased atomic density the probe beam is attenuated which leads to a weaker signal at the BPD Novikova et al. (2002). If the density is increased even further, the probe light will eventually be totally absorbed and no response will be detected.
The ultimate sensitivity is governed by the signal-to-noise ratio according to the equation , where is the slope of rotation and is the noise level. In our experiment, we use the signal and noise of the voltage response of the oscilloscope, which is directly proportional to the angle of polarization rotation. The noise level is set by the quantum noise floor at frequencies higher than 200 kHz. We compare the noise floors of our magnetometer under two experimental conditions: first, when we probe with unsqueezed coherent light, which sets the shot-noise limit, and second, when we use the polarization-squeezed light probe. We conduct this comparison at different temperatures and atomic densities. The results are depicted in Fig. 5. During these measurements, we modulate the internal longitudinal magnetic field at various frequencies to ensure that noise floor of the magnetometer is unaffected by the presence of alternating magnetic field. In Fig. 5, the noise measurements were taken without magnetic field, but note the noise spike due to modulation set to 220 Hz for data in Fig. 6.
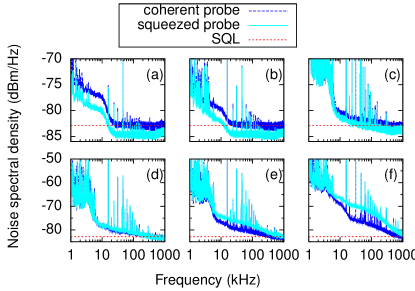
At lower atomic densities (cell temperatures), when polarization coupling does not contribute much to the overall noise budget, we see broadband noise suppression of about 2 dB from hundreds of hertz to several megahertz, which is independent of atomic temperature and follows the input squeezed state noise spectrum (see for example Fig. 6, obtained with the most careful balancing of the detector). High resonance-like peaks are due to resonant spikes in electronic dark noise of the BPD and the electronic noise of our solenoid current source. Note that in Fig. 5, one can see an increase of the noise above the SQL level at frequencies below 200 kHz and especially below 1020kHz. This is due to residual intensity noise (RIN) of our laser, discussed above, making our detection not truly shot-noise limited at these frequencies, even with the most careful balancing of the light power at the PDs.
With increase of the atomic density in the magnetometer cell, we see that at lower frequencies noise grows significantly above the SQL level. The similarities between the RIN power spectra (Fig. 2) and the magnetometer spectra (Figs. 5(d),(e) and (f)) lead us to conclude that this contribution of the noise is from the strong x-polarization of the probe. This contribution is due to the dependence of the NMOR effect on probe power, thus the RIN in the x-polarization couples into the y-polarization noise that our BPD detects, due to the presence of the atoms. To test this, we block the y-polarized light with a PBS after the magnetometer and compare this noise floor to that of the probe beam when it completely bypasses the atoms in the magnetometer. We find these noise levels are the same, (adjusted for optical losses in the cell), indicating that the increase in noise at high densities is due to the x-polarized noise coupling into the y-polarized field. However, we note some interesting dynamics: the squeezed probe shows a higher noise floor compared to the coherent probe, where squeezing was replaced with a normal vacuum state in the y-polarization (see Figs. 5(d),(e) and (f)). We conjecture that this is due to the back action of atoms on the probe quantum noise, since we are unable to bring the noise level of the squeezed probe below the coherent probe level no matter how we adjust the squeezing angle.
We choose several noise spectral frequency components from Fig. 5 to better illustrate this situation in Fig. 7. Here, 0 dB indicates the noise level seen using the coherent probe (unsqueezed state). Note that at lower atomic densities, the squeezing clearly improves the magnetometer noise floor and the noise spectrum is nearly independent of the detection frequency. At higher densities, squeezing is degraded due to absorption by the atoms and so we expect less noise suppression. We also see that at the highest densities, due to the back action of atoms (as we discussed above), the total noise is amplified rather than suppressed. This effect shows that using squeezed light will only improve the magnetometer sensitivity at certain atomic densities and experimental conditions.

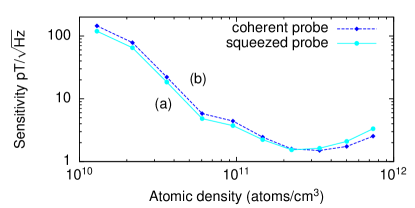
We calculate the magnetometer sensitivity by dividing the noise amplitude densities (calculated from the data presented in figure 5) taken at 500 kHz, by the magnetometer response shown in Fig. 4. Due to absorption and the increased noise described above, the NMOR magnetometer does not benefit from polarization squeezing at all atomic densities and temperatures as we show in Fig 8. However, benefits of the polarization-squeezed state probe are clearly visible at lower atomic densities for the chosen detection frequency. The magnetometer sensitivity can likewise be improved for any set of parameters (detection frequency, atomic density, etc.) where noise suppression below shot noise is observed.
We demonstrated an all-atomic quantum enhanced NMOR magnetometer with sensitivities down to close to 1 pT/. To the best of our knowledge, this is first demonstration of a squeezer at 795 nm capable of noise suppression below shot-noise levels at low frequencies starting from a few hundred hertz. This brings such a quantum-enhanced magnetometer into the realm of practical applications in medicine and biology where the characteristic magnetic signatures are at sub-kilohertz frequencies. We also note that any DC magnetic field can be up-converted to the detection band of this device if one spins the overall setup to generate a modulation of the magnetic field at the desired frequency. This may not be very practical for an Earth-based setup, but could be possible for a space-based setup, where the overall rotation can be achieved at frequencies of hundreds of hertz. So this enhancement method could potentially be applied to magnetometers used in astrophysics and space exploration programs. We also note that the increase in noise below 200 kHz frequencies in our squeezer is not fundamental, and can be improved with the use of a laser with less intensity noise and an improved design of the BPD. We would like to mention that our enhancement works for any shot-noise-limited detection, and address a common argument against squeezing that “it is always possible to increase the SNR by increasing the light power, making squeezing unnecessary.” While this is correct the injection of squeezing increases the SNR even further on top of the power-boost improvement.
Acknowledgements.
We are thankful to Irina Novikova for useful discussions during the manuscript preparation. Jonathan P. Dowling and Robinjeet Singh would like to acknowledge support from the Intelligence Advanced Research Projects Activity and the National Science Foundation.References
- Wasilewski et al. (2010) W. Wasilewski, K. Jensen, H. Krauter, J. J. Renema, M. V. Balabas, and E. S. Polzik, Phys. Rev. Lett. 104, 133601 (2010).
- Budker and Romalis (2007) D. Budker and M. Romalis, Nature Physics 3, 227 (2007).
- Seton et al. (2005) H. Seton, J. Hutchison, and D. Bussell, Cryogenics 45, 348 (2005).
- Fleischhauer et al. (2000) M. Fleischhauer, A. B. Matsko, and M. O. Scully, Phys. Rev. A 62, 013808 (2000).
- Wolfgramm et al. (2010) F. Wolfgramm, A. Cerè, F. A. Beduini, A. Predojević, M. Koschorreck, and M. W. Mitchell, Phys. Rev. Lett. 105, 053601 (2010).
- Kitagawa and Ueda (1993) M. Kitagawa and M. Ueda, Phys. Rev. A 47, 5138 (1993).
- Koschorreck et al. (2010) M. Koschorreck, M. Napolitano, B. Dubost, and M. W. Mitchell, Phys. Rev. Lett. 104, 093602 (2010).
- Napolitano et al. (2011) M. Napolitano, M. Koschorreck, B. Dubost, N. Behbood, R. J. Sewell, and M. W. Mitchell, Nature 471, 486 (2011).
- Budker et al. (1998) D. Budker, V. Yashchuk, and M. Zolotorev, Phys. Rev. Lett. 81, 5788 (1998).
- Budker et al. (2000) D. Budker, D. F. Kimball, S. M. Rochester, V. V. Yashchuk, and M. Zolotorev, Phys. Rev. A 62, 043403 (2000).
- Budker et al. (2002) D. Budker, W. Gawlik, D. Kimball, S. Rochester, V. Yashchuk, and A. Weis, Rev. Mod. Phys. 74, 1153 (2002).
- Novikova and Welch (2002) I. Novikova and G. R. Welch, J. Mod. Opt. 49, 349 (2002).
- Novikova et al. (2000) I. Novikova, A. B. Matsko, V. A. Sautenkov, V. L. Velichansky, G. R. Welch, and M. O. Scully, Opt. Lett. 25, 1651 (2000).
- Novikova et al. (2005) I. Novikova, A. B. Matsko, and G. R. Welch, J. Opt. Soc. Am. B 22, 44 (2005).
- Matsko et al. (2002) A. B. Matsko, I. Novikova, G. R. Welch, D. Budker, D. F. Kimball, and S. M. Rochester, Phys. Rev. A 66, 043815 (2002).
- Ries et al. (2003) J. Ries, B. Brezger, and A. I. Lvovsky, Physical Review A 68, 025801 (2003).
- Mikhailov and Novikova (2008) E. E. Mikhailov and I. Novikova, Opt. Lett. 33, 1213 (2008).
- Mikhailov et al. (2009) E. E. Mikhailov, A. Lezama, T. W. Noel, and I. Novikova, JMO 56, 1985 (2009).
- Agha et al. (2010) I. H. Agha, G. Messin, and P. Grangier, Opt. Express 18, 4198 (2010).
- Barreiro et al. (2011) S. Barreiro, P. Valente, H. Failache, and A. Lezama, Phys. Rev. A 84, 033851 (2011).
- Horrom et al. (2012) T. Horrom, I. Novikova, and E. E. Mikhailov, J. Phys. B: At. Mol. Opt. Phys. 45, 124015 (2012).
- Horrom et al. (2011) T. Horrom, A. Lezama, S. Balik, M. D. Havey, and E. E. Mikhailov, Journal of Modern Optics 58, 1936 (2011).
- Harry et al. (2002) G. M. Harry, J. L. Houser, and K. A. Strain, Phys. Rev. D 65, 082001 (2002).
- Chirkin et al. (1993) A. S. Chirkin, A. A. Orlov, and D. Y. Parashchuk, Quantum Electronics 23, 870 (1993).
- (25) J. Hald, J. L. Sorensen, C. Schori, and E. S. Polzik, .
- Zibrov et al. (2001) A. S. Zibrov, I. Novikova, and A. B. Matsko, Opt. Lett. 26, 1311 (2001).
- Novikova et al. (2002) I. Novikova, A. B. Matsko, and G. R. Welch, J. Mod. Opt. 49, 2565 (2002).