Understanding and modulating the competitive surface-adsorption of proteins
Abstract
It is now well accepted that cellular responses to materials in a biological medium reflect greatly the adsorbed biomolecular layer, rather than the material itself. Here, we study by molecular dynamic simulations the competitive protein adsorption on a surface (Vroman effect), i.e. the non-monotonic behavior of the amount of protein adsorbed on a surface in contact with plasma as a function of contact time and plasma concentration. We find a complex behavior, with regimes during which small and large proteins are not necessarily competing between them, but are both competing with others in solution. We show how the effect can be understood, controlled and inverted.
pacs:
87.10.Tf, 81.16.Fg, 87.85.J-I Introduction
00footnotetext: a Departament de Física Fonamental, Facultat de Física, Universitat de Barcelona, Diagonal 645, 08028, Barcelona, Spain. E-mail: gfranzese@ub.edu00footnotetext: b Center for BioNano Interactions (CBNI), University College of Dublin, Ireland. E-mail: Kenneth.A.Dawson@cbni.ucd.ieWhen nanoparticles are in contact with blood plasma, or other biological fluids, biomolecules rapidly coat the bare surface in a relatively selective manner Cedervall et al. (2007). It is increasingly accepted that the early biological responses to nanoparticles will be determined by the adsorbed biomolecules rather than the pristine surface alone Monopoli et al. (2011); Kim et al. (2012); Walczyk et al. (2010). Because of their size Monopoli et al. (2011); Oberdörster et al. (2009) nanoparticles are trafficked by active transport processes throughout the organism, using the information from the protein sequences associated with the surface of nanoparticles. Unlike the situation for flat macroscopic surfaces say of medical implants, for nanoparticles the protein environment changes in different compartments of cells and organs, as the nanoparticle traffics. This has lent urgency to the modern interest in understanding the phenomenon at a more fundamental level Monopoli et al. (2011). Still, we can learn a lot from an understanding of the process for flat surfaces Tengvall et al. (1998). Studying the adsorption of Fibrinogen on a surface in contact with blood plasma, Vroman found that the surface concentration of Fibrinogen shows a maximum at an intermediate contact time, indicating that Fibrinogen is replaced with time by one or more families of different proteins Vroman (1962). The phenomenon is not specific to Fibrinogen, but is a general effect for many other proteins Ortega-Vinuesa and Hidalgo-Álvarez (1995); Holmberg and Hou (2009). The plasma proteins compete for the occupation of the surface, resulting in a sequential competitive adsorption, known as the Vroman effect.
The effects depends on numerous factors such as the plasma dilution, the pH, the temperature, the surface charge and the specific surface chemistry Jackson et al. (2000). In highly concentrated plasma, the sequential adsorption takes place in seconds, but it takes several minutes when the plasma is diluted LeDuc et al. (1995). The effect has been documented both on hydrophilic and hydrophobic interfaces LeDuc et al. (1995); Green et al. (1999) being more evident the more hydrophilic the material, but with stronger protein binding the more hydrophobic the surfaces Noh and Vogler (2007); Ding and Hlady (2011). However, no universality is found in the experiments and the results strongly depend on the details of the experiments Lassen and Malmsten (1996, 1997); Barnthip et al. (2009). It is generally accepted that proteins with smaller molecular weight and at higher concentration adsorb first to the surface, but later are replaced by other proteins with, generally, larger molecular weight and size. After the adsorption, the protein can undergo conformational changes and denaturation, especially at a hydrophobic interface, eventually leading to irreversible adsorption Green et al. (1999).
Many experimental techniques have been used to investigate the effect from blood plasma or model solutions with a limited number of components and many models have been proposed to rationalize the experiments Lu et al. (1994); Brash and Horbett (1995); Slack and Horbett (1995); LeDuc et al. (1995); Dejardin et al. (1995); Green et al. (1999). However, the mechanisms of the phenomenon are still debated and no existing model can fully explain it Jung et al. (2003); Barnthip et al. (2009); Hirsh et al. (2013).
Volumetric effects, due to non-deformable proteins trying to fit on the available surface, can account for competitive adsorption of proteins Barnthip et al. (2009). However, they do not reproduce the maxima of absorption of the Vroman effect. This maxima is, instead, rationalized by models based on kinetic equations. Some of these models include coupled mass transport equations Lu et al. (1994). In all of them, to each kind of protein in solutions, there are associated different adsorptions/desorption rate constants. These processes are modeled as reversible by some authors Cuypers et al. (1987). Others, to fit better the experiments, assume that the adsorption can become irreversible with a “reaction” rate constant Lu et al. (1994). Due to the difficulty for this approach to describe the variety of experimental results, some models include also a “displacement” rate constant of a reversibly adsorbed protein by a protein with a higher surface affinity Lundström and Elwing (1990); Slack and Horbett (1995); Dejardin et al. (1995). However, these models are unable, in general, to describe solutions at low concentration, where the surface coverage is controlled by diffusion Dejardin et al. (1995), and cannot rationalize the different desorption behavior observed for sorbent-free with respect to sorbent-bearing washing solutions LeDuc et al. (1995).
The latter observation inspired LeDuc et al. to include also a “liberation” rate constant of semipermanently adsorbed protein by contact with a bulk protein LeDuc et al. (1995). To simplify the model, the authors made strong approximations, likely to be incorrect, assuming that adsorbed proteins do not diffuse on the surface and that the displacement and liberation rate constant do not depend on the incoming protein LeDuc et al. (1995). They applied the model to rationalize data of a ternary solution mixture with Albumin, high molecular weight Kininogen and Fibrinogen, accounting also for the deformation of the semipermanently adsorbed proteins. As a result, LeDuc et al. found that, to fit the data, the first two proteins should occupy approximately fourfold more space in the semipermanent state while Fibrinogen would have a much smaller change.
This is at variance with what recent experiments show for rod-like proteins as the Fibrinogen. This elongated protein, although deforms less then Albumin when adsorbed on an extended surface, can undergo a large rearrangement from an initial “lying down” stage (with its long axis parallel to the surface) to a “standing up” conformation (long axis perpendicular to the surface). This conformational change results in a large difference in the occupied surface Roach et al. (2005).
While the models based on kinetic equations are useful to qualitatively reproduce the experimental data by fitting the rate constants, they are less instructive about the mechanisms that at molecular level control the phenomenon. To give an insight into how the competition between sizes, bulk concentrations, surface affinities, diffusion constants and conformational changes combines to give rise to the Vroman effect, we devise here a coarse-grained model of a ternary protein solution mixture in contact with a hydrophobic surface.
II The Model
A full atom simulation of competitive adsorption of proteins from a multicomponent mixture is at present time unfeasible for several reasons. Each protein is made of a large number of amino acids (e.g., 585 for human serum Albumin and more than 2800 for the human Fibrinogen) and is hydrated by thousands of water molecules. As a consequence, a fully atomistic Molecular Dynamics (MD) simulations of one single protein adsorption on a surface with explicit water is limited to a few hundreds of ns Wei et al. (2012). This time scale is at least five orders of magnitude smaller than the one necessary to observe competitive adsorption. Moreover, the simulations should be for thousands of proteins.
This challenging task can be undertaken by coarse-graining the system. Coarse-graining can be performed at different levels Tozzini (2005). However, modeling a full layer of adsorbed proteins on an extended surface urges to reduce drastically the degrees of freedom. A common strategy is to consider implicit water and to represent the protein as a single particle. As we will explain in the following, this approach does not prevent us from taking into account the possibility of conformational changes. We now describe the details of the model with the approximations we make to reduce the complexity of the problem, bearing in mind that our aim is to show that the competitive adsorption can be understood in terms of a general mechanism, regardless the specific details of the real interactions in the system.
We consider the three most abundant proteins in human blood: Albumin (Alb), Immunoglobulin- (IgG) and Fibrinogen (Fib), for which competitive adsorption on hydrophobic surfaces has been observed Bale et al. (1988); Lassen and Malmsten (1997). The model assumes an implicit solvent and includes through effective potentials the specific energetic and entropic effects of the water hydrating the proteins and the surface Franzese et al. (2011), as well as those effects due to the charge distribution on the protein surface or the counter ions in the solution Gallo et al. (2011). This method has been validated in many specific cases (e.g., see Lund et al. (2008); Ravichandran and Talbot (2000)) and follows a general approach that has led to the well established DLVO theory (e.g., see Oberholzer et al. (1997); Ruggiero et al. (1999); Bellion et al. (2008)).
Alb is a globular protein, with an almost spherical shape and an isoelectric point (IEP) at approximately pH 5.0 Malmsten et al. (1997). By considering a pH 5.0, we minimize the charge interaction for Alb. Hence, the interaction of Alb with the surface is modeled with a short range attraction, that can be thought as mainly due to the entropic gain for water exclusion at the interface,
| (1) |
where is the distance between the center of mass of the protein and the surface, , related to the binding affinity and the dissociation constant, is the attractive energy between Alb and the surface. Here , with radius of the Alb, takes into account that Alb is a globular protein whose conformation may become distorted on interaction with the surface Roach et al. (2005).
The IgG structure resembles a that can be roughly approximated with a spherical shape. We model protein-protein interaction for the two spherical proteins as
| (2) |
where is the protein-protein distance, the characteristic interaction energy between protein and protein , where each index can be for Alb or for IgG, and , with radius of protein . Attraction among proteins is not included at this level of description, as it is small compared to protein-surface interaction and the protein solution is stable Lu et al. (1994).

The Fib in its folded conformation is rod-like. We approximate it with an elongated ellipsoid, with two principal axes of rotation, that can assume two different conformations, one “lying down” and another “standing up” on the surface (Fig. 1). This idea is consistent with experiments Roach et al. (2005) and has been used in Monte Carlo simulations with potentials within the DLVO theory Bellion et al. (2008). Here the two different conformations are encoded in an effective way through soft-core Fib-“protein ” potentials,
| (3) |
where stands for Alb, IgG and Fib, with corresponding to the interaction along the short axis, corresponding to the interaction along the long axis, , , the long axis of Fib, and the characteristic interaction energy of Fib with the protein . The protein-protein interaction with the Fib along the short axis is chosen energetically unfavorable with respect to that along the long axis, because the latter offers more binding points to the surface.
Since both (monoclonal) IgG Galisteo-González et al. (1994-03-01) and Fib Malmsten et al. (1997) have an IEP at approximately pH 5.5, at the chosen pH 5.0 they are charged. Following other authors, e.g., Ref. Mücksch and Urbassek (2011), we consider that the charged proteins, IgG and Fib, have an effective interaction with the surface modelled by a Lennard-Jones potential
| (4) |
where is the attractive energy between the protein and the surface, and accounts for the possible distortion of the protein in contact with the surface.
When adsorbed, each protein occupies a surface , including the “standing up” conformation of Fib, while the Fib in its “lying down” conformation occupies a surface .
To account for the different diffusive behaviors of different proteins in absence of external flow, we calculate the hydrodynamic radius of each protein , under the assumption that the proteins can be approximated by a sphere, through the Einstein-Stokes equation , where is the experimental diffusion coefficient, the viscosity of the medium, the Boltzmann constant, the absolute temperature. Next, we identify , , and , while is set by imposing that the experimental surface concentration found for Fib corresponds to its close packing configuration in the “standing up” conformation Lu et al. (1994). These conditions give nm, nm, nm and nm. Protein masses kDa, kDa, kDa, necessary to determine the time scales, are known from experiments Noh and Vogler (2007).
Because we include only repulsive protein-protein interaction, for sake of simplicity we set all the protein-protein . Protein-surface attraction energy can be calculated from the adsorption rate constants Lu et al. (1994). These rates are proportional to the probability for a protein to attach to the nearby surface
| (5) |
However, the in physical units are not known a priori. Hence, we consider the relative probabilities for different proteins , from which is possible to determine the values of the different energies as
| (6) |
adopting for Alb as the energy units. We set , the only free parameter of our model, by comparing our simulations results with experiments at ambient temperature, and get and by adopting the adsorption rate constants as in the theoretical model of Lu et al. Lu et al. (1994), that reflect the experimental observation that Fib has the strongest affinity for several surfaces and albumin the weakest.
III The Numerical Method
We perform MD simulations at constant , constant volume and constant number of proteins , in a parallelepiped with two square faces and four rectangular faces. A square face is occupied by the attractive surface, the other by a wall interacting with the proteins through the repulsive part of the potential in Eq.(1). We apply periodic boundary conditions (pbc) along the four rectangular faces. The volume concentrations of proteins is taken to match the average concentrations of the human plasma, with g/dl, g/dl and g/dl, at plasma concentration in blood. When a protein is adsorbed on (released by) the surface, we keep its bulk concentrations constant by inserting (deleting) a protein of the same family in a randomly-chosen empty (occupied) space of the box.
Experiments are usually carried out for highly diluted plasma, at concentration as small as , to slow down the adsorption rate to minutes or hours, allowing precise measurements. However, such low rates would decrease the statistics of our MD simulations. We, therefore, perform our simulations in conditions that are closer to those of practical interest, with as high as , and , by considering different sizes of the simulation box while keeping constant the initial number of proteins, their relative proportions, and the size of the adsorption surface. For each we average the results over fourteen independent runs, starting from independent initial configurations that have been equilibrated by applying pbc in any direction.
IV Results and Discussion
IV.1 Competitive Adsorption
We find that protein surface concentrations , for Alb and IgG, are non-monotonic in time (Fig. 2). In particular, for any considered , Alb is the first protein that reaches the surface, due to its larger diffusive constant. This property induces an increase of . When the second fastest and second most affine protein, IgG, diffuses to the surface, it displaces Alb, leading to a decrease of and an increase of . Finally Fib, which is the slowest and most affine protein to the surface, takes over decreasing and increasing . Each saturates toward an equilibrium value at long times, while the total surface concentration of proteins is saturated at early times. This behavior qualitatively reproduces the Vroman effect, apart from the behavior of Fib that here is monotonic, while in experiments has a maximum due to the competitive adsorption with heavier and more surface-affine plasma proteins, like the high molecular weight Kininogen, not included in our model LeDuc et al. (1995); Turbill et al. (1996).
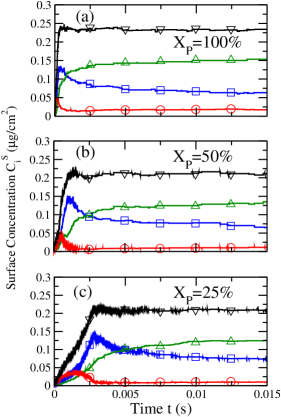
IV.2 Effect of Plasma Dilution
When is reduced the dynamics of the process slows down (Fig. 3). This is consistent with what is observed in experiments Brash and ten Hove (1984) and was reproduced by kinetic models with displacement rates, “liberation” rates and semipermanently adsorbed state for Fib LeDuc et al. (1995). Here we can observe the slowing down not only for Fib, but also for the competing proteins IgG and Alb.
It is interesting to observe that at short-times the surface concentration of Fib increases more than linearly with time. This is more evident at low (Fig. 3a). This behavior has been predicted in other models for single protein adsorption including conformational changes and has been noted that it is not reproduced by standard Langmuir kinetics Adamczyk and Weronski (1995). It can be understood as a consequence of the ability of Fib to adsorb in both its “laying down” and “standing up” conformation that is not captured by standard Langmuir kinetics. This stage can be considered as the first step of Fib adsorption and occurs when the competitions with the other proteins is not strong, i.e. when the total surface concentration has not reached its saturation (Fig. 3d).
IV.3 Three-steps adsorption
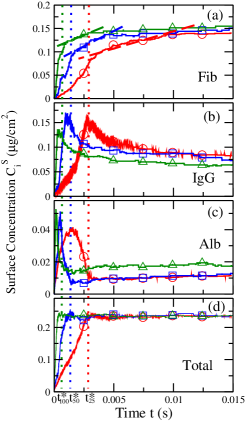
By increasing the dilution (i.e. reducing ) all the surface concentrations tends toward the same large-time limit (Fig. 3). Alb concentration reaches a shallow minimum at a time that depends on and approximately corresponds to that of maximum surface concentration of IgG.
This time coincides, within our numerical precision, also with the beginning of a “linear” regime, i.e. a regime of constant adsorption rate, for the Fib. This linear regime represent a second step in the Fib adsorption and precedes a third step during which saturates. This three-steps kinetics has been experimentally observed, and numerically reproduced, in single protein adsorptions on thin SiO2 layers, both hydrophilic or with an additional hydrophobic monolayer, at room temperature and at 37.5 ∘C Quinn et al. (2008); Bellion et al. (2008). The authors of those works interpreted this behavior as a consequence of protein diffusion at the surface and of the occurrence of conformational changes. However, they did not study the case with competitive adsorption.
Here, instead, we observe that the regime of constant Fib adsorption rate coincides with the IgG desorption and the slow re-adsorption of Alb. This suggests that the reorganization of the proteins at the surface is likely to involve all the three families of proteins at the same time, in a way that is far more complicated than the usual two-states models based on kinetics equations with “transition” rate constants. Indeed, standard Langmuir kinetics would be able to predict the general trend of slowing down for increasing dilution Masel (1996), but is unable to reproduce the three-steps kinetics, even in single protein adsorption, when conformational changes take place Adamczyk and Weronski (1995); Quinn et al. (2008); Bellion et al. (2008).
The second step starts, at , when the total surface concentration is saturated (Fig. 3d). Therefore, new arriving Fib adsorbs in the “laying down” conformation if possible, or, with less energy gain but occupying less space, in the “standing up” conformation. Since at the IgG concentration is at its maximum, the probability that the new Fib adsorbs near a IgG (as in Fig.1d) is high, determining a strong repulsion between the two charged proteins. This repulsion is stronger than the attraction of IgG with the surface, determining the displacement of the IgG and the decrease of .
This displacement leaves enough space on the surface for the adsorption of the smaller Alb that is abundant in suspension. As a consequence, increases. Despite Alb lower affinity to the surface, its small size allows the protein to fit onto the free surface without experiencing strong repulsion with the Fib. Therefore, at this stage Alb and Fib are not necessarily competing between them, but are both competing with the IgG.
However, at larger time, when more Fib arrives to the surface, the competition is strong among all the three proteins. This induces the end of the re-adsorption of Alb and forces further conformational changes for the Fib (as in Fig.1c). Our calculations support the identification of the third adsorption step, i.e. the end of the regime of constant Fib adsorption rate, with the end of the re-adsorption of Alb. This is more evident for the the lowest dilution, , while is more speculative for the other values of .
IV.4 Effect of Energy Depletion
Next, we study how energy depletion of the protein solution affects the sequence of adsorption. In experiments the energy is controlled by adding sodium azide, or other depletion-energy chemical agents, to the protein solution Shapero et al. (2011). Here, for sake of simplicity, we decrease , reducing the kinetic energy of the solution, but neglecting possible effects of the protein stability (Fig. 4).
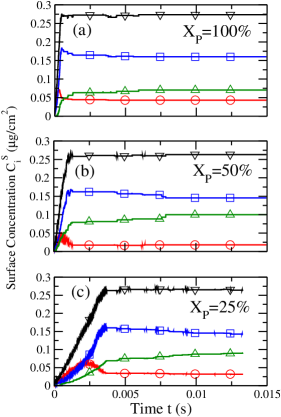
We find () that, although the surface affinity of Fib is stronger than that for IgG, the latter becomes the dominant protein adsorbed on the surface for long time scales; () that, by changing , the time scale of the process becomes longer, but the inversion of the protein concentration is always present. Hence, the energy depletion leads to an inversion of the Vroman effect.
By comparing the results at different energies, , and same (Fig. 2-4), we observe only a week energy-dependence of the times at which each reaches its maximum. Hence, the time-scales of the process are mainly controlled by the total plasma concentration , while the slowing-down due to the reduced diffusion seems to be less relevant.
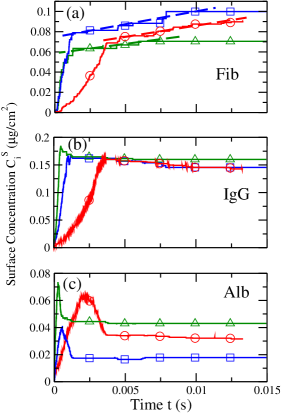
By comparing the at different for the same protein (Fig. 5), we find that second step in the Fib adsorption is now more extended in time. This result is consistent with what has been observed in the experiments from single protein absorption when conformational changes occur Bellion et al. (2008). Moreover, our analysis for competitive adsorption shows, as for K, that the linear regime of Fib adsorption coincides with the end of the desorption of the Alb and the beginning of desorption of IgG. However, at K, the ability of Fib to displace IgG is much more limited than at K, because the displacement requires too much energy. This fact, on one hand, limits the adsorption of Fib, on the other hand does not allows Alb to re-adsorb. Nevertheless, the competition between Fib and IgG is enough to stop the desorption of Alb that now saturates at a value higher than for K at any .
Another not intuitive result is that at K the adsorption behavior is less regular than at K. For example, at the lowest the Fib seems to adsorb more than at the highest, , and less than at the intermediate . A similar non-monotonic behavior characterizes also the Alb absorption, but now the is higher when is lower and vice versa. These results suggest that, under this condition, the strongest competition is between Alb and Fib, because IgG is almost not displaced from the surface. Furthermore, at Fib does not reach the third step of adsorption, suggesting that the kinetics is so slow that it does not allow the Fib to perform large conformational changes.
IV.5 Change of the Bioenvironment
Once we have understood that the protein layer covering the surface is controlled by the energy depletion of the system, it is interesting to ask if a sudden change of external conditions could induce a different composition of this layer, determining different biomimetics surface properties. This situation could occur, for example, when a medical device is manipulated in a bioenvironment whose composition is externally controlled during a surgery Cloud et al. (2008). In particular, we study the case in which the system is first equilibrated under energy-depleted conditions and subsequently undergoes a sudden change that reestablishes the normal conditions (Fig. 6).
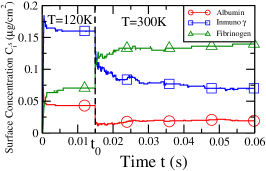
At short times the energy-depleted system evolves until the equilibrium concentrations are reached. Under these conditions, as discussed (Fig. 4), the dominant protein is IgG instead of Fib. At time we switch to normal conditions, forcing the system out of equilibrium. As a consequence, the system re-enters a transitory situation in which the concentrations evolve until they reach their new equilibrium values at long times. In the specific case considered here, we observe a fast change in the surface concentrations, with of Fib overcoming of IgG, being the first, under normal conditions, more stable on the surface than the second. The final equilibrium concentrations are reached at large times. We observe also a sudden change in of Alb, between the two equilibrium concentrations characteristics of the two values of the external parameters . However, always equilibrates to a value that is smaller then and , consistent with its long-time values in Fig. 2-4. By decreasing , we find the same qualitative behavior for a sudden energy-change, but with the transient regime extending to longer times, consistent with Fig. 4. Hence, at experimental values of the switching behavior would occur on time scales that are comparable to those characteristic of the Vroman effect.
IV.6 Reversible vs Irreversible Adsorption
We remark that our predictions about inverting the Vroman effect by changing the experimental control parameters should hold only if the protein adsorption on the surface is reversible. If the adsorption is, instead, irreversible the change of external parameters should not lead to a new composition of the protein layer. Indeed, under many practical conditions of interest for blood plasma, it would appear that the binding is indeed mostly irreversible Monopoli et al. (2011); Lundqvist et al. (2011). Hence, the switching protocol proposed above represents a possible experimental way to evaluate how strongly irreversible is the adsorption process on a specific surface.
For an irreversible adsorption process, our findings predict that by appropriately controlling the parameters of the protein solution, such as the amount of depleted energy, it is possible to engineering a specific biomimetic covering of a surface. Due to the irreversibility, the proteins, once adsorbed, cannot easily desorb from the surface, even if the external conditions are modified. Therefore, it is feasible to cover a device surface with any desired protein composition, targeted to a specific biomimetic property, by selecting an appropriate initial condition. Subsequently, the device could be used under physiological conditions with no further changes of the protein cover and its biomimetic properties.
V Conclusions
We study, by MD simulations of a coarse-grained model, the Vroman effect for a ternary protein solution mixture, with Alb, IgG and Fib, in contact with a hydrophobic surface. We show that the effect is the consequence of the differences among the proteins properties: mass and size, affinity, diffusion constant, conformational changes. These differences lead to a process of competitive adsorption on a surface, in which the different families of proteins occupy sequentially the surface, replace each other and diffuse at the surface, until an equilibrium situation is reached. By decreasing the total concentration of protein in the solution, keeping the relative concentrations fixed, the time scales of the process increase and the maxima of surface concentration for each family of proteins occur at longer times.
Our model confirms the intuitive understanding that the sequence of surface occupation is a consequence of a competition between the smaller and faster, but less affine, proteins with the more affine, but bigger and slower, proteins. For example, we test that by increasing the Alb affinity, or artificially setting to the same value all the diffusion constants, the Vroman effect disappears. Therefore, affinity and diffusion constant are relevant protein parameters for the effect as can be deduced by standard kinetics equation models. Nevertheless, our model reveals that the mechanisms of competitions are likely to be more complex that what the intuition would suggest, when conformational changes occurs, with regimes during which small and large proteins are not necessarily competing between them, but are both competing with others in solution.
We find that the protein surface concentrations at equilibrium depend on external control parameters. In particular, we find that energy depletion induces a drastic change in the composition of the covering protein-layer, leading to an inversion of the Vroman effect. Our results show that the inversion can be used to quantify how strongly irreversible is the process of surface adsorption of the proteins, an information useful in studies of thromboembolic events Uniyal and Brash (1982). Furthermore, these results suggest the possibility of engineering the composition of the protein layer covering a surface in a controlled way, a feature particular relevant in biomimetic applications.
Acknowledgments
We thank C. berg, F. Baldelli Bombelli, M. P. Monopoli and O. Vilanova for discussions. We acknowledge the support of EU FP7 grant NMP4-SL-2011-266737; PV and GF of Spanish MEC grant FIS2012-31025 co-financed FEDER.
References
- Cedervall et al. (2007) T. Cedervall, I. Lynch, S. Lindman, T. Berggård, E. Thulin, H. Nilsson, K. A. Dawson and S. Linse, Proceedings of the National Academy of Sciences, 2007, 104, 2050–2055.
- Monopoli et al. (2011) M. P. Monopoli, D. Walczyk, A. Campbell, G. Elia, I. Lynch, F. Baldelli Bombelli and K. A. Dawson, Journal of the American Chemical Society, 2011, 133, 2525–2534.
- Kim et al. (2012) J. A. Kim, C. Aberg, A. Salvati and K. A. Dawson, Nat Nano, 2012, 7, 62–68.
- Walczyk et al. (2010) D. Walczyk, F. B. Bombelli, M. P. Monopoli, I. Lynch and K. A. Dawson, Journal of the American Chemical Society, 2010, 132, 5761–5768.
- Oberdörster et al. (2009) G. Oberdörster, A. Elder and A. Rinderknecht, J. Nanosci. Nanotechnol., 2009, 9, 4996–5007.
- Tengvall et al. (1998) P. Tengvall, I. Lundström and B. Liedberg, Biomaterials, 1998, 19, 407–422.
- Vroman (1962) L. Vroman, Nature, 1962, 196, 476–477.
- Ortega-Vinuesa and Hidalgo-Álvarez (1995) J. L. Ortega-Vinuesa and R. Hidalgo-Álvarez, Biotechnology and Bioengineering, 1995, 47, 633–639.
- Holmberg and Hou (2009) M. Holmberg and X. Hou, Langmuir, 2009, 26, 938–942.
- Jackson et al. (2000) D. R. Jackson, S. Omanovic and S. G. Roscoe, Langmuir, 2000, 16, 5449–5457.
- LeDuc et al. (1995) C. A. LeDuc, L. Vroman and E. F. Leonard, Industrial & Engineering Chemistry Research, 1995, 34, 3488–3495.
- Green et al. (1999) R. Green, M. Davies, C. Roberts and S. Tendler, Biomaterials, 1999, 20, 385—391.
- Noh and Vogler (2007) H. Noh and E. A. Vogler, Biomaterials, 2007, 28, 405–422.
- Ding and Hlady (2011) Y.-X. Ding and V. Hlady, Croat Chem Acta., 2011, 84, 193–202.
- Lassen and Malmsten (1996) B. Lassen and M. Malmsten, Journal of Colloid and Interface Science, 1996, 180, 339–349.
- Lassen and Malmsten (1997) B. Lassen and M. Malmsten, Journal of Colloid and Interface Science, 1997, 186, 9–16.
- Barnthip et al. (2009) N. Barnthip, P. Parhi, A. Golas and E. A. Vogler, Biomaterials, 2009, 30, 6495–6513.
- Lu et al. (1994) C. F. Lu, A. Nadarajah and K. K. Chittur, Journal of Colloid and Interface Science, 1994, 168, 152–161.
- Brash and Horbett (1995) J. L. Brash and T. A. Horbett, in Proteins at Interfaces, American Chemical Society, Washington, DC, 1995, pp. 1–23.
- Slack and Horbett (1995) S. M. Slack and T. A. Horbett, in The Vroman Effect, American Chemical Society, Washington, DC, 1995, pp. 112–128.
- Dejardin et al. (1995) P. Dejardin, P. ten Hove, X. J. Yu and J. L. Brash, Langmuir, 1995, 11, 4001–4007.
- Jung et al. (2003) S.-Y. Jung, S.-M. Lim, F. Albertorio, G. Kim, M. C. Gurau, R. D. Yang, M. A. Holden and P. S. Cremer, Journal of the American Chemical Society, 2003, 125, 12782–12786.
- Hirsh et al. (2013) S. L. Hirsh, D. R. McKenzie, N. J. Nosworthy, J. A. Denman, O. U. Sezerman and M. M. M. Bilek, Colloids and Surfaces B: Biointerfaces, 2013, 103, 395–404.
- Cuypers et al. (1987) P. A. Cuypers, G. M. Willems, H. C. Hemker and W. T. Hermens, Annals of the New York Academy of Sciences, 1987, 516, 244–252.
- Lundström and Elwing (1990) I. Lundström and H. Elwing, Journal of Colloid and Interface Science, 1990, 136, 68–84.
- Roach et al. (2005) P. Roach, D. Farrar and C. C. Perry, Journal of the American Chemical Society, 2005, 127, 8168–8173.
- Wei et al. (2012) T. Wei, M. A. Carignano and I. Szleifer, The Journal of Physical Chemistry B, 2012, 116, 10189–10194.
- Tozzini (2005) V. Tozzini, Current Opinion in Structural Biology, 2005, 15, 144–150.
- Bale et al. (1988) M. D. Bale, D. F. Mosher, L. Wolfarht and R. C. Sutton, Journal of Colloid and Interface Science, 1988, 125, 516–525.
- Franzese et al. (2011) G. Franzese, V. Bianco and S. Iskrov, Food Biophysics, 2011, 6, 186–198.
- Gallo et al. (2011) P. Gallo, D. Corradini and M. Rovere, Physical Chemistry Chemical Physics, 2011, 13, 19814–19822.
- Lund et al. (2008) M. Lund, P. Jungwirth and C. E. Woodward, Physical Review Letters, 2008, 100, 258105–.
- Ravichandran and Talbot (2000) S. Ravichandran and J. Talbot, Biophysical journal, 2000, 78, 110–120.
- Oberholzer et al. (1997) M. R. Oberholzer, N. J. Wagner and A. M. Lenhoff, The Journal of Chemical Physics, 1997, 107, 9157–9167.
- Ruggiero et al. (1999) C. Ruggiero, M. Mantelli, A. Curtis, S. Zhang and P. Rolfe, 1999, 37, 119–124.
- Bellion et al. (2008) M. Bellion, L. Santen, H. Mantz, H. Hähl, A. Quinn, A. Nagel, C. Gilow, C. Weitenberg, Y. Schmitt and K. Jacobs, Journal of Physics: Condensed Matter, 2008, 20, 404226.
- Malmsten et al. (1997) M. Malmsten, D. Muller and B. Lassen, Journal of Colloid and Interface Science, 1997, 193, 88–95.
- Galisteo-González et al. (1994-03-01) F. Galisteo-González, A. Martín-Rodríguez and R. Hidalgo-Alvarez, Colloid & Polymer Science, 1994-03-01, 272, 352–358.
- Mücksch and Urbassek (2011) C. Mücksch and H. M. Urbassek, Langmuir, 2011, 27, 12938–12943.
- Turbill et al. (1996) P. Turbill, T. Beugeling and A. Poot, Biomaterials, 1996, 17, 1279–1287.
- Brash and ten Hove (1984) J. L. Brash and P. ten Hove, Thrombosis and Haemostasis, 1984, 51, 326.
- Adamczyk and Weronski (1995) Z. Adamczyk and P.-l. Weronski, Langmuir, 1995, 11, 4400–4410.
- Quinn et al. (2008) A. Quinn, H. Mantz, K. Jacobs, M. Bellion and L. Santen, EPL, 2008, 81, year.
- Masel (1996) R. I. Masel, in Principles of adsorption and reaction on solid surfaces, Wiley Interscience, 1996, p. 240.
- Shapero et al. (2011) K. Shapero, F. Fenaroli, I. Lynch, D. C. Cottell, A. Salvati and K. A. Dawson, Mol. BioSyst., 2011, 7, 371–378.
- Cloud et al. (2008) A. N. Cloud, S. Kumar, M. Kavdia, H. H. Abu-Safe and M. H. Gordon, Surface and Coatings Technology, 2008, 203, 913–917.
- Lundqvist et al. (2011) M. Lundqvist, J. Stigler, T. Cedervall, T. Berggård, M. B. Flanagan, I. Lynch, G. Elia and K. Dawson, ACS Nano, 2011, 5, 7503–7509.
- Uniyal and Brash (1982) S. Uniyal and J. L. Brash, Thrombosis and Haemostasis, 1982, 47, 285–90.