e-mail: vb@iop.kiev.ua††thanks: 41, Nauky Av., Kyiv 03680, Ukraine††thanks: 53, Leninsky Prospect, Moscow 119991, Russia††thanks: 72, Prosp. Gagarina, Dnipropetrovsk 49050, Ukraine††thanks: 13, Pokrovskaya Str., Kyiv 04070, Ukraine††thanks: 31, Nauky Av., Kyiv 03028, Ukraine
Secondary emission from synthetic opal infiltrated by colloidal gold and glycine
Abstract
A comparison of the secondary emission (photoluminescence) and Bragg reflection spectra of photonic crystals (PC), namely, synthetic opals, opals infiltrated by colloidal gold, glycine, and a complex of colloidal gold with glycine is performed. The infiltration of colloidal gold and a complex of colloidal gold with glycine into the pores of PC causes a short-wavelength shift (about 5–15 nm) of the Bragg reflection and increases the intensity of this band by 1.5–3 times. In photoluminescence, the infiltration of PC by colloidal gold and colloidal gold with glycine suppresses the PC emission band near 375–450 nm and enhances the shoulder of the stop-zone band of PC in the region of 470–510 nm. The shape of the observed PC emission band connected with defects in synthetic opal is determined by the type of infiltrates and the excitation wavelength. Possible mechanisms of the effects are discussed.
1 Introduction
Synthetic opal is known as one of the typical photonic crystals (PC) [1]. The PC optical property study in the region of the forbidden zone and its vicinity is of interest for fundamental investigations and technical applications. A modification of the stop-zone properties could be done by the infiltration of different dielectrics, metals, and organic molecules into the pores of PC [2, 3]. Thus, it was shown in [4] that the minimum of the luminescence intensity of synthetic opal is registered in a region, where the Bragg reflection maxima occur. Radiative photon modes go out freely from PC, while bounded photonic modes always exist inside the globules of big sizes. These modes are not radiative due to their total internal reflection on the surface of globule sphere.
The introduction of NaNO2 (non-organic dye) into the PC pores has led to changes of the secondary emission spectra [5, 6]. Namely, in a thin crystal for the transmittance mode, the fluorescence of NaNO2 is suppressed, while a flash of the intensive irradiation is observed on the PC stop-zone boundary near nm. This emission is shifted to the long-wavelength region in comparison with the spectral position of the absorption of the initial radiation by the stop-zone, and the emission intensity was of that of the excitation radiation. Changes in the spectra of synthetic opals occur also when the crystal thickness grows [7].
In [2], it was shown that photonic crystals display the effect of ‘‘hidden box’’ for biological molecules infiltrated into the opal pores. Spherical gold nanoparticles in a colloidal solution show a plasmon resonance close to the opal stop-zone. In the present paper, the Bragg reflectance and the secondary emission (photoluminescence) of synthetic opals infiltrated by aqueous colloidal gold, glycine, and a complex of colloidal gold with glycine are studied. A possible mechanism of the observed effects is discussed.
a b
2 Materials and Methods
Nanodisperse silica globules were synthesized by the Stober method, followed by the natural sedimentation and the annealing in air at a temperature of C. The annealing is necessary to remove the organic components of a buffer solution from the pores of opal [1]. The size of the fabricated opal crystals was mm. For the infiltration of PC, we have used a colloidal aqueous solution of 10–20-nm gold nanoparticles (40 mg/l), a 1-mg/ml aqueous solution of an -Gly powder (Sigma), as well as a complex of colloidal gold with glycine molecules prepared as a result of mixing the above-mentioned solutions according to the ratio: 5 volume parts of the aqueous glycine solution, 2 – the colloidal aqueous gold solution, and 3 – distilled water. The process of infiltration has been made by the multiple ‘‘drop and dry’’ procedure of the corresponding solution (10 mcl) on the PC surface and the consecutive drying of them at room temperature. The structure of the samples and optical properties have been characterized with SEM analysis, optical spectroscopy of the visible range, and luminescence. SEM images of opals were obtained with an EPMA SEI JXA-8200 microscope. The reflectance of nonpolarized light in the visible spectral range was measured with a spectrophotometer based on a DMR-4 monochromator at different (10∘, 20 and 30∘) angles of incidence. The spectra of fluorescence have been registered with a Perkin Elmer LS-55 fluorescence spectrometer under excitation with = 255 and 370 nm with long-pass filters, 290 and 390 nm, respectively.
3 Results of Experiments
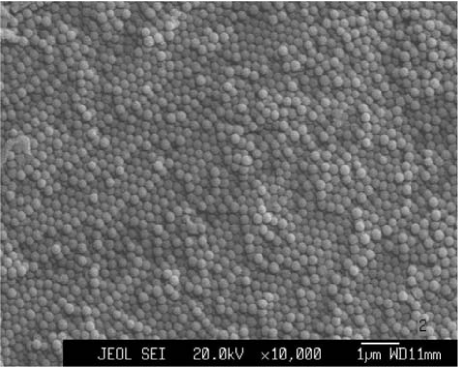
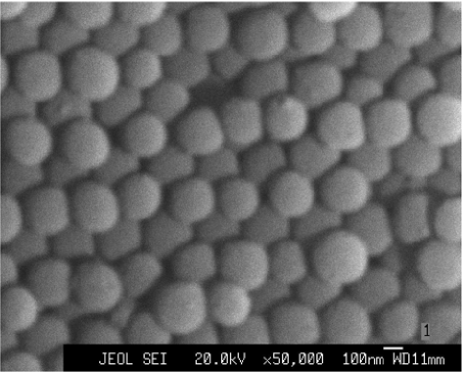
The SEM images of synthetic opal are presented in Fig. 1. The diameter () of globules was estimated as 240 nm, and the size of cavities as 30–50 nm.
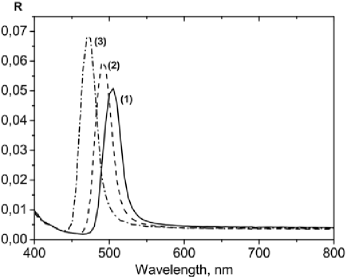
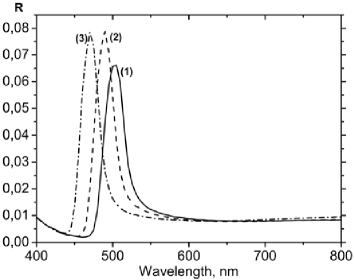
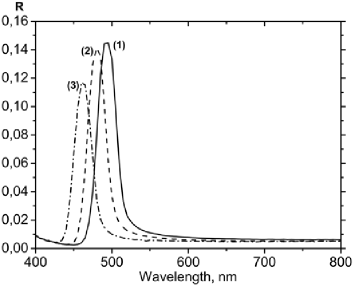
The reflection spectra of initial synthetic opals, opals with colloidal gold, and opal with complex of colloidal gold and glycine in the visible region are presented in Fig. 2. The Bragg reflection for initial opal is observed in the region of 470–510 nm. This region displays the stop-zone of PC. The obtained data correlate well with the calculation of (111) Bragg maximum for a photonic crystal built from silica globules with the diameter nm according to the formula
| (1) |
Here, the effective refractive index , where , for air or for the aqueous solution, is the filling factor for a dense packing of equal spheres. As one can see from Fig. 2,(a–c), the Bragg reflection maximum displays a short-wavelength shift from 505 nm for initial opal to 500 nm after the introduction of colloidal gold in PC and to 495 nm after the introduction of a colloidal gold-glycine complex. Additionally, after the introduction of colloidal gold and colloidal gold with glycine in PC, an increase of the Bragg maximum intensity by 1.5 and 3 times, respectively, is observed.
a
b
c
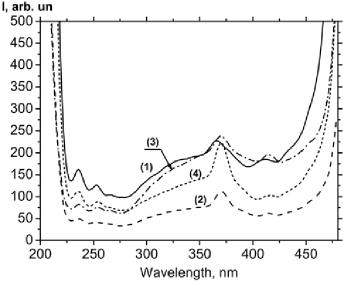
We have registered the photoluminescence excitation spectra at nm at the normal incidence of light to the surface of PC in the backscattering geometry. The excitation spectra show 3 intense bands (Fig. 3) with maxima at 236, 250, and 360 nm. In [4], the band at 250 nm was attributed to the zone-zone transition in SiO2. Under the infiltration of PC with colloidal gold and glycine, the band at 360 nm was shifted to the long wavelength region.
a
b
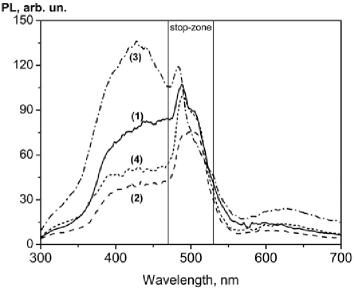
The photoluminescence spectra have been registered for initial opal, as well as for opals infiltrated by colloidal gold, glycine, and complex of colloidal gold with glycine (Fig. 4). After the infiltration of colloidal gold, a decrease of the intensity of the band at 375–450 nm was observed. Under the introduction of glycine in opal, the intensity of the peak near 500 nm is suppressed. The observed features in the photoluminescence spectra could be explained by the close location of the PC stop-zone and the plasmon resonance region in gold nanoparticles to the region of emission of initial opal and the fluorescence property of gold particles [8]. Thus, it was shown in [9] that gold particles have a plasmon resonance near 530 nm. Meanwhile, the gold particles or gold rough surface show the photoluminescence in the visible region [8]. This effect could lead to the formation of a complex fluorescence band of PC with colloidal gold and suppress an influence of the stop-zone in the region of appearance of plasmonic effects. However, at a certain frequency, we could get an essential enhancement of the emission signal as well.
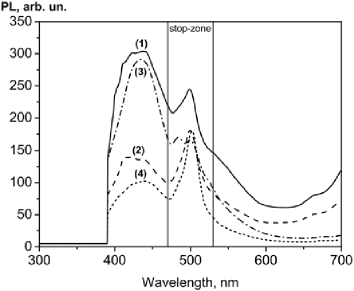
Three bands become apparent in the spectra of secondary emission of initial and modified synthetic opal under the excitation with (Fig. 4,a) and 370 nm (Fig. 4,b): 1) 375–450 nm, 2) 490-500 nm, 3) 650-670 nm. These bands are connected with defects and admixtures. For example, according to [10], the band at 523 nm could be assigned to the surface state of Si–H with an energy of 2.37 eV; the band at 625 nm could be assigned to the volume state of Si–O with an energy of 1.9 eV, and the band at 692 nm – to the surface state of Si–O (1.79 eV). However, the band in the region near 400 nm is under discussions [10], and it can be connected with different admixtures in chemically grown SiO2 globules, for example, with ZrO2 [11], etc.
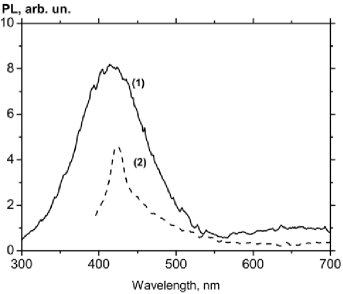
Due to the infiltration of PC with colloidal gold, we have observed the enhancement of the emission at 500 nm by 1.5 times and the suppression of the emission at 375–450 nm (Fig. 4,a). The infiltration of opal by glycine leads to the enhancement of a wide emission band near 434 nm by 3 times with a simultaneous decrease of the band at 500 nm. In the case of the infiltration of opal with the complex of colloidal gold with glycine, we have registered an increase of the intensity of both 500 nm and 434 nm bands by 2 times simultaneously. These changes could be caused by the enhancement of a local field near the surface of PC, as well as by plasmonic effects due to the presence of colloidal gold. Note that colloidal gold in an aqueous solution under the excitation with and 370 nm reveals a very weak emission in the region of 420–450 nm (Fig. 5). The intensity of this emission is about two orders less than the emission from opal.
4 Conclusions
The investigation of the Bragg reflection and secondary emission spectra of synthetic opals, opals infiltrated by colloidal gold, glycine, and the complex of colloidal gold with glycine is performed. The Bragg reflection band of PC is shifted by 5–15 nm to the short wavelength side under the infiltration of opal, and the intensity of this band increases by 1.5-3 times. Opal reveals a complex photoluminescence band in a vicinity of 350–550 nm. The shape of the emission band connected with defects in synthetic opal is determined by the excitation wavelength and the type of infiltrated substances. The suppression of the emission band (375–450 nm) and an enhancement of the shoulder (470–510 nm) of the stop-zone band under the infiltration of opal with colloidal gold and colloidal gold with glycine could be caused by plasmonic effects and the influence of the increased density of photonic states on the boundary of the PC stop-zone.
We thank Ukrainian-Russian project 4/11-24 ‘‘The glow of three-dimensional photonic crystals for optical and electrical excitation’’ for the financial support.
References
- [1] V.S. Gorelik, Quant. Electr. 37, 409 (2007).
- [2] V. Boyko, G. Dovbeshko, O. Fesenko, V. Gorelik, V. Moiseyenko, V. Romanyuk, T. Shvets, and P. Vodolazkyy, Mol. Cryst. Liq. Cryst 535, 30 (2011).
- [3] G. Dovbeshko, O. Fesenko, V. Moiseyenko, V. Gorelik, V. Boyko, and V. Sobolev, Semicond. Phys., Quant. Electr. and Optoelectr. 11, 392 (2008).
- [4] A.N. Gruzintsev, G.A. Emel’chenko, V.M. Masalov, and Е.Е. Yakimov, Neorgan. Mater. 45, 302 (2009).
- [5] V.S. Gorelik, A.A. Esakov, and A.B. Fadyushin, Bull. of Lebedev Phys. Inst., Issue 10, 8 (2006).
- [6] Yu.P. Voinov, N.F. Gabitova, V.S. Gorelik, L.I. Zlobina, and P.P. Sverbil’, Phys. of Solid State 51, 1333 (2009).
- [7] V.S. Gorelik, Phys. of Solid State 51, 1252 (2009).
- [8] G.T. Boyd, Z.H. Yu, and Y.R. Shen, Phys. Rev. B 33 7923 (1986).
- [9] J.J. Panek, A. Jezierska, A. Koll, G. Dovbeshko, and O. Fesenko, Chem. Phys. Chem. 12, 1 (2011).
- [10] Yu.D. Glinka, S.-H. Lin, and Y.-T. Chen, Phys. Rev. B 62, 4733 (2000).
-
[11]
A.N. Gruzintsev, G.A. Emel’chenko, V.M. Masalov, M. Romanelli,
C. Barthou, P. Benalloul, and A. Maitre, Neorgan. Mater. 44, 203
(2008).
Received 14.10.11
ВТОРИННА ЕМIСIЯ СИНТЕТИЧНИХ ОПАЛIВ,
IНФIЛЬТРОВАНИХ КОЛОЇДНИМ
ЗОЛОТОМ
ТА ГЛIЦИНОМ
Г.I. Довбешко, O.M. Фесенко, В.В. Бойко, В.Р.
Романюк,
В.С. Горєлiк, В.М. Моiсеєнко, В.Б. Соболєв, В.В.
Швалагiн
Р е з ю м е
Проведено порiвняльний аналiз вторинної емiсiї
(фотолюмiнесценцiї) та брегiвського вiдбивання фотонних кристалiв
(синтетичних опалiв), iнфiльтрованих колоїдним золотом, глiцином та
комплексом колоїдного золота з глiцином. Iнфiльтрацiя колоїдного
золота та його комплексу з глiцином в пори фотонного кристала
привела до короткохвильового (на 5–15 нм) зсуву максимуму
брегiвського вiдбиття та зростання його iнтенсивностi в 1,5–3 рази.
У фотолюмiнесценцiї iнфiльтрацiя колоїдного золота та комплексу
колоїдного золота з глiцином у пори фотонного кристала приводить до
пригнiчення смуги поблизу 375–450 нм та до пiдсилення смуги поблизу
краю стоп-зони на 470–510 нм. Форма смуги фотолюмiнесценцiї опалу,
що викликана його дефектами та домiшками, визначається довжиною
хвилi збуджуючого випромiнювання та типом iнфiльтрату. Обговорено
можливi механiзми ефектiв, що спостерiгаються.