Single crystals of DPPH grown from diethyl ether and carbon disulfide solutions — Crystal structures, IR, EPR and magnetization studies
Abstract
Single crystals of the free radical 2,2-diphenyl-1-picrylhydrazyl (DPPH) obtained from diethyl ether (ether) and carbon disulfide (\ceCS2) were characterized by the X-ray diffraction, IR, EPR and SQUID magnetization techniques. The X-ray structural analysis and IR spectra showed that the DPPH form crystallized from ether (DPPH1) is solvent free, whereas that one obtained from \ceCS2 (DPPH2) is a solvate of the composition 4 DPPH \ceCS2. Principal values of the -tensor were estimated by the X-band EPR spectrometer at room and low (10 K) temperatures. Magnetization studies revealed the presence of antiferromagnetically coupled dimers in both types of crystals. However, the way of dimerization as well as the strength of exchange couplings are different in the two DPPH samples, which is in accord with their crystal structures. The obtained results improved parameters accuracy and enabled better understanding of properties of DPPH as a standard sample in the EPR spectrometry.
keywords:
DPPH , crystal structure , diethyl ether , carbon disulfide , EPR , magnetization1 Introduction
The stable aromatic free radical 2,2-diphenyl-1-picrylhydrazyl (DPPH) is one of the first and most widely used standard samples for determination of the -factors of the spin species and for measuring the unpaired spin concentration using electron paramagnetic resonance (EPR) [1]. DPPH was synthesized in 1922, and its EPR spectrum was recorded for the first time in 1950 [2]. Chemical stability of DPPH and its very narrow spectral line have led to the widespread use of the powder form of this radical as an EPR standard [3]. Single crystals of DPPH are also frequently used in EPR spectroscopy because the linewidth they produce is considerably narrower than that of the powder form.
Various types of DPPH crystals have been prepared up to now — some of them are solvent free and some contain molecules of solvation [4]. In the Cambridge Structural Database [5] crystal structures of two DPPH solvates, one with acetone [6] and the other with benzene [7], are deposited. The benzene solvate was also investigated by neutron diffraction [3]. Some preliminary X-ray diffraction measurements, done by Williams [8], indicated that the DPPH crystal forms obtained from diethyl ether (ether; orthorhombic crystal system) and carbon disulfide (\ceCS2; triclinic crystal system) were both solvent free. However, their crystal structures have never been solved, i.e. no atomic coordinates have been deposited in the Cambridge Structural Database [5].
More recently, a new application of DPPH — in detecting local fields in the close vicinity of the surface of superconductors [9, 10] and single molecule magnets [11] — has been established in our laboratory. These results prompted us to investigate the properties of DPPH in more details.
In this paper, we report on the single-crystal X-ray diffraction study, as well as the IR, EPR and SQUID magnetization measurements of the two Williams’ ”solvent-free” forms [8] of DPPH, i.e. the one grown from ether (DPPH1) and the other form crystallized from \ceCS2 (DPPH2). A detailed structural analysis showed that the orthorhombic DPPH form (crystallized from ether), in accord with the previous preliminary measurements [8], does not really contain solvent molecules; however, the triclinic DPPH form (crystallized from \ceCS2), believed to be solvent free for 40 years, is actually a solvate with the stoichiometry 4 DPPH \ceCS2. This form is isostructural with the acetone solvate, 4 DPPH \ceCH3COCH3 [6]. In addition, it has been shown that magnetic properties of these two kinds of DPPH crystals are quite different.
2 Material and methods
2.1 Materials
DPPH was purchased from commercial sources and used without further purification. Elemental analysis for C, H and N was carried out using a Perkin Elmer Model 2400 microanalytical analyzer.
2.2 Preparation of the single crystals
DPPH1. Crystals of DPPH1 were grown from a solution of DPPH in ether. The tightly closed reaction beaker was kept in a refrigerator. The dark needle-like crystals were obtained after two days. Anal. calcd for \ceC18H12N5O6 (): C, 54.83; H, 3.07; N, 17.76. Found: C, 54.48; H, 3.32; N, 17.62%. IR data (KBr): = 3085 (w), 3071 (vw), 1598 (s), 1575 (s), 1523 (s), 1479 (m), 1460 (w), 1453 (w), 1434 (w), 1408 (w), 1324 (vs), 1292 (sh), 1212 (s), 1171 (m), 1073 (s), 1024 (w), 997 (w), 952 (m), 935 (w), 914 (m), 908 (sh), 842 (w), 833 (sh), 819 (w), 787 (m), 755 (s), 740 (m), 724 (m), 712 (m), 703 (m), 698 (m), 686 (s), 653 (w), 620 (w), 578 (w), 557 (w), 523 (w), 509 (w), 462 (w), 440 (w), 420 (w), 371 (w), 308 (w) cm-1.
DPPH2. Crystals of DPPH2 were grown from a solution of DPPH in \ceCS2. The tightly closed reaction beaker was kept in a refrigerator. The dark needle-like crystals were formed in a period of six days. Anal. calcd for \ceC18H12N5O60.25\ceCS2 (): C, 53.03; H, 2.93; N, 16.94. Found: C, 52.78; H, 3.12; N, 16.79%. IR data (KBr): = 3087 (w), 3069 (vw), 1597 (s), 1574 (s), 1539 (m), 1525 (m), 1512 (s), 1478 (m), 1462 (w), 1453 (w), 1439 (w), 1412 (w), 1326 (vs), 1292 (m), 1210 (m), 1171 (m), 1073 (s), 1025 (w), 996 (w), 951 (m), 936 (w), 914 (sh), 909 (m), 844 (sh), 832 (w), 819 (w), 787 (w), 765 (sh), 757 (s), 739 (m), 715 (s), 703 (s), 698 (sh), 688 (m), 680 (m), 646 (w), 616 (w), 581 (w), 560 (w), 507 (w), 460 (w), 434 (w), 425 (w), 359 (w), 305 (w) cm-1.
2.3 Physical techniques
Crystallography. Single crystals of DPPH1 and DPPH2 were measured on an Oxford Diffraction Xcalibur Nova diffractometer with a microfocus copper tube (Cu radiation) at room temperature ( K). Lowering the temperature drastically increased mosaicity, significantly degrading data quality.
CrysAlis PRO [12] program package was used for data reduction. The structures were solved with SHELXS97 and refined with SHELXL97 [13]. The models were refined using the full-matrix least-squares refinement. All atoms except hydrogen were refined anisotropically; hydrogen atoms were located from the difference Fourier map and refined as riding entities. The atomic scattering factors were those included in SHELXL97 [13]. Molecular geometry calculations were performed with PLATON [14], and molecular graphics were prepared using ORTEP-3 [15] and CCDC-Mercury [16]. Crystallographic and refinement data for the structures reported are shown in Table 1.
Supplementary crystallographic data for this paper can be obtained
free of charge via
www.ccdc.cam.ac.uk/conts/retrieving.html (or from the Cambridge
Crystallographic Data Centre, 12, Union Road, Cambridge CB2 1EZ,
UK; fax: +44 1223 336033; or deposit@ccdc.cam.ac.uk). CCDC 732147
& 732148 contain the supplementary crystallographic data for this
paper.
| DPPH1 | DPPH2 | |
| Chemical formula | \ceC18H12N5O6 | \ceC18H12N5O60.25\ceCS2 |
| Mr / g mol-1 | 394.33 | 413.36 |
| Color | black | black |
| Crystal size / mm | 0.25 x 0.10 x 0.07 | 0.28 x 0.13 x 0.08 |
| Crystal system | orthorhombic | triclinic |
| Space group | ||
| a / Å | 16.7608 (7) | 7.5577 (5) |
| b / Å | 26.8351 (9) | 13.5724 (7) |
| c / Å | 7.8458 (3) | 18.922 (1) |
| / ∘ | 90 | 95.084 (4) |
| / ∘ | 90 | 92.141 (5) |
| / ∘ | 90 | 101.488 (5) |
| V / Å3 | 3528.9 (2) | 1891.6 (2) |
| Z | 8 | 4 |
| / g cm-3 | 1.484 | 1.451 |
| Radiation | Cu | Cu |
| Data collection method | CCD | CCD |
| T / K | 293 (2) | 293 (2) |
| Absorption correction | none | none |
| Measured reflections | 11143 | 19986 |
| Independent reflections | 3664 | 7590 |
| Observed reflections () | 2787 | 3908 |
| 0.0387 | 0.0545 | |
| / ∘ | 76.29 | 76.15 |
| Refinement | ||
| 0.0674 | 0.0639 | |
| 0.1746 | 0.2151 | |
| S | 1.069 | 0.963 |
| No. of reflections | 3664 | 7590 |
| No. of parameters | 523 | 538 |
| H-atom treatment | constrained | constrained |
| , | 0.308; -0.210 | 0.438; -0.391 |
IR spectroscopy. Infrared spectra were recorded as KBr pellets on an ABB Bomem FT model MB 102 spectrometer, in the 4000–200 cm-1 region.
EPR spectroscopy. EPR measurements were performed on the single crystals of DPPH1 and DPPH2. Dimensions of the prepared single crystals were approximately mm3. The crystals were mounted on a quartz holder in the cavity of an X-band EPR spectrometer (Bruker Elexsys 580 FT/CW) equipped with a standard Oxford Instruments model DTC2 temperature controller. The measurements were performed at the microwave frequency around 9.7 GHz with the magnetic field modulation amplitude of 5 T at 100 kHz. The crystals were rotated round three mutually orthogonal axes: a crystallographic axis (the crystals of both DPPH1 and DPPH2 were elongated along the axes), an arbitrary chosen axis perpendicular to and a third axis, perpendicular to both and (because of the thin needle-like form, it was difficult to orientate crystals in the crystallographic and axes). The EPR spectra were recorded at steps. The rotation was controlled by a goniometer with the accuracy of 1–2∘. A larger uncertainty (2–3∘) was related to the optimal deposition of the crystals on the quartz holder. The EPR spectra were measured at two temperatures: room ( K) and low ( K).
Magnetization study. Magnetization of the DPPH1 and DPPH2 samples in the powdered form (about 25 mg) was measured using a commercial MPMS5 SQUID magnetometer. The magnetization was checked to be linear with respect to the applied magnetic field up to 5 T for both compounds at several temperatures (2, 5 and 50 K). The temperature dependence of magnetization was measured in the applied magnetic fields of 0.1 and 1 T, in the temperature range 1.9–290 K. For each particular compound, measurements in the two different magnetic fields resulted with identical susceptibility vs temperature curves.
3 Results and discussion
3.1 Crystallography
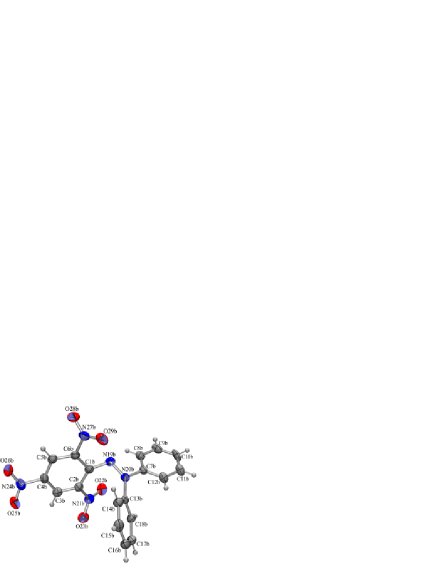
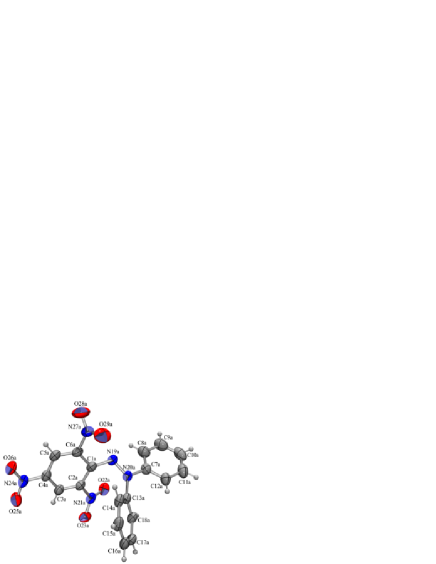
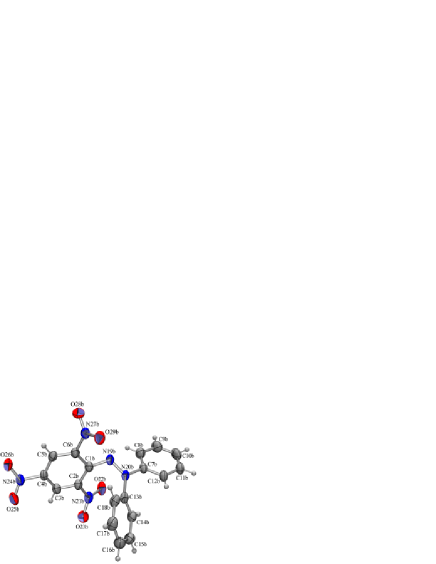
The geometries and conformations of the DPPH radicals, DPPH1 and DPPH2 (Figures 1 and 2), agree well with those found in previous crystallographic studies of DPPH solvates [3, 6, 7]. Bond lengths and angles of the pycryl–N–N–Ph2 system (Table 2) indicate that the unpaired electron is delocalized over the C1–N19–N20 fragment with the bonds order of ca 1.5. The bond order of N20–C7 and N20–C13 is ca 1. Such an electronic structure is in agreement with a recent DFT study [17]. The DPPH molecule is not rigid; however, ENDOR spectroscopy [18] and DFT calculations [17] indicate that restricted rotations of phenyl rings are possible in solution. Therefore, the crystallographically observed conformation is thermodynamically, probably, the most stable one.

| DPPH1 | ||
| molecule a | molecule b | |
| C1–N19 | 1.364 (8) | 1.376 (8) |
| N19–N20 | 1.352 (7) | 1.321 (7) |
| N20–C7 | 1.405 (8) | 1.426 (8) |
| N20–C13 | 1.432 (8) | 1.435 (7) |
| C1–N19–N20 | 118.0 (5) | 117.0 (5) |
| N19–N20–C7 | 116.9 (5) | 115.6 (5) |
| N19–N20–C13 | 121.4 (5) | 123.5 (5) |
| C7–N20–C13 | 121.0 (5) | 120.2 (5) |
| DPPH2 | ||
| molecule a | molecule b | |
| C1–N19 | 1.354 (5) | 1.366 (4) |
| N19–N20 | 1.342 (4) | 1.339 (4) |
| N20–C7 | 1.404 (5) | 1.416 (4) |
| N20–C13 | 1.434 (5) | 1.432 (4) |
| C1–N19–N20 | 118.6(3) | 118.8 (3) |
| N19–N20–C7 | 115.6(3) | 115.6 (3) |
| N19–N20–C13 | 122.0(3) | 121.5 (2) |
| C7–N20–C13 | 121.7(3) | 122.5 (2) |
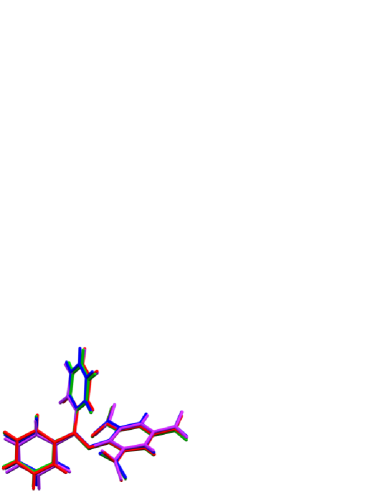
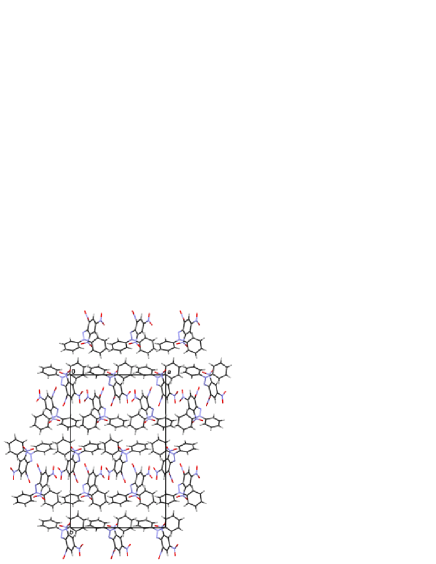
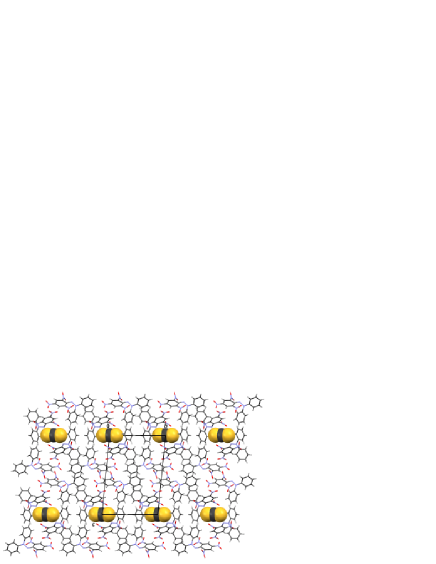
In the both DPPH1 and DPPH2 crystal structures, the asymmetric unit contains two symmetry-independent DPPH radicals; the asymmetric unit of DPPH2 contains also a half of a \ceCS2 molecule (its sulphur atom is located in a crystallographic inversion center). All four symmetry-inequivalent molecules described in the paper adopt the same conformation (Figure 3), already observed in the crystal structures of several DPPH crystal forms [3, 6, 7]. Crystal packings of the both structures (DPPH1 and DPPH2) are dominated by the \ceC\bond-H\bond…O hydrogen bonds (Table 3). In DPPH2, \ce\bond… interactions are also present (Table 4). DPPH1 forms a 3D hydrogen bonded network (Figure 4), while DPPH2 forms 2D hydrogen bonded sheets parallel with (100), held together by the \ce\bond… interactions. Such a structure is porous, with channels filled with \ceCS2 molecules running in the direction [100] (Figure 5).
| (D–H) / Å | (HA) / Å | (DA) / Å | (D–HA) / ∘ | Symm. op. | |
|---|---|---|---|---|---|
| DPPH1 | |||||
| C14A–H14AO25A | 0.93 | 2.53 | 3.151 (8) | 125 | |
| C14B–H14BO25B | 0.93 | 2.54 | 3.185 (8) | 127 | |
| C17B–H17BO22A | 0.93 | 2.53 | 3.400 (10) | 156 | |
| C12B–H12BO23B | 0.93 | 2.64 | 3.344 (9) | 145 | |
| C8A–H8AO26B | 0.93 | 2.61 | 3.278 (4) | 130 | |
| DPPH2 | |||||
| C14A–H14AO25A | 0.93 | 2.61 | 3.355 (6) | 135 | |
| C12A–H12AO23A | 0.93 | 2.63 | 3.301 (5) | 129 | |
| C5B–H5BO28B | 0.93 | 2.72 | 3.355 (6) | 127 | |
| C15A–H15AO26B | 0.93 | 2.69 | 3.493 (6) | 145 | |
| C8A–H8AO28A | 0.93 | 2.54 | 3.200 (7) | 129 | |
| offset / Å | symm.op. | |||||
|---|---|---|---|---|---|---|
| C1B\ce-¿C6BC1B\ce-¿C6B | 4.027 (2) | 0.00 | 32.17 | 3.409 | 2.144 | |
| C7B\ce-¿C12BC7B\ce-¿C12B | 3.973 (1) | 0.00 | 20.16 | 3.730 | 1.369 |
1Ring centroid; 2Angle between two ring planes; 3Angle between a centroid-centroid line and a normal to the plane of the first ring; 4Distance between the centroid of the first ring and the plane of the second one.
3.2 IR spectroscopy
The IR spectra of DPPH1 and DPPH2 show characteristic absorption bands that can, in general, be attributed to the presence of aromatic hydrocarbon ligands and nitro groups. The absorption bands of weak intensity that occur in the region 3100–3000 cm-1 for both compounds originate from the aromatic C–H stretching vibrations. The absorption bands of rather strong intensity at 1598, 1575 and 1479 cm-1 in the spectrum of DPPH1, and at 1597, 1574 and 1478 cm-1 in the spectrum of DPPH2 correspond to the stretch of the C–C bonds from the aromatic rings [19]. The absorption bands corresponding to the nitro groups in DPPH1 are located at 1523 cm-1 [(NO)], 1324 cm-1 [(NO)], 914 cm-1 [(C–NO2)] and also at 842 and 833 cm-1 [(ONO)]. The corresponding bands for DPPH2 are placed at 1525 cm-1 [(NO)], 1326 cm-1 [(NO)], 914 cm-1 [(C–NO2)] and at 844 and 832 cm-1 [(ONO)] [19, 20]. The presence of the solvate molecule of \ceCS2 in DPPH2 is confirmed by the strong absorption band at 1512 cm-1 [(\ceCS2)] [20].
3.3 EPR spectroscopy
3.3.1 DPPH1
The EPR spectrum of DPPH1 was a Lorentzian singlet line at room temperature. The angular rotation of the single crystal gave an approximately isotropic line with the (peak-to-peak) width mT and .
The temperature dependence of the linewidth was examined in the range –297 K. The results showed no significant changes of this parameter. The singlet line at K had approximately the same width mT as the line at K. However, in contrary to the isotropic spectral line at room temperature, the measurements at 10 K showed the anisotropy of the spectrum. The angular variations of the -value of the single crystal rotated along the three chosen orthogonal axes: , and are shown in Figure 6.

The elements of the matrix at K were determined from the experimental single-crystal data, by solving the following equation [21]:
| (1) | |||||
where and are the polar and azimuthal angles of the magnetic field vector in the coordinate system, respectively. The calculated -tensor is presented in Figure 6 by solid lines. The principal values of the -tensor of DPPH1, obtained by diagonalization of the matrix at K, are shown in Table 5, with the estimated error 0.0001. The obtained -tensor is approximately axial with the maximum value, , observed in the direction roughly parallel to the crystallographic axis.
| (K) | ||||
|---|---|---|---|---|
| DPPH1 | 297 | 2.0036 | 2.0036 | 2.0036 |
| 10 | 2.0046 | 2.0037 | 2.0034 | |
| DPPH2 | 297 | 2.0041 | 2.0036 | 2.0030 |
| 10 | 2.0055 | 2.0040 | 2.0024 | |
| DPPH [22] | 297 | 2.0037 | 2.0036 | 2.0034 |
3.3.2 DPPH2
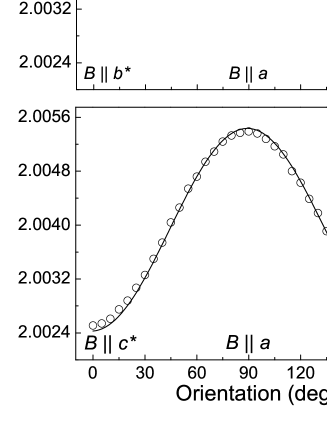
The single-crystals of DPPH2 showed the anisotropy singlet line already at room temperature. In comparison to DPPH1, the linewidth of DPPH2 was almost halved: mT. This is in agreement with the fact that the solid state EPR spectrum of DPPH has a solvent dependent linewidth and that the lowest observed value of the linewidth was obtained for DPPH crystallized from \ceCS2 (0.15 mT for powder) [2]. Such a small value of the linewidth had earlier led to the conclusion that the DPPH single crystals obtained from \ceCS2 were probably solvent free, although there was no unambiguous evidence for that. The crystal structure data presented in this study have undoubtedly showed that DPPH2 has syncrystallized molecules of \ceCS2: the unit cell contains four DPPH radicals and one \ceCS2 molecule. The obtained linewidth, in spite of the presence of the solvation, is very narrow ( mT for powder). The angular variations of the -value of DPPH2 along the three orthogonal axes at K are shown in Figure 7. The dependencies obtained are in approximate agreement with the earlier measurements that had been performed round one axis for which crystallographic indices had not been given [23, 24].

Using the same method as for DPPH1, the matrix was obtained and the principal values of the -tensor of DPPH2 at K were extracted and presented in Table 5. The minimum value of the -tensor, , was observed in the direction roughly parallel to the crystallographic axis.
The only up to now available experimental data for the -tensor of DPPH crystallized from \ceCS2, were obtained by Chirkov and Matevosyan [22]. They found different principal values of the -tensors for the crystals prepared under different crystallization conditions (solvent purity, temperature, …) and explained this effect by the crystal lattice defects. Otherwise, based on the fact that on raising the temperature right up to the melting point the EPR linewidth altered smoothly, the authors concluded that the crystals of DPPH had no solvent (\ceCS2) molecules included. One set of the principal values of the -tensor obtained in the mentioned work is presented in Table 5, together with the corresponding values for DPPH1 and DPPH2. It could be seen that the -tensor anisotropy obtained by Chirkov and Matevosyan [22] is significantly lower than the anisotropy obtained in this study. A reasonable explanation of the observed difference could be that the crystals grown from different experimental conditions had different CS2 : DPPH ratios and possibly, different crystal structures.
The linewidth of mT obtained for DPPH2 at K shows a significant broadening compared to the linewidth measured at room temperature. That is in agreement with the earlier measurements for the powder DPPH form [24, 25]. The angular variations of the -value are shown in Figure 8.
The calculated principal values of the -tensor of DPPH2 at K are given in Table 5. The obtained -tensor has the maximum value, , in the direction roughly parallel to the axis. Comparing Figures 7 and 8, beside a change in magnitude of the principal values of the -tensor, also a shift of the direction of eigenvectors could be observed. This effect had been indicated earlier [24].
3.4 Magnetization study
The temperature dependence of the molar magnetic susceptibility for DPPH1 and DPPH2 is presented in Figure 9. The two DPPH samples show almost identical behavior at temperatures above K, but their behavior is qualitatively different at lower temperatures. For DPPH2, the molar susceptibility is decreasing monotonously with increasing temperature. For DPPH1, the susceptibility dependence on temperature curve attains a relatively broad maximum at K. The decrease of the value with decreasing below points to the antiferromagnetic interactions in this compound.
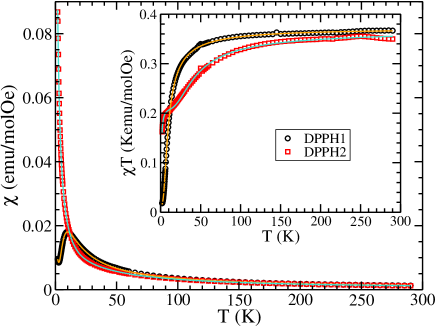
In the inset of Figure 9 the temperature independent value above 150 K was obtained after the diamagnetic corrections of and emu/mol for DPPH1 and DPPH2, respectively, were included. These values are in agreement with those in the previously published work [26]. From the plots above 150 K the Curie constant values of 0.363 and 0.351 emuK/mol for DPPH1 and DPPH2, respectively, resulted. The values are close to the free electron value of 0.375 emuK/mol, and according to the EPR measurements, this should be the case also for DPPH1 and DPPH2. From the EPR data, using , one can see that there are 96.5% radical electrons of the spin per formula unit of DPPH1 and 93.3% radical electrons per formula unit of DPPH2. Approximately the same values for the Curie constant result from the Curie-Weiss analysis of , where the slope of the straight line gives emuK/mol for DPPH1 and emuK/mol for DPPH2. From here, the Curie-Weiss parameter amounts and K for DPPH1 and DPPH2, respectively. The negative values of this parameter point to the antiferromagnetic interactions in both samples. The obtained values are somewhat smaller than for other measured DPPH crystals, where the values were found to be from to K [27, 28]. However, it should be noted that these parameters are empirical and descriptive only, and might not give the true values of interaction energies.
The antiferromagnetic interactions for both compounds are indicated by the downward bending of the curves with decreasing temperature (Figure 9). Magnetic correlations have visible effects starting approximately from 50 and 150 K for DPPH1 and DPPH2, respectively. Moreover, it seems that for DPPH2 there are two characteristic temperatures (energies). For further discussion of magnetic behavior of these compounds, their structural characteristics should be taken into account. It appears that consideration of the 3D long-range interactions would not be appropriate, as no pathways for such interactions could be observed in the crystal structures. Instead, a more precise interpretation of the magnetic data should be found in dimer interactions of radical electrons. Dimer approach was reported earlier for other DPPH crystals [26, 29]. Based on the crystal structures, such an approach is also justified for the present DPPH samples. Figures 10 and 11 present simplified schemes of magnetic interactions in DPPH1 and DPPH2 crystals, respectively. Only the C-N-N fragments are shown, with the closest distances between the central N atoms (according to the crystallographic and DFT studies, the unpaired electron is delocalized over the C1-N19-N20 bonds).
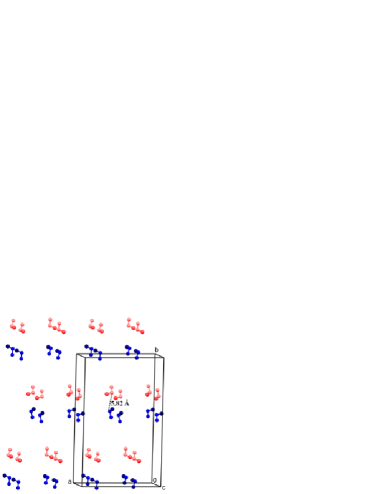
It is easy to notice that all molecules in DPPH1 are coupled into dimers (Figure 10). Pairs of symmetry independent molecules (in the same asymmetric unit) group into dimers with the centroid distances of 5.82 Å. Other paramagnetic neighbors are mutually much more distant (more than 7 Å).
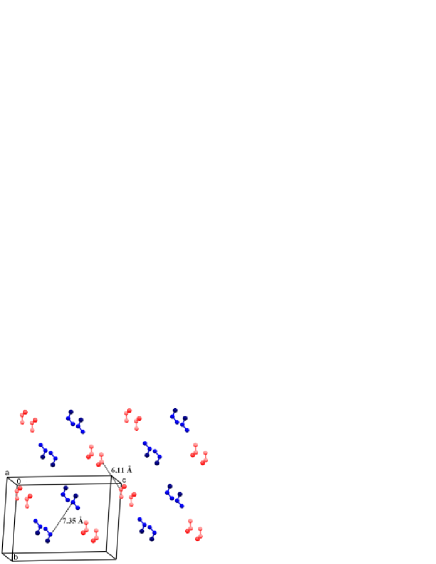
In DPPH2 two kinds of dimers are observed (Figure 11). In this structure, the closest interactions are found between the pairs of molecules related by the inversion centers. Those labelled as a (red, lighter molecules) are mutually closer (6.11 Å) than those labelled as b (blue, darker molecules, 7.35 Å). It could be concluded that the DPPH2 molecules are divided into two types of dimers with different distances between the unpaired electrons, which could lead to different exchange parameters.
According to the previously mentioned, the susceptibility of DPPH1 is fitted by the following equation:
| (2) |
where is the relative amount of molecules coupled into dimers and is the relative amount of single molecules interacting weakly with other neighboring molecules. The uncoupled single paramagnetic centers could originate from the defects and surface effects in the crystals. The susceptibility of dimers is given by:
| (3) |
where is the Heisenberg exchange coupling (defined by the interaction Hamiltonian ) between two unpaired electrons in a dimer [30]. Other parameters have their usual meanings. The Curie-Weiss molar susceptibility of weakly interacting spin molecules is:
| (4) |
When is assumed in accordance with the EPR determination, the best fit is achieved with and . At the same time, the obtained antiferromagnetic exchange coupling within the dimers is K and the long-range interaction Curie-Weiss parameter K. The agreement between the measured data and the fitted function is excellent in the whole interval of temperature (see Figure 9). The value of is close to the already published data on other DPPH crystals [26, 29].
The DPPH2 susceptibility was analyzed assuming the coexistence of two kinds of dimers with different exchange couplings. Therefore, the data were fitted by:
| (5) |
where and are the relative amounts of molecules coupled into particular types of magnetic dimers with the exchange energies and , respectively. The obtained parameters are and , whereas the corresponding exchange interactions are K and K. In Figure 11, and could be associated with the molecules labelled as b (blue, darker molecules) and a (red, lighter molecules), respectively.
The fitting of the curves (inset in Figure 9) gave consistently the same parameters for both compounds. However, the obtained results for the exchange parameters for DPPH1 ( K) and for the a labelled molecules in DPPH2 (red, lighter molecules, K), which have approximately the same mutual distance within dimers, are significantly different. The difference arises from the different orientation of molecules in DPPH1 and DPPH2. The molecules forming dimers in DPPH1 are almost mutually perpendicular (the angle between the planes which are determined by the C-N-N fragment, is 80.4∘) and the molecules forming dimers in DPPH2 are mutually parallel (for both types of dimers).
It is worth mentioning that the molecular field model in which the neighboring dimers mutually interact gave poor agreement with the measured data. The possible explanation lies in the fact that at low temperatures the antiferromagnetically coupled dimers are in the singlet state, and their mutual interactions are therefore unlikely.
The magnetic susceptibility analysis showed the presence of magnetic dimerization in both DPPH1 and DPPH2, but the amounts of entities participating and the strength of exchange couplings are different for the two samples, in accord with their crystal structures.
4 Conclusions
Crystal structures for two DPPH samples were solved: DPPH1, crystallized from ether, and DPPH2, crystallized from \ceCS2. The single-crystal X-ray diffraction analysis (and also IR spectroscopy) showed that the single crystals of DPPH1 are solvent free and those of DPPH2 contain one molecule of \ceCS2 in the unit cell. From the EPR measurement principal values of the -tensors at room (297 K) and low (10 K) temperatures were obtained. Although the crystals of DPPH2 give a narrower linewidth, the crystals of DPPH1, due to an almost insignificant change of linewidth with decreasing temperature (from room temperature to K) and a lower -tensor anisotropy, prove to be more suitable as the EPR probe. The magnetization study show pairing into dimers with the antiferromagnetic exchange coupling of K for all molecules in DPPH1 and pairing into two kinds of dimers (ca 50-50%) with the antiferromagnetic exchange couplings of K and K, in DPPH2. The magnetization results are in accordance with the crystal structures of the compounds.
The results presented in this study contribute to better understanding of the properties of DPPH, which is important regarding the great significance of DPPH in the EPR spectroscopy.
Acknowledgments
D. Žilić is grateful to D. Merunka for the useful discussion. This research was supported by the Ministry of Science, Education and Sports of the Republic of Croatia (projects 098-0982915-2939, 098-0982904-2946, 098-1191344-2943 and 119-1191458-1017).
References
- [1] J. Krzystek, A. Sienkiewicz, L. Pardi, L. C. Brunel, J. Magn. Reson. 125 (1997) 207–211.
- [2] N. D. Yordanov, Appl. Magn. Reson. 10 (1996) 339–350.
- [3] J. X. Boucherle, B. Gillon, J. Maruani, J. Schweizer, Acta Crystallogr. C 43 (1987) 1769–1773.
- [4] J. A. Weil, J. K. Anderson, J. Chem. Soc. (1965) 5567–5570.
- [5] F. H. Allen, Acta Crystallogr. B 58 (2002) 380–388.
- [6] C. T. Kiers, J. L. de Boer, R. Olthof, A. L. Spek, Acta Crystallogr. B 32 (1976) 2297–2305.
- [7] D. E. Williams, J. Am. Chem. Soc. 89 (1967) 4280–4287.
- [8] D. E. Williams, J. Chem. Soc. (1965) 7535–7536.
- [9] B. Rakvin, M. Požek, A. Dulčić, Solid State Commun. 72 (2) (1989) 199–201.
- [10] B. Rakvin, T. A. Mahl, A. S. Bhalla, Z. Z. Sheng, N. S. Dalal, Phys. Rev. B 41 (1) (1990) 769–771.
- [11] B. Rakvin, D. Žilić, N. S. Dalal, J. M. North, P. Cevc, D. Arčon, K. Zadro, Spectrochim. Acta A 60 (2004) 1241–1245.
- [12] CrysAlis PRO, Oxford Diffraction Ltd., U. K., 2007.
- [13] G. M. Sheldrick, Acta Crystallogr. A 64 (1) (2008) 112–122.
- [14] A. L. Spek, PLATON98: A Multipurpose Crystallographic Tool, University of Utrecht, The Netherlands, 1998.
- [15] L. J. Farrugia, J. Appl. Cryst. 30 (1997) 565.
- [16] C. F. Macrae, P. R. Edgington, P. McCabe, E. Pidcock, G. P. Shields, R. Taylor, M. Towler, J. van de Streek, J. Appl. Cryst. 39 (2006) 453–457.
- [17] S. M. Mattar, J. Sanford, Chem. Phys. Lett. 425 (2006) 148–153.
- [18] N. S. Dalal, D. E. Kennedy, C. A. McDowell, Chem. Phys. Lett. 30 (1975) 186–189.
- [19] R. M. Silverstein, C. G. Bassler, T. C. Morrill, Spectrometric Identification of Organic Compounds, 3rd Edition, John Wiley and Sons, Inc., New York, 1974.
- [20] K. Nakamoto, Infrared and Raman Spectra of Inorganic and Coordination Compounds, 5th Edition, John Wiley and Sons, Inc., New York, 1997.
- [21] J. A. Weil, J. R. Bolton, J. E. Wertz, Electron Paramagnetic Resonance, John Wiley and Sons, Inc., New York, 1994.
- [22] A. K. Chirkov, R. O. Matevosyan, J. Struct. Chem. 11 (2) (1970) 242–246.
- [23] C. Kikuchi, V. W. Cohen, Phys. Rev. 93 (3) (1954) 394–399.
- [24] L. S. Singer, C. Kikuchi, J. Chem. Phys. 23 (1955) 1738–1739.
- [25] P. Swarup, B. N. Misra, Z. Phys. 159 (1960) 384–387.
- [26] J. W. Duffy, D. L. Strandburg, J. Chem. Phys. 46 (2) (1967) 456–464.
- [27] A. V. Itterbeek, M. Labro, Physica 30 (1) (1964) 157–160.
- [28] J. W. Duffy, J. Chem. Phys. 36 (2) (1962) 490–493.
- [29] J. W. Duffy, D. L. Strandburg, J. F. Deck, J. Chem. Phys. 68 (5) (1978) 2097–2104.
- [30] O. Kahn, Molecular Magnetism, Wiley-VCH Inc., New York, 1993.