-
Planet-Induced Emission Enhancements in HD 179949: Results from McDonald Observations
Abstract: We monitored the Ca II H and K lines of HD 179949 to observe and confirm previously identified planet induced emission (PIE) as an effect of star-planet interaction. We obtained high resolution spectra () with a signal-to-noise ratio S/N in the Ca II H and K cores during 10 nights of observation at the McDonald Observatory. Wide band echelle spectra were taken using the 2.7 m telescope. Detailed statistical analysis of Ca II K revealed fluctuations in the Ca II K core attributable to planet induced chromospheric emission. This result is consistent with previous studies by Shkolnik et al. (2003). Additionally, we were able to confirm the reality and temporal evolution of the phase shift of the maximum of star-planet interaction previously found. However, no identifiable fluctuations were detected in the Ca II H core. The Al I 3944 Å line was also monitored to gauge if the expected activity enhancements are confined to the chromospheric layer. Our observations revealed some variability, which is apparently unassociated with planet induced activity.
Keywords: planetary systems — radiation mechanisms: nonthermal — stars: activity — stars: chromospheres — stars: individual (HD 179949) — stars: late-type
1 Introduction
Observational results indicate that the large majority of planets outside the solar system is hosted by main-sequence stars (e.g. Butler et al. 2006), which are known to possess an extended outer atmosphere consisting of a chromosphere, transition region and corona as well as a dynamic stellar wind region (e.g. Linsky 1980; Simon 1986) associated with complex magnetic structure (e.g. Schrijver & Zwaan 2000). In various systems, consisting of a star and a close-in extrasolar giant planet (CEGP), interaction between the planet and stellar atmospheric structure has been identified that is often broadly classified as “planet-induced (stellar) emission” (PIE). The reality of this phenomenon has been proposed by Cuntz et al. (2000) who also provided a detailed ranking of the relative strength of this effect for the various star-planet systems known at the time. Moreover, Cuntz et al. (2000) explored the possibility of tidal interaction and magnetic interaction with the latter distinguished from the former by two activity maxima per stellar circumference instead of one.
The PIE effect was subsequently discovered by Shkolnik et al. (2003) in regard to the HD 179949 system using high-resolution () and high signal-to-noise ratio spectra based on three observing runs at the Canada-France-Hawaii Telescope (CFHT). They also concluded that the PIE effect is expected to be magnetic in nature rather than caused by gravitational star-planet interaction. Subsequent work was pursued by Shkolnik et al. (2005), Shkolnik et al. (2008) and others, resulting in the identification of the PIE effect in at least six systems, which are: HD 209458, And, Boo, HD 179949, HD 189733, and HD 73526.
The latter study also provides evidence of the on/off nature of the PIE effect, also previously found in the And system (Shkolnik et al. 2008), which according to the authors is likely attributable to the changing stellar magnetic field structure throughout the stellar activity cycle (e.g. Lanza 2010). An alternative or supplementary explanation of the significant time-dependent variations of the PIE phenomena refers to the flare-type nature of the interaction (e.g. Saar et al. 2004; McIvor et al. 2006). Recently, a detailed time-dependent MHD simulation for the interaction of the stellar magnetic field and wind with the planetary magnetosphere and outflow was given by Cohen et al. (2011) for HD 189733 as an example. Their results show reconnection events occurring at specific planetary orbital phases, causing mass loss from the planetary magnetosphere able to generate hot spots on the stellar surface. The simulations also demonstrate that the system has sufficient energy for the hot spots to be visible in Ca II lines, which are expected to show stochastic behavior.
There were also various attempts to identify the PIE effect in other spectral regimes, including the radio regime, infrared and X-rays. Bastian et al. (2000) conducted a search for radio emission for six extra-solar star-planet or brown dwarf systems that included four systems with the planet or BD closer than 0.1 AU from its host star. No detections were made, however, which was attributed to physical or instrumental reasons. Subsequent work mostly focused on the derivation of upper limits of emergent radio emission from known systems given by, e.g. Farrell et al. (2003), Zarka (2007), and Grießmeier et al. (2007).
| Parameter | HD 179949 | Reference |
|---|---|---|
| Spectral Type | F8.5 V | a |
| RA | 19 15 33.2278 | b |
| DEC | 24 10 45.668 | b |
| V | 6.25 … | b |
| (K) | 6202 52 | Ribas et al. (2003) |
| () | 1.24 0.10 | Tinney et al. (2001) |
| Distance (pc) | 27.0 0.5 | b |
| Age (Gyr) | 2.05 … | Donahue (1993) |
| () | 1.193 0.030 | Ribas et al. (2003) |
| Fe/H | 0.226 0.050 | Gonzalez & Laws (2007) |
| (AU) | 0.0443 0.0026 | Butler et al. (2006) |
| 0.022 0.015 | Butler et al. (2006) | |
| (days) | 3.092514 0.000032 | Butler et al. (2006) |
| () | 0.916 0.076 | Butler et al. (2006) |
adata from SIMBAD; see http://simbad.u-strasbg.fr.
badopted from the Hipparcos catalogue; see ESA (1997).
Another effort to identify the PIE effect was undertaken by Saar & Cuntz (2001) who executed a search for periodicities in the Ca II infrared triplet emission for a sample of stars with close-in giant planets; however, no unequivocal identification was made. Additionally, an effort to search for the PIE effect in the UV using the Goddard High Resolution Spectrograph (GHRS) on board of HST was rendered impossible as the GHRS was removed during HST Servicing Mission 2. On the other hand, a statistical survey of the X-ray fluxes from stars with close-in planets has been fruitful as it found them enhanced by 30% to 40% on average over typical fluxes from similar stars with planets that are not close-in (Kashyap et al. 2008). Direct X-ray observations of the HD 179949 system (Saar et al. 2008) revealed a 30% increase in the X-ray flux over quiescent levels coincident with the phase of the Ca II enhancements. Additionally, there is also a trend for the emission to be hotter at increased fluxes, confirmed by modeling, showing the enhancement at 1 keV compared to 0.4 keV for the background star.
 |
In our present study, we will again focus on the HD 179949 system. HD 179949 is an F8.5 V star at a distance of pc located in the southern hemisphere in the constellation Sagittarius with a magnitude of V = 6.25. Its mass is estimated as 1.24 (Tinney et al. 2001) based on the interpolation of evolutionary tracks previously computed by Fuhrmann et al. (1997, 1998). The age of HD 179949 has been estimated as 2.05 Gyr (see Table 1) based on the strength of the chromospheric component of the Ca II emission, (Noyes et al. 1984; Donahue 1993). Note that HD 179949 is a solar-type star of moderate age, implying that its inherent chromospheric emission and variability has considerably subsided111See Guinan et al. (2003) and Güdel (2007), among other contributions to the “Sun in Time” project, for studies on the decline of chromospheric emission on stellar evolutionary time scales., thus adding to the credibility of any PIE determinations. By employing the Doppler velocity technique, Tinney et al. (2001) discovered as part of the Anglo-Australian Planet Search a “Hot Jupiter” hosted by HD 179949 located at a distance of about 0.044 AU (7.99 stellar radii). The planetary orbit has a very low eccentricity that is essentially consistent with the circular case (see Table 1), allowing us to ignore the orbital ellipticity, if any, in the following. The planetary mass parameter is given as .
| Number | Date | Time | Exposure Time | S/N | Seeing |
|---|---|---|---|---|---|
| … | … | (UT) | (s) | … | (arcs) |
| 1 | April 5, 2006 | 11:31 | 1200 | 53 | 2.6 |
| 2 | April 5, 2006 | 11:54 | 1200 | 56 | 2.6 |
| 3 | April 6, 2006 | 11:17 | 1200 | 43 | 4.1 |
| 4 | April 6, 2006 | 11:40 | 1200 | 47 | 4.1 |
| 5 | April 7, 2006 | 11:30 | 1200 | 37 | 5.0 |
| 6 | April 7, 2006 | 11:53 | 1200 | 45 | 5.0 |
| 7 | April 8, 2006 | 11:13 | 1200 | 50 | 2.3 |
| 8 | April 8, 2006 | 11:36 | 1200 | 51 | 2.3 |
| 9 | April 8, 2006 | 11:59 | 1200 | 70 | 2.3 |
| 10 | April 9, 2006 | 11:59 | 1200 | 44 | 2.1 |
| 11 | April 11, 2006 | 11:31 | 1200 | 51 | 1.7 |
| 12 | April 11, 2006 | 11:54 | 1200 | 66 | 1.7 |
| Date | JD | Orbital Period | Reference |
|---|---|---|---|
| … | … | (d) | … |
| 07 / 1998 | 2451001.510 | 3.092514 | Butler et al. (2006)a |
| 09 / 2000 | 2451793.980 | 3.0925 | b… |
| 07 / 2002 | 2452479.823 | 3.09285 | Shkolnik et al. (2003) |
| 09 / 2003 | 2452894.110 | 3.09246 | Shkolnik et al. (2003) |
abased on data obtained by Tinney et al. (2001).
bhttp://www.exoplanet.eu.
 |
 |
Significant evidence that the activity enhancement in HD 179949 is planet-induced is based on the finding that the stellar rotation period almost certainly disagees with the orbital period of the planet. Therefore, it would be difficult to explain emission on the star that essentially “follows” the CEGP without a planet-related cause. Unfortunately, HD 179949 does not have a robustly measured (see Wolf & Harmanec 2004). However, following Saar et al. (2004) and references therein, it can be argued based on the strength of the Ca II HK emission, the mean Mount Wilson index as well as stellar evolution constraints that lies between 7 and 10 d, thus being distinctly different from d (see Table 1).
The PIE effect has various interesting astrophysical applications as it, in principle, may allow the identification and characterization of magnetic fields and dynamo activity in exosolar Jupiter-type planets (e.g. Ip et al. 2004; Grießmeier et al. 2004; Erkaev et al. 2005; Zarka 2007; Lanza 2008; Cohen et al. 2009; Scharf 2010; Lanza 2011; Cohen et al. 2011). In addition, it may also be useful for probing the inner region of the stellar winds (e.g. Preusse et al. 2005; McIvor et al. 2006). This is a further reason to continue monitoring the PIE effects in different spectral regimes and by using different type of instruments including the 2.7 m Harlan J. Smith Telescope at the McDonald Observatory. The latter allowed us to continue studying the Ca II H and K line cores in HD 179949 and to compare our findings with the previous results by Shkolink et al. (2003) and subsequent work. Our paper is structured as follows: In §2, we describe the employed methods including the data reduction. Our results and discussion are given in §3. In §4, we present our conclusions.
2 Methods and Data Reduction
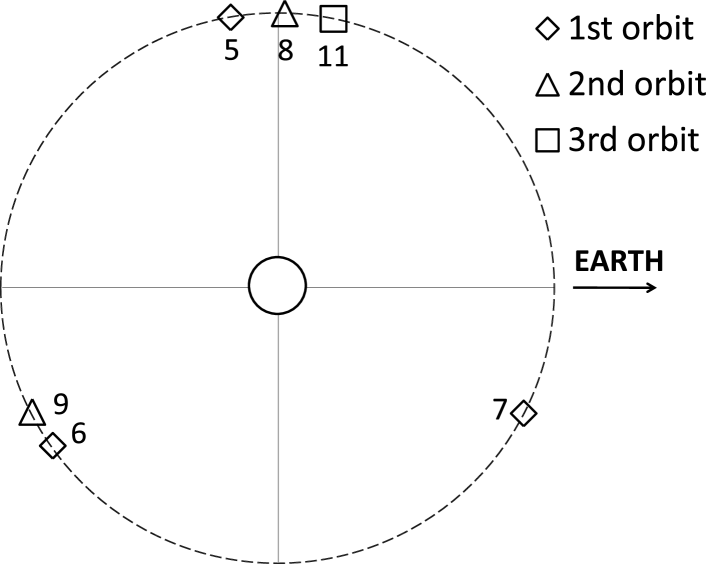
In order to study the PIE effect in the HD 179949 system, we obtained high resolution (53,000) spectra using the McDonald Observatory’s echelle spectrograph mounted on the TK3 light path of the Coudé focus of the 2.7 m (107 inch) Harlan J. Smith Telescope. We obtained observations for six (almost) consecutive nights in April 2006, which allowed us to acquire data points spreading over nearly three planetary orbits (see Fig. 1 and Table 2 for details). Full optical bandwidth (3400 – 10,900 Å) were recorded in at least 67 orders by a Tektronix (2048 2048), CCD camera. The Ca II H and K lines were carefully centered in order 56. Furthermore, Th-Ar spectra were taken frequently (i.e., typically in less than 2 h intervals) to allow accurate wavelength calibrations. The signal-to-noise (S/N) ratio of the spectra exceeded 200 for the continuum, and it was close to 50 in the Ca II K core (3933 Å), and about 80 in the Ca II H core (3968 Å) (see Fig. 2).
The data reduction was performed by using the IRAF standard packages IMRED, CCDRED and ECHELLE. The data reduction procedures can be summarized as follows: Combined biases were subtracted from all stellar, arc, and flat-field exposures to remove the baseline noise. Scattered light was removed from all stellar and flat field exposures. All stellar and arc exposures were divided by combined flat field for normalization of the sensitivity levels of the CCD chip. Spectra were extracted from the 2D images to 2D spectra. Heliocentric correction was applied to each spectrum to express the observation time considering that the observer’s location does not coincide with the center of the Sun. Differential radial velocity corrections due to the rotation and orbital velocity of Earth were applied to each spectrum. The combined flat field was processed like a stellar image to obtain blaze functions for each observation night. Blaze functions were used to remove from each final spectrum the low-order curvature as a result of the intensity variation along the orders.
 |
 |
Each reduced spectrum is carefully checked for potential contaminations. Trace amounts of sunlight contamination are detected in the last exposures of each observing night as HD 179949 is observed at low altitudes on the Eastern horizon just a few hours before dawn. These exposures were discarded to avoid any solar contamination of our spectra. Although the night of April 9 originally indicated a critical phase to detect star-planet interaction, this entire data set had to be discarded as the cloud coverage caused large noise level in the spectra.
Next we followed the procedure of Shkolnik et al. (2003) previously used to unveil the PIE effect for the HD 179949 system from optical spectra. The following steps were undertaken: (1) From each spectrum increments of 7 Å centered at the Ca II H (3968 Å) and K (3933 Å) cores, respectively, were extracted. (2) To normalize each spectrum, the end points of each extracted spectra were set to 1. As stated by Shkolnik et al. (2003), this is the best way to normalize the spectra in the wavelength regimes, such as H and K lines, where there is no clear continuum. (3) The normalized spectra were grouped by date and co-added in order to obtain a mean spectrum for each night. (4) Overall average spectra were computed over all nights. (5) Residuals given as were computed. (6) Low-order curvature was removed from each residual spectra. This step was performed by applying fits to the data sets with polynomimals of order 2. In order to obtain the best trend line for the low-order curvature, data points in the proximity of the center line were excluded from the fit. (7) Next the residual spectra is smoothed over 21 pixels. (8) Finally, the Mean Absolute Deviation is computed according to with denoting the number of spectra. As a further part of the process, all spectra were analyzed with respect to 7 Å window. Trapezoidal integration was used to compute the integrated K residuals. Error bars were calculated from nightly variations.
 |
 |
 |
 |
3 Results and Discussion
The nightly flux residuals in the K core are over-plotted in Fig. 3. The figure indicates fluctuations in the K core apparently due to star-planet interaction akin to the results previously obtained by Shkolnik et al. (2003). The calculated Mean Absolute Deviation (MAD) is shown in Fig. 4. The average of all normalized nightly spectra (mean values) is depicted using dashed-lines indicating the MAD is confined, slightly asymmetrically, to the K core. A similar analysis has been pursued for the Ca II H line at 3968 Å. The Ca II H line does not show any identifiable variation. Previously, Ca II H fluctuations in the line core were deduced to be about 2/3 of the strength of the Ca II K core as stated by Shkolnik et al. (2003); see, e.g. Linsky & Avrett (1970) for background information on Ca II. We currently have no explanation for this discrepancy between the predicted and observed Ca II H emission.
Another focus of our study is to investigate the behavior of the Al I 3944 Å line (see Figs. 7 to 9), which is formed in the stellar photosphere. If the fluctuations in Ca II H, K are caused by star-planet interaction, as expected, rather than by an inherently stellar process, a significantly reduced level of variability in the stellar photosphere is expected to occur compared to the stellar chromosphere. The latter is a natural consequence of the strong density gradient between the stellar photosphere and chromosphere; see e.g. the VAL-C model for the Sun (G2 V) Vernazza et al. (1981), which has a similar, albeit moderately lower surface temperature than HD 179949. Noting that Al I 3944 Å is a photospheric line positioned between the Ca II H and K lines in the spectrum, it can thus be utilized for distinguishing between planet-related chromospheric activity and and planet-unrelated photospheric activity.
The Al I line analysis is performed to isolate planet-induced chromospheric activity from possible photospheric fluctuations. Since the photospheric response is expected to be significantly less than the chromospheric signal, this is also a check on systematic errors in our data analysis. Previously, Shkolnik et al. (2003) stated that no variation has been detected in 2 Å window of Al I analysis. We extend our analysis to a 7 Å window to create results comparable to the Ca II H and K cores. It is found that the Al I line analysis in general does not indicate enhanced photospheric activity, even if enhanced chromospheric activity occurs. A notable exception, however, is the observation on April 11, 2006, where a strong Al I line variation is found without a chromospheric counterpart. Thus, if it is indicative of a real photospheric signal, it is apparently unassociated with star-planet interaction.
Detected photospheric emission raises the level of the mean spectrum around the line core resulting in a greater residual flux (see Fig. 7). As noted in Sect. 2, the residual flux is computed from ; therefore, the fluctuation increases because of an increased mean value. Integrated residuals between 3943.5 Å and 3944.5 Å are plotted as a function of the planetary phase (see Fig. 8). The April 11 data, indicated by a square point, show no correlation with the activity enhancement detected in the K core of Ca II. If we ignore the April 11 data point regardless of the cause of the variability, and repeat our analysis, no significant fluctuation and/or activity enhancement is revealed (see Fig. 7). The Mean Absolute Deviation (MAD) is subsequently also computed for the Al I line (Fig. 8) with no indication of activity enhancement found.
 |
 |
 |
| Date | UT | JD | HJD | ||||
|---|---|---|---|---|---|---|---|
| … | (h) | … | … | … | … | … | … |
| April 6, 2006 | 11:31 | 2453831.980 | 2453831.980 | 0.2650 | 0.0137 | 0.1880 | 0.2750 |
| April 6, 2006 | 11:54 | 2453831.996 | 2453831.996 | 0.2702 | 0.0189 | 0.1931 | 0.2802 |
| April 7, 2006 | 11:17 | 2453832.970 | 2453832.970 | 0.5852 | 0.3339 | 0.5082 | 0.5952 |
| April 7, 2006 | 11:40 | 2453832.986 | 2453832.986 | 0.5904 | 0.3391 | 0.5133 | 0.6004 |
| April 8, 2006 | 11:30 | 2453833.979 | 2453833.979 | 0.9115 | 0.6602 | 0.8345 | 0.9216 |
| April 8, 2006 | 11:53 | 2453833.995 | 2453833.995 | 0.9167 | 0.6654 | 0.8396 | 0.9267 |
| April 9, 2006 | 11:13 | 2453834.967 | 2453834.968 | 0.2311 | 0.9798 | 0.1540 | 0.2411 |
| April 9, 2006 | 11:36 | 2453834.983 | 2453834.983 | 0.2362 | 0.9849 | 0.1591 | 0.2462 |
| April 9, 2006 | 11:59 | 2453834.999 | 2453835.000 | 0.2414 | 0.9901 | 0.1643 | 0.2515 |
| April 10, 2006 | 11:59 | 2453835.999 | 2453836.000 | 0.5647 | 0.3135 | 0.4877 | 0.5749 |
| April 12, 2006 | 11:31 | 2453837.980 | 2453837.980 | 0.2052 | 0.9540 | 0.1281 | 0.2154 |
| April 12, 2006 | 11:54 | 2453837.996 | 2453837.996 | 0.2103 | 0.9592 | 0.1333 | 0.2206 |
a, , , and correspond to the observations obtained on 07/1998, 09/2000, 07/2002, and 09/2003, respectively, (see Table 3) with .
To investigate the modulation of the PIE effect with the orbital period of the planet , the Ca II K residuals are integrated and plotted as a function of orbital phase (see Fig. 10). The integrated residuals are grouped by the orbital period of the planet. Each orbital coverage is distinguished by different symbols. The scale of the figure is adjusted compared to Shkolnik et al. (2003) by setting the minimal residual flux to zero. The best-fit bright-spot models from Shkolnik et al. (2003) are also depicted; they implement models of photospheric spatial inhomogeneities (spaced akin to ) in comparison to planetary effects (spaced akin to ). The planetary positions for our observation run, calculated from the ephemerides of 2002 provided by Shkolnik et al. (2003), are depicted in Fig. 1.
Figure 10 indicates enhanced activity during phases 0.5 and 0.85 probably due to star-planet interaction. This is consistent with previous results of Shkolnik et al. (2005, 2008) as the data points are observed near bright-spot model fits. Shkolnik et al. (2005, 2008) suggested that the peak emission is found at a phase of about while stating that the fit to the 2001 and 2002 data peaks at with an amplitude of 0.027. The phase shifts in the HD 179949 system were first detected in previous work by E. Shkolnik and collaborators, when the observational data spanning 6 years were analyzed. New fit functions suggested phase shifts of between 2002 and 2005 data points, and between 2003 and 2006 data points (Fig. 11).
 |
 |
Currently, the cause(s) of these phase shifts are unknown, while noting that it may be possibly related to the star-planet interaction itself. As previously pointed out (e.g. McIvor et al. 2006; Shkolnik et al. 2008; Cohen et al. 2009), the planet-induced activity leads the planet, and the amount of phase lead may permit to decipher the magnetic field geometry, including the existence of a Parker-type spiral. However, considering that in HD 179949 the Parker spiral is relatively close to the star, a potentially more likely source of activity is magnetic reconnection to various flux-tubes at different longitudes and latitudes due to the tangled, variable magnetic structures on the star (Cranmer & Saar 2008). On the other hand, the phase shift may also be caused by a combination of differential rotation and slow migration of the activity belt during a stellar dynamo cycle Lanza (2010).
Note that we did not derive the ephemerides from our observational data, but used available 2002 ephemerides provided by Shkolnik et al. (2003). Shkolnik et al. (2008) reported phase shifts at an amount of between the 2003 and 2006 observations; therefore, (almost) the same amount of shift may be applicable to our observations obtained in April 2006 at the McDonald Observatory. Figure 10 shows the results by including the phase shift, which produces an appropriate correlation between our limited number of observational data and the best-fit bright-spot models. The peak point of the planet induced activity is estimated by Shkolnik et al. (2003) to occur when the planet is about at the third quadrature (). This primary estimation was based on best-fit bright-spot models over first available data points. However, the lack of a sufficient number of observational data and the detected phase shifts created a large uncertainty about the phase of the peak point.
The latest four ephemerides of HD 179949 system are listed in Table 3. Calculated phases from the four different epochs are listed in Table 4. Table 5 shows the mean phase shifts (local time), noting that averages were attained if there was more than one observation per night. The inconsistency of calculated phases from different epochs may imply a change in mechanical properties in the system as function of time due to star-planet interaction. Figure 11 shows the change in phase as a function of time, where it shows a low-order polynomial trend. Data points are computed from , where are the phases given in Table 4 and represent the data of Butler et al. (2006). The trend shown in Fig. 11 may be crucial for understanding the nature of the HD 179949 star-planet system; however, further discussions on this subject should be deferred until additional studies and observations have become available. However, it is noteworthy that the existence of similar phase shifts have previously been identified in other star-planet systems, notably Boo and HD 189733 (Shkolnik et al. 2008), possibly indicative of stellar magnetic dynamo evolution (Lanza 2010).
 |
| Date | ||||
|---|---|---|---|---|
| April 5, 2006 | 0.2676 | 0.0163 | 0.1906 | 0.2776 |
| April 6, 2006 | 0.5878 | 0.3365 | 0.5108 | 0.5978 |
| April 7, 2006 | 0.9141 | 0.6628 | 0.8370 | 0.9241 |
| April 8, 2006 | 0.2362 | 0.9850 | 0.1591 | 0.2463 |
| April 9, 2006 | 0.5647 | 0.3135 | 0.4877 | 0.5749 |
| April 11, 2006 | 0.2078 | 0.9566 | 0.1307 | 0.2180 |
a, , , and correspond to the observations obtained on 07/1998, 09/2000, 07/2002, and 09/2003, respectively, (see Table 3) with .
4 Conclusions
The aim of our study was to extend the observational database of planet induced stellar emission (PIE) due to the interaction of close-in exoplanets and their host stars by focusing on HD 179949. We obtained twelve observations during April 2006 at the 2.7 m telescope of the McDonald Observatory covering three planetary orbits. The PIE phenomenon previously suggested by Cuntz et al. (2000) was first observed in HD 179949 (Shkolnik et al. 2003) concerning Ca II H and K. It is now known to be present in five other star-planet systems; see Cuntz & Shkolnik (2002) for an early comparison between theory and observations. Besides Ca II H and K, the PIE effect has also been identified in other spectral features including the Ca II infrared triplet (Saar & Cuntz 2001) and in coronal X-rays (Kashyap et al. 2008; Saar et al. 2008).
Our observations appear to confirm the activity enhancement for the Ca II K core between phases 0.4 and 0.9. Shkolnik et al. (2008) reported the disappearance of the PIE phenomenon during their 2003 and 2006 observation runs. However, we have an insufficient number of data to be able to confirm or refute this finding. Nevertheless, the two relevant data points obtained in our April 2006 observing run show the PIE effect to be present in the Ca II K core consistent with the previous results by Shkolnik and collaborators. Additionally, we obtained several data points showing the absence of star-planet interaction consistent with the previous predictions. This latter finding is consistent with the interpretation that the PIE effect is due to magnetic star-planet interaction presumably facilitated along the Parker spiral of the stellar wind (e.g. Saar et al. 2004). Recent magnetospheric simulations for the interation between stellar and planetary magnetic fields and outflows were given by Cohen et al. (2011) taking HD 189733 as an example, which point to the formation of associated Ca II line signatures, expected to occur in a stochastic manner.
Regarding our observations, the Ca II H core analysis did not reveal any significant fluctuation, which is at odds with the prediction based on our Ca II K detection. Also, HD 179949 was observed at low altitude, hence at a relatively great air mass, during the observation run in April 2006, which is not suitable for detecting relatively weak activity enhancements. Previously, Shkolnik et al. (2003) deduced the Ca II H core fluctuation to be about 2/3 of the intensity of the fluctuation observed in the K core. The Al I 3944 Å line indicated no notable fluctuations during the time increments when the Ca II K emission enhancements occurred. This is strong evidence that the observed emission is indeed due to the close-in giant planet, as expected. However, there is an exceptional Al I data point obtained on April 11 possibly revealing significant emission in the stellar photosphere without a Ca II K chromospheric counterpart. Thus, the cause for this event is apparently inherent in the star, unrelated to the existence of the planet.
Acknowledgments
This work was supported by a Small Research Grant provided by the American Astronomical Society as well as by the Theodore Dunham, Jr. Grant of the Fund for Astrophysical Research.
References
- Bastian et al. (2000) Bastian, T. S., Dulk, G. A. & Leblanc, Y., 2000, ApJ, 545, 1058
- Butler et al. (2006) Butler, R. P., et al., 2006, ApJ, 646, 505
- Cohen et al. (2009) Cohen, O., Drake, J. J., Kashyap, V. L., Saar, S. H., Sokolov, I. V., Manchester, W. B., Hansen, K. C. & Gombosi, T. I., 2009, ApJ, 704, L85
- Cohen et al. (2011) Cohen, O., Kashyap, V. L., Drake, J. J., Sokolov, I. V., Garraffo, C. & Gombosi, T. I. 2011, ApJ, 733, 67
- Cranmer & Saar (2008) Cranmer, S. R. & Saar, S. H., 2008, in ASPC 384, Cool Stars, Stellar Systems, and the Sun XIV, ed. G. van Belle (San Francisco: ASP), CD-ROM (arXiv:0702.530)
- Cuntz et al. (2000) Cuntz, M., Saar, S. H. & Musielak, Z. E., 2000, ApJ, 533, L151
- Cuntz & Shkolnik (2002) Cuntz, M. & Shkolnik, E., 2002, AN, 323, 387
- Donahue (1993) Donahue, R. A., 1993, Ph.D. Thesis, New Mexico State University
- Erkaev et al. (2005) Erkaev, N. V., Penz, T., Lammer, H., Lichtenegger, H. I. M., Biernat, H. K., Wurz, P., Grießmeier, J.-M. & Weiss, W. W., 2005, ApJS, 157, 396
- ESA (1997) European Space Agency 1997, The Hipparcos and Tycho Catalogues (SP-1200) (Noordwijk: ESA)
- Farrell et al. (2003) Farrell, W. M., Desch, M. D., Lazio, T. J., Bastian, T. & Zarka, P., 2003, in ASPC 294, Scientific Frontiers in Research on Extrasolar Planets, ed. D. Deming & S. Seager (San Francisco: ASP), 151
- Fuhrmann et al. (1997) Fuhrmann, K., Pfeiffer, M. J. & Bernkopf, J., 1997, A&A, 326, 1081
- Fuhrmann et al. (1998) Fuhrmann, K., Pfeiffer, M. J. & Bernkopf, J., 1998, A&A, 336, 942
- Gonzalez & Laws (2007) Gonzalez, G. & Laws, C., 2007, MNRAS, 378, 1141
- Grießmeier et al. (2004) Grießmeier, J.-M., et al., 2004, A&A, 425, 753
- Grießmeier et al. (2007) Grießmeier, J.-M., Zarka, P. & Spreeuw, H., 2007, A&A, 475, 359
- Güdel (2007) Güdel, M. 2007, Liv. Rev. Sol. Phys., 4, 3
- Guinan et al. (2003) Guinan, E. F., Ribas, I. & Harper, G. M., 2003, ApJ, 594, 561
- Ip et al. (2004) Ip, W.-H., Kopp, A. & Hu, J.-H., 2004, ApJ, 602, L53
- Kashyap et al. (2008) Kashyap, V. L., Drake, J. J. & Saar, S. H., 2008, ApJ, 687, 1339
- Lanza (2008) Lanza, A. F., 2008, A&A, 487, 1163
- Lanza (2010) Lanza, A. F., 2010, in IAU Symp. 264, Solar and Stellar Variability: Impact on Earth and Planets, ed. A. G. Kosovichev, A. H. Andrei & J.-P. Rozelot (Cambridge: Cambridge University Press), 120 (arXiv:0909.4660)
- Lanza (2011) Lanza, A. F., 2011, Ap&SS (in press)
- Linsky (1980) Linsky, J. L., 1980, ARA&A, 18, 439
- Linsky & Avrett (1970) Linsky, J. L. & Avrett, E. H., 1970, PASP, 82, 169
- McIvor et al. (2006) McIvor, T., Jardine, M. & Holzwarth, V., 2006, MNRAS, 367, L1
- Noyes et al. (1984) Noyes, R. W., Hartmann, L. W., Baliunas, S. L., Duncan D. K. & Vaughan, A. H., 1984, ApJ, 279, 763
- Parker (1958) Parker, E. N., 1958, ApJ, 128, 664
- Preusse et al. (2005) Preusse, S., Kopp, A., Büchner, J. & Motschmann, U., 2005, A&A, 434, 1191
- Ribas et al. (2003) Ribas, I., Solano, E., Masana, E. & Giménez, A., 2003, A&A, 411, L501
- Rubenstein & Schaefer (2000) Rubenstein, E. P. & Schaefer, B. E. 2000, ApJ, 529, 1031
- Saar & Cuntz (2001) Saar, S. H. & Cuntz, M., 2001, MNRAS, 325, 55
- Saar et al. (2004) Saar, S. H., Cuntz, M. & Shkolnik, E., 2004, in IAU Symp. 219, Stars as Suns: Activity, Evolution and Planets, ed. A. K. Dupree & A. O. Benz (San Francisco, CA: ASP), 355
- Saar et al. (2008) Saar, S. H., Cuntz, M., Kashyap, V. L. & Hall, J. C., 2008, in IAU Symp. 249, Exoplanets: Detection, Formation & Dynamics, ed. Y.-S. Sun, S. Ferraz-Mello & J.-L. Zhou (Cambridge: Cambridge University Press), 79
- Scharf (2010) Scharf, C. A., 2010, ApJ, 722, 1547
- Schrijver & Zwaan (2000) Schrijver, C. J. & Zwaan, C., 2000, Solar and Stellar Magnetic Activity (Cambridge: Cambridge University Press)
- Shkolnik et al. (2003) Shkolnik, E., Walker, G. A. H. & Bohlender, D. A., 2003, ApJ, 597, 1092 [Erratum 609, 1197 (2004)]
- Shkolnik et al. (2005) Shkolnik, E., Walker, G. A. H., Bohlender, D. A., Gu, P.-G. & Kürster, M., 2005, ApJ, 622, 1075
- Shkolnik et al. (2008) Shkolnik, E., Bohlender, D. A., Walker, G. A. H. & Collier Cameron, A., 2008, ApJ, 676, 628
- Simon (1986) Simon, T. 1986, Ap&SS, 118, 209
- Tinney et al. (2001) Tinney, C. G., Butler, R. P., Marcy, G. W., Jones, H. R. A., Penny, A. J., Vogt, S. S., Apps, K. & Henry, G. W., 2001, ApJ, 551, 507
- Vernazza et al. (1981) Vernazza, J. E., Avrett, E. H. & Loser, R., 1981, ApJS, 45, 635
- Wolf & Harmanec (2004) Wolf, M. & Harmanec, P., 2004, IBVS, 5575, 1
- Zarka (2007) Zarka, P., 2007, P&SS, 55, 598
- Zarka et al. (2001) Zarka, P., Treumann, R. A., Ryabov, B. P. & Ryabov, V. B., 2001, Ap&SS, 277, 293