QCD results from the LHC
Abstract
A selection of results from the 2010 data taking period of the ATLAS and CMS experiments at the LHC at a proton-proton centre-of-mass energy of is presented. These results comprise differential jet cross sections for varying jet multiplicities, the investigation of properties of large rapidity gaps spanned by a dijet system, the production of heavy gauge bosons together with jets, and finally the investigations of properties of top quark pair production.
keywords:
ATLAS , CMS , Jets , LHC , Top Quark , QCD1 Introduction
The LHC is a wonderful QCD machine. The large proton energy allows for probing predictions of QCD at unprecedented energy scales in accelerator physics. Due to the high luminosity of the machine, and large QCD cross sections, especially for jet production, many analyses are limited by systematic uncertainties right from the start. This puts high demands on the understanding of the detectors, and also calls for high performance jet algorithms to cope with the ever increasing complications due to complex final states, and the occurrence of more than one proton-proton interaction per bunch crossing (pileup) that potentially deteriorates the jet energy resolution.
The results presented are all based on the LHC running at a proton-proton centre-of-mass energy of . For many of the topics discussed, results from the ATLAS and CMS experiments exist, however, due to the limited space, for each topic only a single result is shown, concentrating on published results, i.e. additional preliminary measurements are not included.
The paper is organised as follows: jet production for increasing jet multiplicities is discussed in Section 2. Adding a further hard scale, heavy gauge boson plus jet production is detailed in Section 3. A number of issues related to the production of top quarks are highlighted in Section 4. Finally, the summary and conclusions are given in Section 5.
2 Jet production
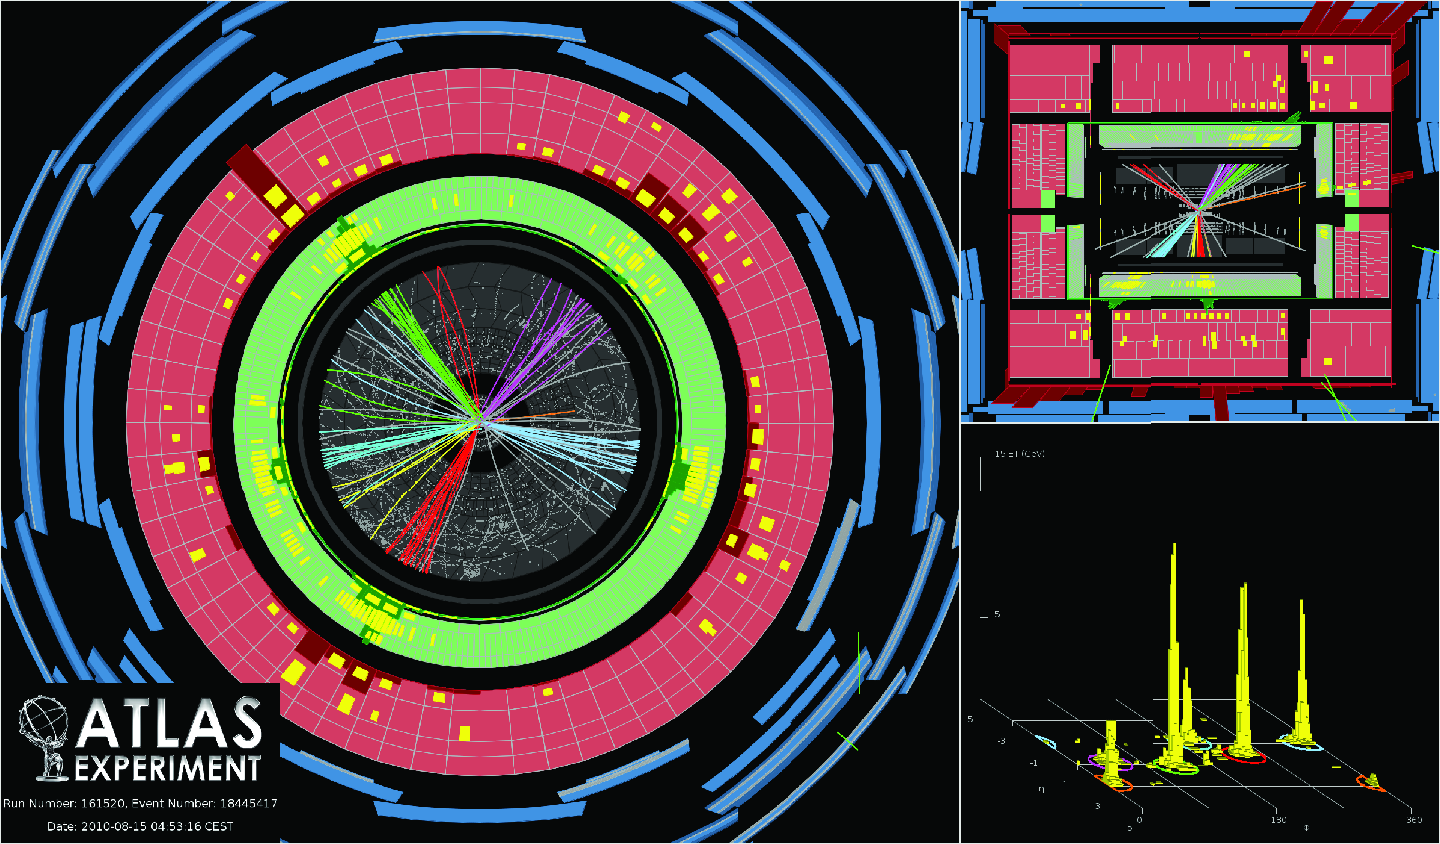
Due to the large proton energies, and the correspondingly large phase space for jet production, very complex final states, with large jet transverse momenta () occur. An example of this, a six jet event observed in the ATLAS detector, is shown in Figure 1. To properly reconstruct those final states, a high performance jet algorithm is needed. The present choice of the LHC experiments for this is the anti- algorithm [1, 2], which is a sequential clustering algorithm that uses 1/ as the weighting factor for the scaled distance, and the parameter to define the jet resolution. This algorithm exhibits a number of good features [1], which, on top of its infra-red safety, makes it superior to other possible choices.
These features are: round and rigid jet shapes that lead to a clear and stable spatial definition of jets; an almost independent jet area, ensuring an almost constant pileup correction as a function of ; and finally, very small back reaction, i.e. re-assignments of particles from the hard interaction to jets for different pileup contributions, which guarantees stable definitions of the jets stemming from the hard QCD process. In search for optimised uncertainties of observables the parameter is varied in the comparisons to the theoretical predictions, with typical values in the range . In this respect, jets with smaller R values are found to be less dependent on pileup, and those with larger R values to be less dependent on scale changes in the theoretical predictions [3].
For the ATLAS and CMS analyses, the observed jet distributions are corrected for detector effects, and then, at the resulting stable particle level, compared to the theoretical predictions which come in a large number of flavours. These comprise: leading-order (LO) Matrix Elements (ME) plus subsequent Parton Shower (PS) and underlying event (UE) implemented in the programs Pythia [4] and Herwig [5] together with Jimmy [6] (those will be referred to as LO predictions); LO MEs provided by the Sherpa [7], MadGraph [8, 9] and Alpgen [10] programs, with subsequent internal (Sherpa) or external, i.e. by other packages provided, (MadGraph, Alpgen) PS and UE (referred to as LO predictions); NLO ME calculations for outgoing partons featured by the MCFM [11] and NLOJet++ [12] programs; NLO ME calculations matched to PS that are either provided by the MC@NLO [13, 14] together with the Herwig software packages, or by the Powheg [15] generator interfaced to either the Pythia or Herwig programs; and finally, an all order resummed calculation for wide angle emissions implemented in the HEJ [16, 17] program. In addition, for the soft parts of the event simulation, a number of different tunings of parameters that control those parts in the general purpose Monte Carlo programs are in use, see for example [18]. This makes up for a very large variety of predictions for comparisons, a number of them are shown below.
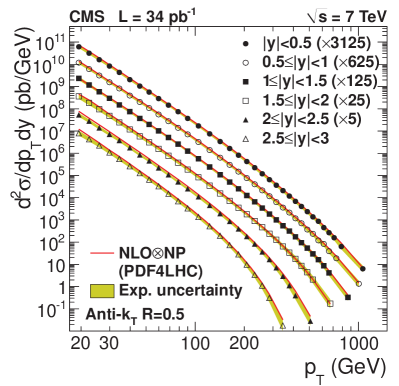
In Figure 2 the double differential inclusive jet cross section [19] as a function of , for the range , and in bins of the absolute value of the rapidity , is shown. Already now, the reach in scales that are probed by the LHC experiments extend those probed by the Tevatron experiments from about 700 to about 1100 . The data are compared to the NLO prediction from the NLOJet++ program, with non-perturbative corrections estimated using the Pythia and Herwig models.
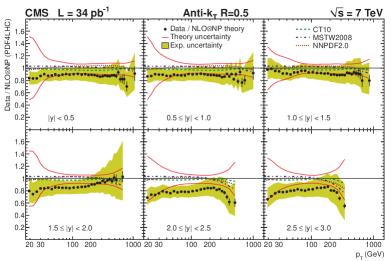
For CMS, jets are reconstructed using the so-called particle flow algorithm. This algorithm combines information from a list of objects: leptons, photons, and charged and neutral hadrons, into jets. For each of these objects, this information is obtained from various components of the detector. As for most of the inclusive jet cross section determinations, the experimental uncertainty is dominated by the Jet Energy Scale (JES) uncertainty. The description of the data by the NLO prediction over a large range in is fair. However, the prediction is systematically higher than the data, especially so at large values of , see Figure 3. At the highest the theoretical uncertainty (shown as solid lines above and below unity) is dominated by the one from the Parton Density Functions (PDFs) of the proton, parametrised as a function of the partons momentum from the proton, and consequently, the data start to constrain the PDFs, see Figure 3.
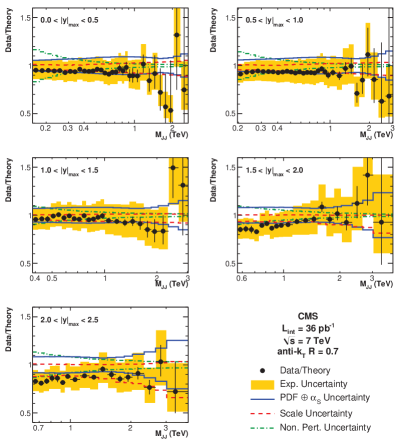
A similar conclusion holds for the double differential inclusive dijet production cross section shown in Figure 4 as a function of , the invariant mass of the two highest jets in the event, and for various bins in , the maximum of the absolute rapidity of these two jets. In this analysis, the dijet production cross section probes the PDFs in the range . The observable can be reconstructed with a 7 (3) resolution at (3 ). The low-mass region is mainly sensitive to the UE, whereas the high-mass region potentially constrains the high-x region of the PDFs, see Figure 5. At present, the component of the cross section uncertainty caused by the JES uncertainty amounts to 15 (60) at (3 ).
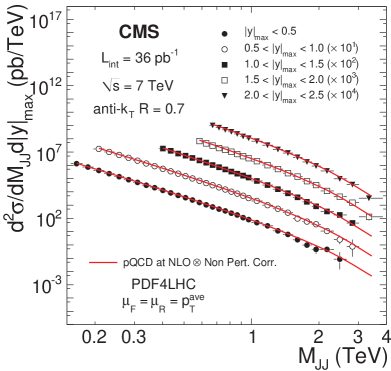
The cross section uncertainty due to the non-perturbative corrections mentioned above is comparably small, and amounts to 15 (2) at the same invariant masses. Finally, the present PDF uncertainty of the theoretical prediction is 5 (30), again at the same invariant masses. Consequently, still some improvement in the JES uncertainty is needed to get a precise constraint for the high-x region of the PDFs.
The next observable discussed is , the ratio of the 3-jet to 2-jet cross sections. For this analysis jets within and for are used. Being a ratio, , shown in Figure 6 as a function of , the scalar sum of the of all jets defined above, profits from cancellations of many systematic uncertainties. These are most notably the uncertainties from the imperfect knowledge of the jet energy scale and the one from the jet selection efficiency.
In this analysis the efficiency for 2-jet events is 100, whereas the efficiency for 3-jet events increases from 72 at to 100 at . The present resolution in translates into a resolution in of about 6 (3.5) at (1 ). The size of the correction to the particle level is small and only amounts to about 4 (2) for the two regions ( ).
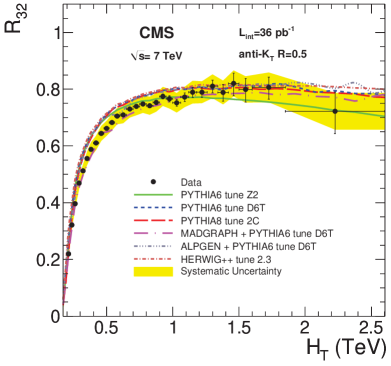
In this ratio, the total experimental uncertainty amounts to (4-10) and is mainly limited by the knowledge of the dependence in the Monte Carlo predictions entering the correction procedure. Consequently, the ratio is considerably more precise than the inclusive jet cross sections discussed above. The ratio reaches a plateau of about 0.8, where the actual value depends on the choice of jet algorithm and the jet selection criteria like the chosen rapidity range. The plateau region can be nicely described by a number of predictions, see Figure 7. However, the steep rise for low values of , originating from the increasing phase space for the emission of the third jet, is only adequately followed by the MadGraph prediction, i.e. all other predictions are too steep.

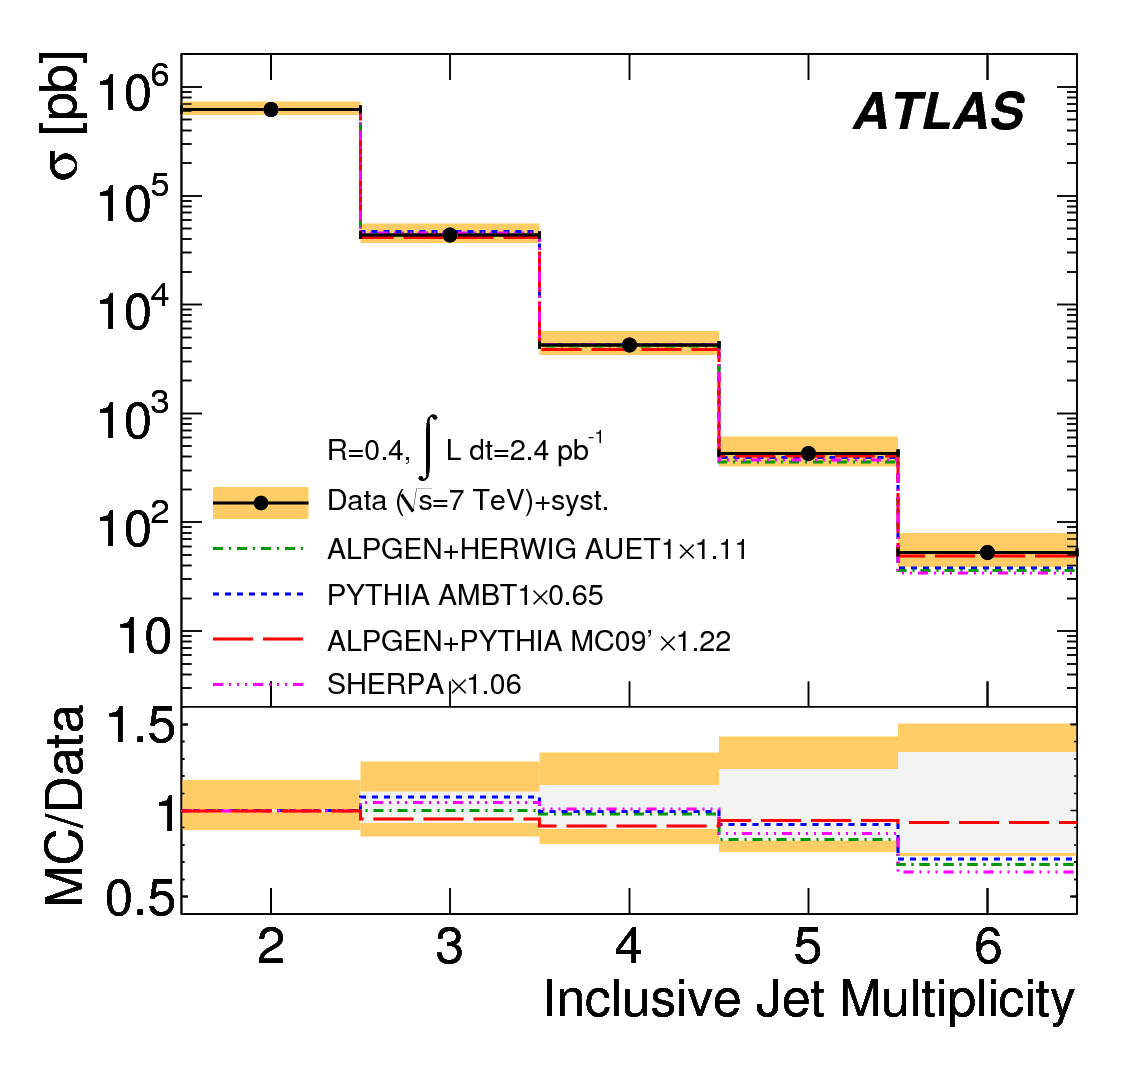
Finally, the cross section for multijet production for a minimum number of jets with is shown in Figure 8. Jets within are used, where in a ordered list the first jet is required to fulfill , and all others to fulfill . The present JES uncertainty is asymmetric. It amounts to 5 (2.5) at (1 ) and is larger than -3 everywhere.
Within uncertainties, the shape of the inclusive jet multiplicity can be accounted for by all predictions [3], which however do show a slightly steeper trend than the data. There are very significant differences in the absolute predictions that result in different overall scaling factors, ranging from 0.65 up to 1.22, which are applied to individually normalise the predictions to the bin, see Figure 8. The smallest scaling with only +6 is needed for the LO Sherpa prediction, the largest with -35 for the LO Pythia prediction.
In addition to the multiplicity also the differential cross sections for multijet production as a function of , and for different jet multiplicities is investigated. In this analysis, the systematic uncertainty is about (10-20) across , and increases to about 30 for the fourth leading jet differential cross section. The results for and are shown in Figure 9 and Figure 10.
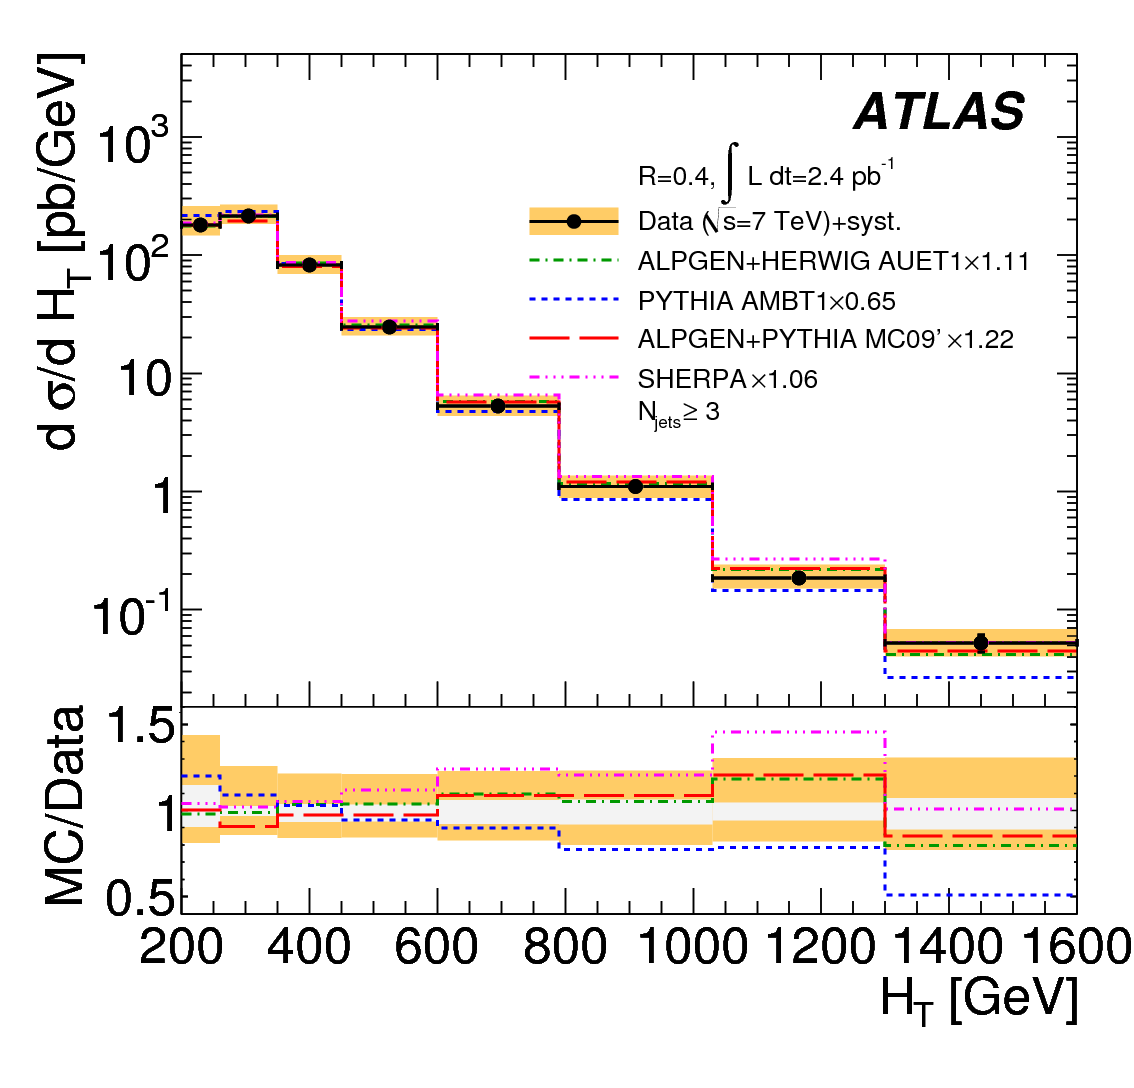
Again, within uncertainties the data in both multiplicity bins can be described by all shown predictions. In these distributions the LO prediction from the Pythia program is steeper than the LO predictions from either the Alpgen or the Sherpa package, a trend that can generally be observed when comparing LO to LO predictions.
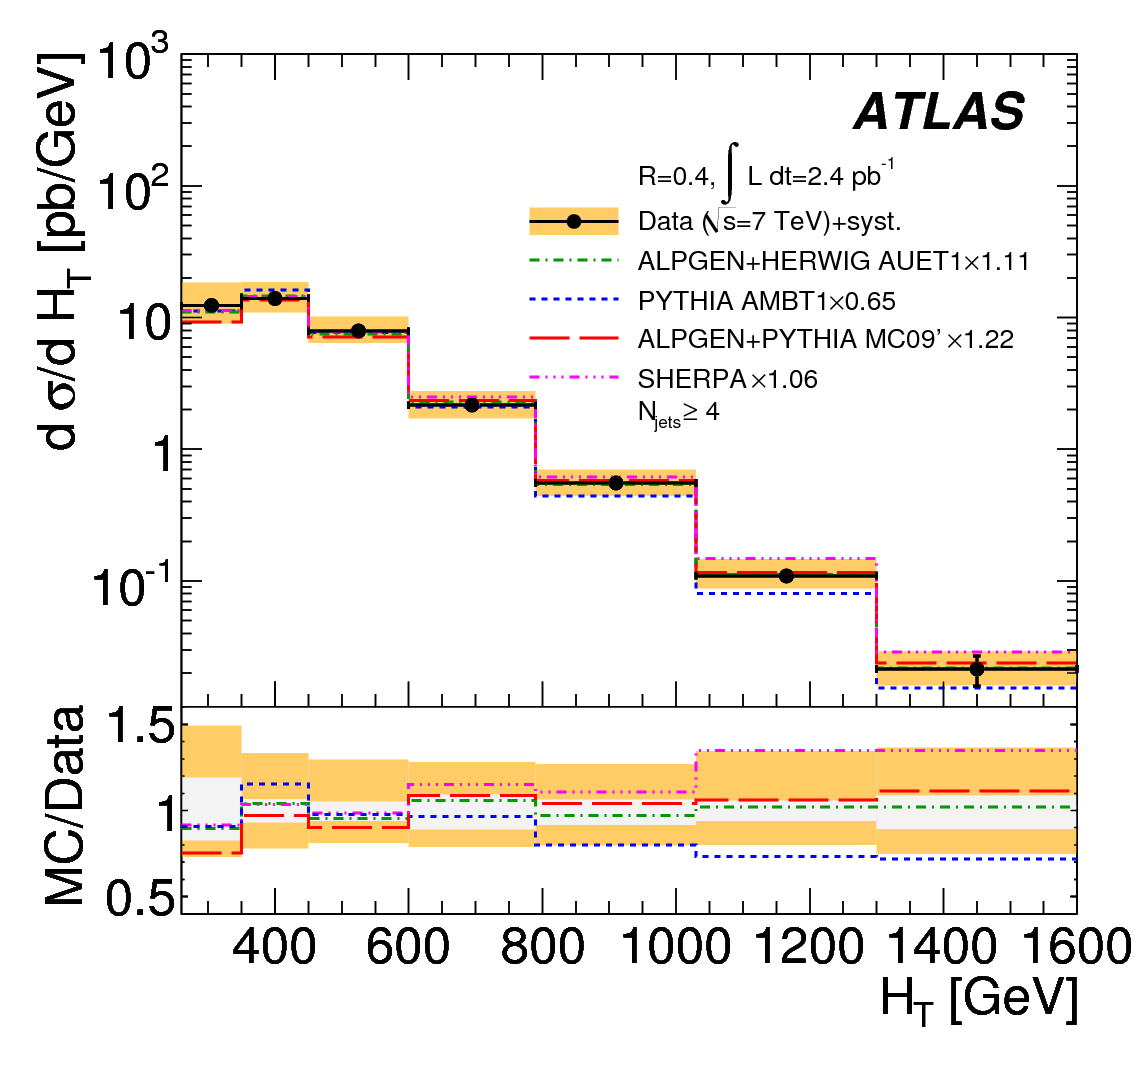
The shape differences in the two predictions based on the Alpgen software, but using different programs and tunings for the soft part of the simulation implemented in Herwig or Pythia are very small, demonstrating a low sensitivity of the shape of these differential cross sections to soft effects.
In addition to inclusive jet production, also more detailed investigations in quest for identifying BFKL signatures are performed [22]. In this analysis, starting from a dijet system defining a rapidity gap, the properties of that gap are investigated. The selection requirements for jets obtained with are: , , and an average transverse momentum of the two jets of the dijet system of .
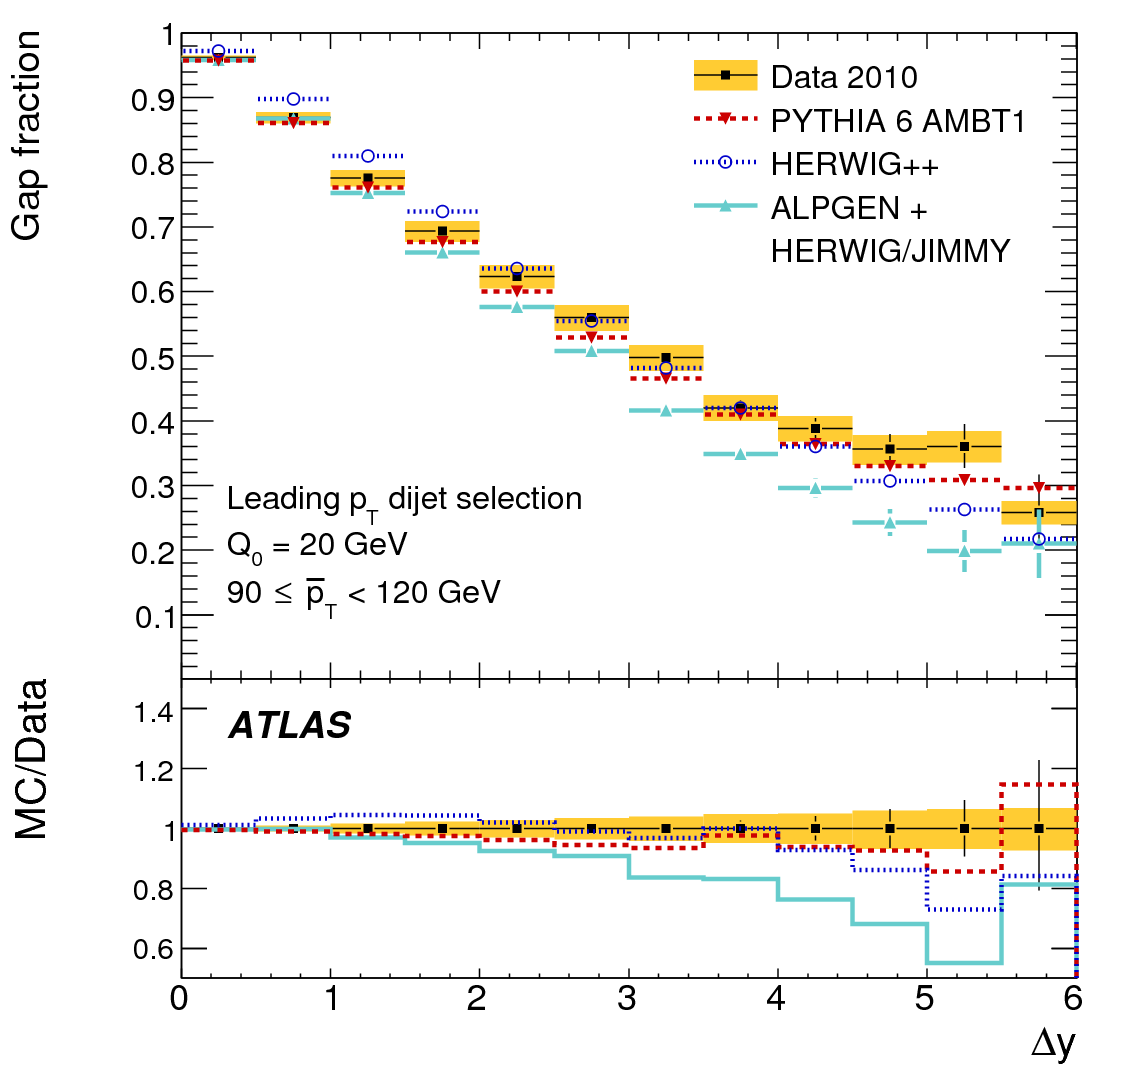
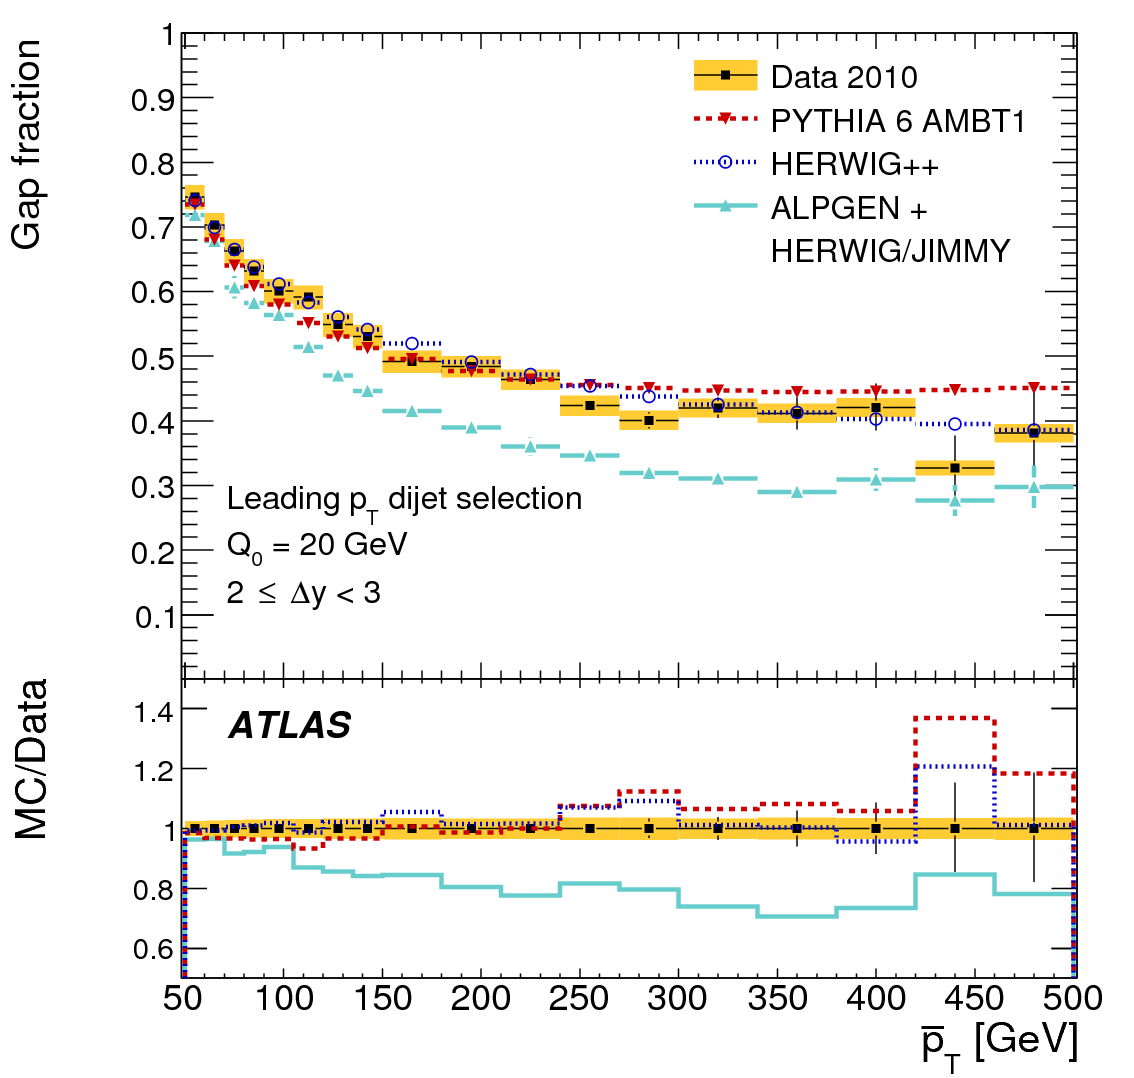
From these jets, the dijet system is either formed from the two highest jets (leading dijet selection), which typically have rather similar , or from the two jets with the largest rapidity gap, for which typically their invariant mass is much larger than their . The gap properties investigated are either the gap fraction, i.e. the fraction of events that do not contain any jet above a certain threshold, chosen to be , i.e. this scale satisfies , or the average jet multiplicity of exactly those additional jets. These observables probe wide angle soft gluon radiation for , BFKL dynamics for large , and finally colour singlet exchange if both conditions are fulfilled at the same time.
As an example, for the leading dijet selection the corrected gap fraction is shown in Figure 11 as a function of the rapidity gap for a given bin in , and in Figure 12 as a function of for a given bin in . The corrections to the stable particle level amount to about (2-4). The JES uncertainty is about (2-5) for the central region and 13 for the forward region, defined as . The resulting uncertainty on the gap fraction is about 3 (7) for the same rapidity ranges. The comparison to the theoretical predictions reveals that the LO predictions from Pythia and Herwig follow the data, except for large values of . In contrast, the Alpgen model predicts too many jets, i.e. a too small gap fraction, for both the and the dependence, except for low scales.
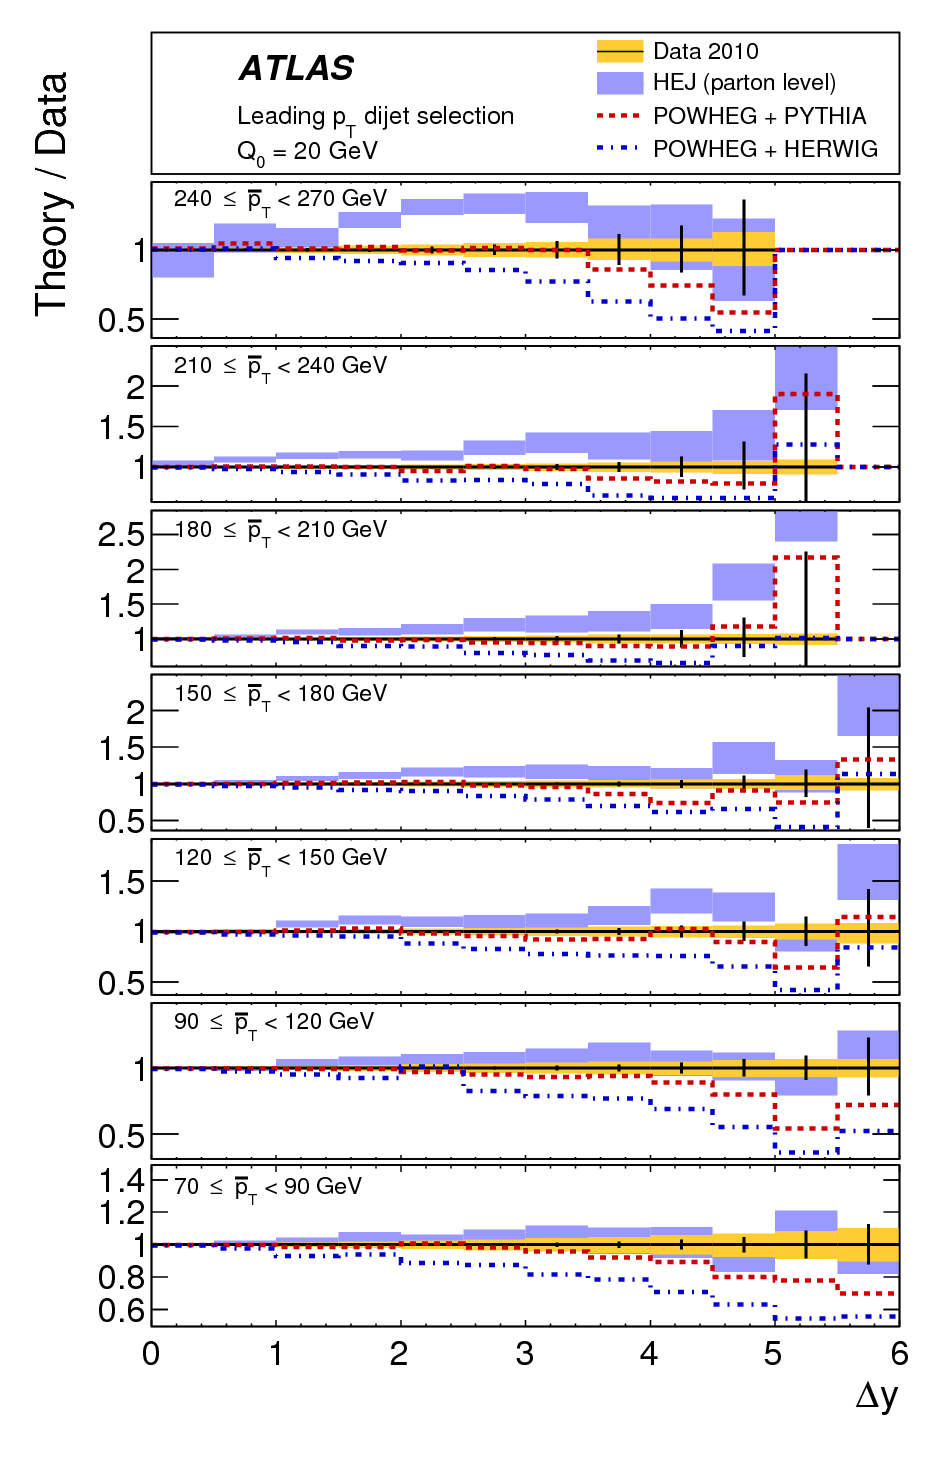
In Figure 13 the ratio of the predicted and the observed gap fractions for various higher order predictions is displayed as a function of , and for a number of narrow ranges in . The NLO prediction from the Powheg model generally has too much jet activity, with the Pythia fragmentation being closer to the data than the one from Herwig. The partially large spread between Powheg + Pythia and Powheg + Herwig indicates regions of phase space with sizeable contributions from soft effects to this observable. The difference of the Powheg model to the data increases for increasing . This can be attributed to the fact that the NLO plus PS prediction is lacking the full QCD ME contributions that become important as increases.
The prediction from the HEJ program are shown at the parton level, i.e. they will in addition be subject to soft effects that may be sizeable, see the Powheg discussion above. This prediction, apart from the region of low , has too few jets in the gap, especially so at large values of , and at large / for all values of . Again, this deviation from the data is expected, since the theoretical QCD prediction implemented in the HEJ program is only a valid approximation in the limit where all jets have similar .
3 W/Z-Boson plus jet production
Jet production, together with an additional hard scale provided by the mass of a heavy boson, is investigated in the W boson plus 1-jet and Z boson plus 1-jet production processes, using the leptonic decays of the heavy bosons and with electron or muon [23].
The driving idea in this analysis is to construct an observable with very small experimental uncertainty to perform a precise QCD test. Therefore, firstly, not individual cross sections, but the ratio of the W boson plus 1-jet and Z boson plus 1-jet production cross sections is utilised, and secondly, this ratio is investigated as a function of the threshold, and not in bins of .
In this analysis, jets have to fulfill and , and events with additional jets with are vetoed. The background contribution is small, below 5 in all channels, but for the QCD multijet background in the channel which is 19. All background estimates are taken from Standard Model Monte Carlo samples, except for the QCD multijet background. This is because this background can at present not be reliably modelled in the Monte Carlo programs, and is therefore, as for most analyses, taken from sideband regions in the data.
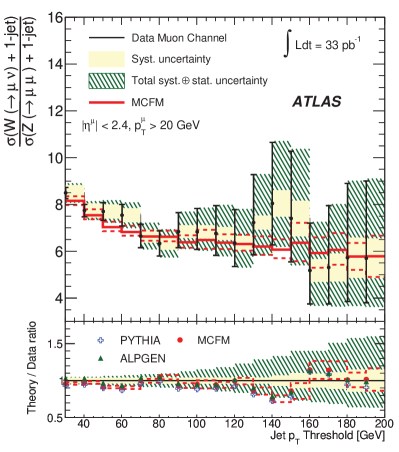
The result in the muon decay channel, corrected to the stable particle level with Pythia, is shown in Figure 14. As expected, the ratio decreases with increasing jet threshold, because the effective scale of the interaction becomes large with respect to the difference in the heavy boson masses. The systematic uncertainty (inner band) on the ratio is about (5-10), and in itself it has a large statistical component. The largest contribution to the systematic uncertainty is due to imperfections in the heavy boson reconstruction, including effects from the lepton trigger, reconstruction and identification efficiencies, and scale uncertainties for the lepton and missing transverse energy measurements. For transverse momenta larger than about 50 , the total uncertainty is dominated by the statistical uncertainty (vertical bars). This uncertainty will soon decrease given the large statistics of the completed 2011 LHC run, which amounts to about 5/fb.
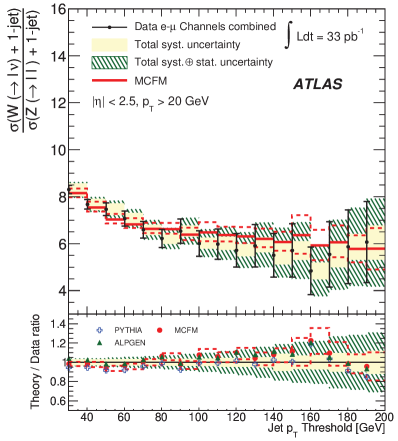
The measurements in both lepton decay channels are consistent and the combined result, evaluated for a common phase space region for the leptons, and based on data for an integrated luminosity of 33/pb, is shown in Figure 15. The final value of the ratio, corrected to the phase space of the leptons indicated, and for the lowest threshold of 30 , is .
The data are compared to three predictions: a LO prediction based on the Pythia program; a LO prediction from the Alpgen software; and finally, an NLO ME calculation for partons based on the MCFM program. All predictions fall within the still large experimental uncertainty band, but clearly the deviations between data and predictions partly exceed the systematic uncertainty of the data. In particular, the data are well described by the NLO MCFM prediction, for which the uncertainty (shown as dashed lines) is driven by the PDF uncertainty and the one due to scale variations. The experimental systematic uncertainties are smaller than those of these predictions, especially at large thresholds such that, after including the 2011 data, the experimental precision will challenge the NLO theoretical prediction.
4 Top-quark pair production
The LHC is a top quark factory. At the present proton-proton centre-of-mass energy of , the theoretical value of the production cross section, obtained from a computation approximating the NNLO prediction, and for an assumed input top quark mass of is about , with an uncertainty of about [24], see below for details. This cross section is about 20 times larger than the corresponding cross section at the Tevatron. The LHC experiments have already analysed a wide spectrum of top quark physics. The two observables discussed are the production cross section [25, 26] and the top quark mass [27].
The two most important quantities to be precisely evaluated for a cross section determination are: the selection efficiency for signal events, and the amount of background events present in the data. To achieve a high precision estimate in the LHC analyses, not only the overall normalisation of the background is used, but the shape of its contribution as a function of one or more variables discriminating signal and background processes is utilised.
An example of such a variable, the mass distribution of identified secondary vertices, is shown in Figure 16 [26]. This figure shows that the mass distributions originating from either light-quark jets or jets are significantly different. The mass distribution from jets stemming from charm quarks falls in between the two. Using this discriminant variable, a number of statistically independent sub-sets of data with different signal to background compositions are exploited.
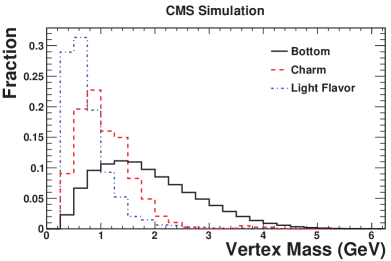
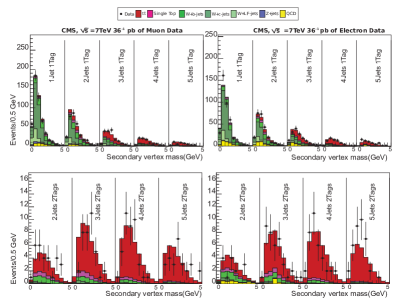
Figure 17 shows this set of distributions used in the fit for the decay in the e+jets and channels, for different jet multiplicities, and depending on the number of jets. The simulated signal events accumulate at large vertex masses, and their fraction grows with the numbers of observed jets and .
The use of the profile likelihood method allows systematic uncertainties, which are treated as nuisance parameters in the fit, to cancel each other within bounds. Therefore, this method in general leads to smaller uncertainties than are achieved when individually varying systematic effects to ascertain the corresponding uncertainties. This method requires a very good modelling of the correlation of the systematic uncertainties, since otherwise fortuitous cancellations can happen.
The variations of the systematic uncertainties are individually constrained in the fit by Gaussian priors. The different sources of systematic uncertainty are correlated or anti-correlated in the fit by up to absolute 70.
The determination of the cross section in the e+jets and channels leads to consistent results. The measured cross section, obtained from simultaneously fitting the distributions of both channels using data corresponding to only 36/pb of luminosity, Figure 17, has an uncertainty of about 20 pb and is already limited by systematic effects. The measured cross section value is pb with an additional uncertainty of 6 pb due to the uncertainty on the luminosity [26].
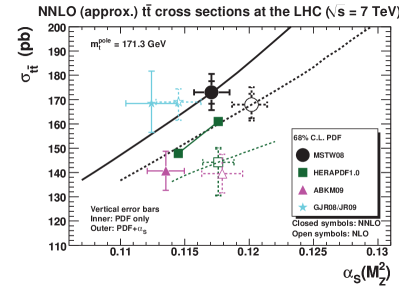
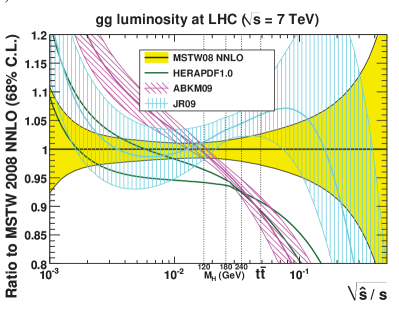
This measured cross section can be used to further constrain the PDFs. Since, at the LHC the production process is largely dominated by gluon-gluon processes, in contrast to the Tevatron, where it is dominated by quark-antiquark processes, this mostly concerns the gluon distribution function. Figure 18 shows the present theoretical knowledge of this cross section based on an NLO and an approximate NNLO calculation, and for various PDF sets [28]. The points are given at the respective value of of the corresponding PDF set. The NNLO corrections are small. The smallest cross section values are predicted when using the ABKM09 PDF set. This is correlated to the smallest predicted gluon-gluon luminosity at the production threshold and above, as shown in Figure 19 [28].
The difference in production cross section between the highest and lowest prediction at NNLO is about 33 pb, i.e. about 1.5 of the above described measurement. With improved measurements that are underway, and by combining the results from the ATLAS and CMS experiments, the gluon PDF can be significantly constrained.
The present average value of the top quark mass of is obtained from direct measurements performed at the Tevatron [30], and has a total uncertainty of . The main methodology used to determine at hadron colliders consists of measuring the invariant mass of the decay products of the top quark candidates and deducing using sophisticated analysis methods. The most precise measurements of this type use the decay with , where one W boson decays into a lepton and a neutrino and the other into a pair of quarks. These measurements rely on Monte Carlo programs to simulate the final state. The experimental observables are constructed such that they are unbiased estimators of the top quark mass used as an input parameter in the Monte Carlo, denoted with , which is verified using pseudo-experiments performed on large scale Monte Carlo simulated event samples. Consequently, the top quark mass determined this way corresponds to .
On the theoretical side, there are a number of definitions of the mass. The definition of the pole mass, , basically regards the quark as free and long lived. In contrast, for the mass definition, , the mass is treated like a coupling. The masses expressed in the two renormalisation schemes are related, and consequently can be converted into one another. Their difference is sizable compared to the experimental precision: leads to approximately , a difference of about 6, i.e. ten times the experimental uncertainty. Non of these definitions coincides with defined above, which leads to a problem in interpreting the experimental results. There are theoretical arguments [31] suggesting that is closer to than , and that is expected to be larger than , but no proof of this relation from first principles exists.
Theoretically, the pair production cross section is known in a given renormalisation scheme. The calculations are performed at NLO, NLO+(N)NLL or approximate NNLO precision, and have a strong dependence on the top quark mass. Consequently, it was suggested that by utilising this dependence, and extracting the top quark mass from the cross section, the problem explained above is absent, i.e. the resulting corresponds to a mass in a theoretically well defined concept. In addition, when the top quark mass is extracted from a comparison of the measured production cross section with its prediction as a function of the mass, one could profit from the fact that the relative uncertainty of the cross section translates into an about five times smaller uncertainty on the top quark mass, when neglecting the theoretical uncertainties.
This concept is only valid if the experimental determination of does not depend on the value of itself, which unfortunately is not the case. This is because also for the measurement of the cross section, is needed, since the Monte Carlo models are indispensable for evaluating the acceptance, efficiency and the systematic uncertainties in the experimental determination of the cross section.
Figure 20 shows the dependence of the measured production cross section [32] and its experimental uncertainty as a function of for (flattest of the three bands), for the Tevatron conditions. The measured cross section value is pb, with a symmetrised uncertainty of about 12.
Since the measured cross section depends on the value of , its relation to is important as can be seen from the second shifted band shown for the assumption , which now means approximately coincides with .
Experimentally, the top quark mass is essentially extracted from the overlap of the experimental band and the theoretical band (the steepest band shown), which in this figure is based on [33]. The result is indicated by the vertical lines in the figure. For a given assumption on , this yields with an uncertainty of about 3, showing the aforementioned reduction in relative uncertainty. However, the uncertainty of where to put the experimental band leads to an additional uncertainty on . For the example of the two extreme assumptions made in Figure 20, the corresponding difference in the extracted top quark mass is about 3 .
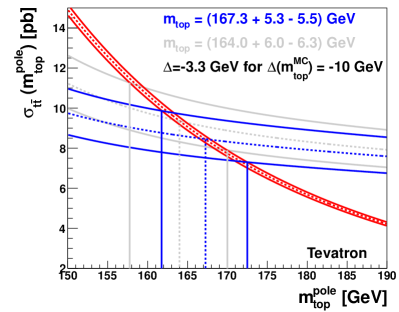
A similar situation is shown in Figure 21, again using the predictions from [33], but this time for LHC running conditions and assuming a somewhat steeper dependence of the measured cross section on . For this situation, the difference in the extracted top quark mass is correspondingly larger, and amounts to about 5 .
This investigation shows that to mitigate this uncertainty it is most important to find an independent selection, i.e. to select the signal events while depending as little as possible on absolute energy scales which directly relate to the actual value of . In addition, to reach a precision on of 0.6 as obtained in the direct measurements, this indirect extraction needs to achieve about a 3 precision on the measured cross section, which is a big challenge.
5 Conclusions
The analyses of the data from the first year of LHC running at a proton-proton centre-of-mass energy of resulted in a large variety of physics results concerning QCD observables, only a small part of which could be discussed here.
The investigation of jet production for a number of jet multiplicities already proved a helpful tool to better constrain QCD predictions of various types implemented in a large number of programs. The production of a heavy gauge bosons in conjunction with jets constitutes a high precision QCD test, the potential of which has just been started to be explored.
The LHC is a top quark factory with a twenty times larger production cross section for pair production of top quarks than at the Tevatron. The first measurements already give interesting hints on the size of the gluon PDF at large values of x. The determination of the top quark mass poses interesting challenges to the experiments and also to the interpretation of the measured values.
All results presented were based on about 35/pb of data from the 2010 LHC run. By now about 5/fb of data each have been collected by the ATLAS and CMS experiments in 2011. With this huge amount of data, the statistically limited analyses from 2010 data, can now be considerably expanded. For the analyses discussed in this paper, this especially applies to the measurements of the ratio of the heavy gauge bosons plus 1-jet cross sections.
The constantly increasing specific luminosity leads to more and more proton-proton interactions per bunch crossing which pose an increasing challenge to the proper treatment of the pileup. With an even better understanding of the detectors, a large number of interesting and precise measurements are ahead of us. The LHC experiments will constantly extend the highest scales at which QCD has ever been probed at accelerators.
Acknowledgements
I like to thank the organisers not only for the stimulating spirit of this meeting, but even more for their tireless enthusiasm during all the passed years. I am glad I could participate in the last conference of this series.
References
- [1] M. Cacciari, G.P. Salam and G. Soyez, The anti-k(t) jet clustering algorithm, JHEP 04 (2008) 63.
- [2] M. Cacciari, G.P. Salam and G. Soyez, The FastJet package, http://fastjet.fr/.
- [3] The ATLAS Collaboration, Measurement of multi-jet cross sections in proton-proton collisions at a 7 TeV center-of-mass energy, Eur. Phys. J. C71 (2011) 1763.
- [4] T. Sjöstrand, S. Mrenna and P.Z. Skands, PYTHIA 6.4 physics and manual, JHEP 05 (2006) 026.
- [5] G. Corcella et al., HERWIG 6: An event generator for hadron emission reactions with interfering gluons (including supersymmetric processes), JHEP 01 (2001) 010.
- [6] J.M Butterworth, J.R. Forshaw and M.H. Seymour, Multiparton interactions in photoproduction at HERA, Z. Phys. C72 (2006) 637.
- [7] T. Gleisberg et al., Event generation with SHERPA 1.1, JHEP 02 (2009) 007.
- [8] T. Stelzer and W.F. Long, Automatic generation of tree level helicity amplitudes, Nucl. Phys. Proc. Suppl. 37B (1994) 158.
- [9] J. Alwall et al., MadGraph/MadEvent v4: The new web generation, JHEP 09 (2007) 028.
- [10] M.L. Mangano et al., ALPGEN, a generator for hard multiparton processes in hadronic collisions, JHEP 07 (2003) 001.
- [11] J.M. Campbell, R.K. Ellis and D.L. Rainwater, Next-to-leading order QCD predictions for W+2 jet and Z+2 jet production at the CERN LHC, Phys. Rev. D68 (2003) 094021.
- [12] Z. Nagy, Next-to-leading order calculation of three jet observables in hadron hadron collision, Phys. Rev. D68 (2003) 094002.
- [13] S. Frixione and B.R. Webber, Matching NLO QCD computations and parton shower simulations, JHEP 06 (2002) 029.
- [14] S. Frixione, P. Nason and B.R. Webber, Matching NLO QCD and parton showers in heavy flavour production, JHEP 08 (2003) 007.
- [15] S. Frixione, P. Nason and C. Oleari, Matching NLO QCD computations with parton shower simulations: the POWHEG method, JHEP 11 (2007) 070.
- [16] J.R. Andersen and J.M. Smillie, High energy description of processes with multiple hard jets, Nucl. Phys. Proc. Suppl. 205-206 (2010) 205.
- [17] J.R. Andersen and J.M. Smillie, Multiple jets at the LHC with high energy jets, JHEP 06 (2011) 010.
- [18] P.Z. Skands, Tuning Monte Carlo generators: The Perugia tunes, Phys. Rev. D82 (2010) 074018.
- [19] The CMS Collaboration, Measurement of the inclusive jet cross section in pp collisions at TeV, Phys. Rev. Lett. 107 (2011) 132001.
- [20] The CMS Collaboration, Measurement of differential dijet production cross section in proton-proton collisions at TeV, Phys. Lett. B700 (2011) 187.
- [21] The CMS Collaboration, Measurement of the ratio of the 3-jet to 2-jet cross sections in pp collisions at TeV, Phys. Lett. B702 (2011) 336.
- [22] The ATLAS Collaboration, Measurement of dijet production with a veto on additional central jet activity in pp collisions at TeV using the ATLAS detector, JHEP 09 (2011) 053.
- [23] The ATLAS Collaboration, A measurement of the ratio of the W and Z cross sections with exactly one associated jet in pp collisions at TeV with ATLAS, Submitted to Phys. Lett. B (2011) arXiv:1108.4908.
- [24] M. Aliev et al., HATHOR: HAdronic Top and Heavy quarks crOss section calculatoR, Comput. Phys. Commun. 182 (2011) 1034.
- [25] The ATLAS Collaboration, Measurement of the top quark-pair production cross section with ATLAS in pp collisions at TeV, Eur. Phys. J. C71 (2011) 1577.
- [26] The CMS Collaboration, Measurement of the production cross section in pp collisions at 7 TeV in lepton + jets events using b-quark jet identification, Phys. Rev. D84 (2011) 092004.
- [27] The CMS Collaboration, Measurement of the production cross section and the top quark mass in the dilepton channel in pp collisions at TeV, JHEP 07 (2011) 049.
- [28] G. Watt, Parton distribution function dependence of benchmark Standard Model total cross sections at the 7 TeV LHC, JHEP 09 (2011) 069.
- [29] R.S. Thorne and G. Watt, PDF dependence of Higgs cross sections at the Tevatron and LHC: Response to recent criticism, JHEP 08 (2011) 100.
- [30] The Tevatron Electroweak Working Group for the CDF and D0 Collaborations, Combination of CDF and D0 results on the mass of the top quark using up to 5.8 of data (2011) arXiv:1107.5255.
- [31] A. Buckley et al., General-purpose event generators for LHC physics, Phys. Rept. 504 (2011) 145.
- [32] The D0 Collaboration V.M. Abazov et al., Determination of the pole and masses of the top quark from the cross section, Phys. Lett. B703 (2011) 422.
- [33] U. Langenfeld, S. Moch and P. Uwer, Measuring the running top-quark mass, Phys. Rev. D80 (2009) 054009.