New data strengthen the connection between Short Range Correlations and the EMC effect
Abstract
Recently published measurements of the two nucleon short range correlation (-SRC) scaling factors, , strengthen the previously observed correlation between the magnitude of the EMC effect measured in electron deep inelastic scattering at and the SRC scaling factor measured at . The new results have improved precision and include previously unmeasured nuclei. The measurements of for 9Be and 197Au agree with published predictions based on the EMC-SRC correlation. This paper examines the effects of the new data and of different corrections to the data on the slope and quality of the EMC-SRC correlation, the size of the extracted deuteron IMC effect, and the free neutron structure function. The results show that the linear EMC-SRC correlation is robust and that the slope of the correlation is insensitive to most combinations of corrections examined in this work. This strengthens the interpretation that both -SRC and the EMC effect are related to high momentum nucleons in the nucleus.
pacs:
25.30.Fj,13.60.Hb,21.30.-xI Introduction
The per-nucleon lepton deep inelastic scattering (DIS) cross sections of heavy nuclei are less than those of deuterium at moderate to large four-momentum transfer, (GeV/c)2, and (, where is the energy transfer and is the proton mass). This “EMC effect” was discovered in 1982 in the cross section ratios of iron to deuterium Aubert et al. (1983) and confirmed by many measurements on a range of nuclei Ashman et al. (1988); Gomez et al. (1994); Arneodo et al. (1988, 1990); Allasia et al. (1990); Seely et al. (2009). The latest data Seely et al. (2009) show that for light nuclei the EMC effect does not increase monotonically with increasing average nuclear density. While there is no generally accepted explanation of the EMC effect, proposed explanations generally need to include both nuclear structure effects (momentum distributions and binding energy) and modification of the bound nucleon structure.
A recent paper showed a strong correlation between the magnitude of the EMC effect and the Short Range Correlations (SRC) scaling factor Weinstein et al. (2011). Because the per-nucleon cross section ratios of nuclei to deuterium for decrease approximately linearly with , in this range of the EMC effect can be quantified by the slope of this ratio, Seely et al. (2009). The SRC scaling factor, , equals the ratio of the per-nucleon inclusive electron scattering cross section for nucleus to deuterium at (GeV/c)2 and . In this range of , the cross section ratio is constant Day et al. (1987); Frankfurt et al. (1993); Egiyan et al. (2003, 2006). The constancy of the ratio in this range of is attributed to high-momentum components of the nuclear wave function. These high momentum components have been shown to be almost entirely due to central and tensor nucleon-nucleon short range correlations Tang et al. (2003); Piasetzky et al. (2006); Shneor et al. (2007); Subedi et al. (2008); Baghdasaryan et al. (2010).
This correlation between the magnitude of the EMC effect measured at and the SRC scale factor measured at was used to phenomenologically determine the ratio of the DIS cross section for a proton and neutron bound in deuterium to the DIS cross section for free (unbound) pair and thus to determine the free neutron cross section for . The free neutron cross section was then used to determine the ratio of the neutron to proton structure function, and hence the ratio of in this range of .
Recently, high precision measurements of the per nucleon inclusive electron scattering cross section ratio for different nuclei relative to deuterium at (GeV/c)2 and were published Fomin et al. (2012), covering more nuclei at greater precision than previous measurements. These ratios also show scaling behavior for . This new data allows us to reexamine the observed linear correlation between the strength of the EMC effect and the SRC scaling factor Weinstein et al. (2011).
The analysis of the new data also includes various corrections to the measured cross section ratios that were not included in previous analyses Egiyan et al. (2003, 2006).
In this paper we examine the consistency of the old and new data and the effects of different corrections to the cross section ratios and therefore on the slope of the EMC-SRC correlation. We also examine the effects of these on the ratio of the bound to free DIS cross sections and on the free neutron structure function Hen et al. (2011a).
∗The 3He SRC scaling factor in column 2 from Ref. Egiyan et al. (2006) was determined primarily from the calculated ratio of the 3He and momentum distribution above the scaling threshold ( GeV/c).
∗∗The SLAC ratios Frankfurt et al. (1993) used cross sections from different experiments at different kinematics. They interpolated the deuterium cross sections to the kinematics of the cross sections measured for heavier nuclei and have larger uncertainties than the later measurements. They are included here for completeness.
| Egiyan et al. | EMC-SRC | Fomin et al. Fomin et al. (2012) | Fomin et al. | Fomin et al. Fomin et al. (2012) | SLAC | EMC Slope Weinstein et al. (2011) | |
| Egiyan et al. (2006) | Prediction Weinstein et al. (2011) | [Analysis as in | Fomin et al. (2012) | [excluding the CM | Frankfurt et al. (1993)∗∗ | ||
| Nucleus | Ref. Egiyan et al. (2006)] | motion correction] | |||||
| column | 2 | 3 | 4 | 5 | 6 | 7 | 8 |
| 3He | |||||||
| 4He | |||||||
| 9Be | |||||||
| 12C | |||||||
| 56Fe(63Cu) | |||||||
| 197Au | |||||||
| EMC-SRC slope | |||||||
II The New Data
New measurements by Fomin et al. Fomin et al. (2012) of the SRC scaling factor have about four times smaller uncertainties than previous ones by Egiyan et al. Egiyan et al. (2003, 2006). They also include two nuclei, 9Be and 197Au for which the SRC scaling factors were previously predicted based on their measured EMC effect Gomez et al. (1994); Seely et al. (2009) and the linear EMC-SRC correlation Weinstein et al. (2011). 9Be is of particular interest due to the anomalous density dependence of its EMC effect (its EMC effect is larger than that of 4He although its average density is much smaller) Seely et al. (2009). It therefore presents a challenging test for the prediction made in Weinstein et al. (2011) and for the validity of the EMC-SRC correlation in general.
The different measurements have different corrections applied to their results. Both sets of measurements applied radiative corrections to their measured cross section ratios. Egiyan et al. Egiyan et al. (2003, 2006) also applied isoscalar corrections to correct for differences in the per nucleon cross section ratio for asymmetric nuclei due to the difference between the elementary electron-proton and electron-neutron cross sections. Fomin et al. Fomin et al. (2012) did not apply the isoscalar correction but did apply corrections for the nuclear coulomb field, inelastic contributions, and SRC-pair center of mass motion. Inspired by results of exclusive 12C and 12C measurements, which showed that -SRC pairs are dominated by neutron-proton pairs ( times more neutron-proton then proton-proton pairs were observed) Tang et al. (2003); Piasetzky et al. (2006); Shneor et al. (2007); Subedi et al. (2008); Baghdasaryan et al. (2010), Fomin et al. assumed that at , electrons scatter mainly off neutron-proton pairs and therefore isoscalar corrections are unnecessary. The largest correction made by Fomin et al. is a correction for enhancement of the cross section ratio (and therefore of the SRC scaling factors) due to the SRC-pair center of mass (c.m.) motion for . The c.m. correction is defined as the ratio of the convolution of the pair c.m. motion and deuteron momentum distributions to the deuteron momentum distribution. This ratio was calculated in Fomin et al. (2012) for 56Fe using the SRC-pair momentum distributions of Ciofi degli Atti and Simula Ciofi degli Atti and Simula (1996). It was then scaled to other nuclei based on the -dependence of the pair motion. Due to uncertainties in the calculation, including its and dependence, they applied an uncertainty equal to of the calculated correction.
Table 1 lists the per nucleon cross section ratios for all nuclei measured by Fomin et al. The second column shows the ratios measured by Egiyan et al. that were used in the original EMC-SRC analysis Weinstein et al. (2011). Fomin et al. measured 63Cu, which was not measured by Egiyan et al.; we assume the SRC scaling factor of 63Cu to be the same as that of 56Fe. The values of 9Be and 197Au in the third column are those predicted by Ref. Weinstein et al. (2011) based on their measured EMC effect and the linear EMC-SRC correlation. The fourth column shows the Fomin et al. results, analyzed in the same manner as the Egiyan data (i.e., including radiative and isoscalar corrections only). The fifth column shows the Fomin et al. results as published (i.e., including inelastic, radiative, coulomb, and center of mass motion corrections). The sixth column shows the as published Fomin et al. results with the center of mass motion correction removed (i.e., including inelastic, radiative, and coulomb corrections). Comparing the second and fourth columns, one can see that the measured values of from the two measurements agree within uncertainty when analyzed with the same corrections (radiative and isoscalar corrections only). Applying the radiative, coulomb field and inelastic (but not the isoscalar) corrections changes the measured scale factors by about 10%. Applying the SRC-pair center of mass motion correction decreases the ratios by 10% to 20%. The last column of Table 1 shows the magnitude of the EMC effect for the different nuclei as measured by Gomez et al. (1994); Seely et al. (2009) and averaged by Weinstein et al. (2011).
III The EMC-SRC correlation
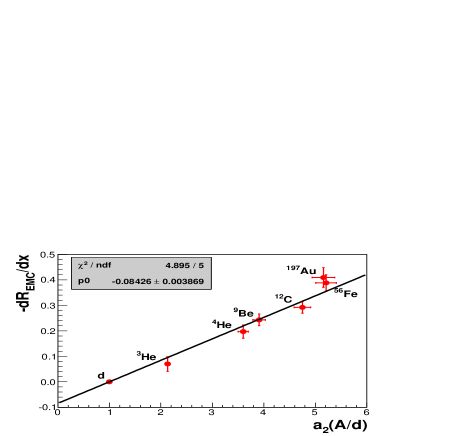
The quality of the correlation between the magnitude of the EMC effect and the newly measured SRC scaling factors, , is shown in Fig. 1. Due to the large uncertainties of the SRC-pair center-of-mass motion correction, Fig. 1 shows the data of Fomin et al. as published but without that correction. Fig. 1 also shows the results of a one-parameter fit to the EMC slopes as a function of the SRC scaling factors. Because the point for the deuteron is fixed at and , the fitted slope is also the negative of the intercept of the line.
In order to test the robustness of the EMC-SRC correlation, we made a series of one-parameter linear fits to the EMC slopes (Table 1 column 8) as a function of the different SRC scaling factors shown in Table 1. The per degree of freedom for each of these fits was approximately one, indicating an excellent fit. In addition, the values of predicted for 9Be and 197Au by Ref. Weinstein et al. (2011) agree within uncertainties with the new values measured by Fomin et al. with the radiative and isoscalar corrections from Egiyan et al. (2006).
Following Ref. Weinstein et al. (2011), the value corresponds to the limit of free nucleons with no SRC. If we extrapolate the linear fit to this point, this should give us the EMC ratio for a free (unbound) pair to the deuteron, the so-called In-Medium Correction (IMC) effect. The IMC effect then equals the negative of the fitted EMC-SRC slope. This value ranges from to for the different data sets with the different corrections (excluding the cm motion correction). If we include the SRC-pair center of mass motion correction, then the linear fit is still excellent. However the slope and hence the intercept increases by about 20% to .
Since the EMC effect is linear for , we have (also following Weinstein et al. (2011)),
where and are the measured DIS deuteron and proton cross sections, is the unmeasured free neutron cross section, and is the average value of where the EMC effect is unity (i.e., where the per-nucleon cross sections are equal). Evaluating this at gives the ratio of the free cross section to the bound (deuteron) cross section which ranges from to for the different data sets and corrections (again excluding the cm motion correction). If we include the cm motion correction, then this ratio changes to .
The agreement of the slope of the EMC-SRC correlation, and therefore of the deuteron IMC effect at , among all combinations of data sets and corrections is a clear indication of the robustness of the EMC-SRC correlation. This also indicates that the deuteron IMC effect and the free neutron structure function extracted in Weinstein et al. (2011) and used in Hen et al. (2011a) do not change due to the new data and/or analysis. If the center of mass motion correction is included, then the linearity of the EMC-SRC relation improves slightly and the deuteron IMC effect increases by about 20% to .
IV Conclusions and Outlook
New higher precision data Fomin et al. (2012) strengthens the phenomenological correlation between the strength of the EMC effect and the relative amount of SRC-correlated pairs in a nucleus Weinstein et al. (2011). The new measurements are consistent with the SRC scaling factors for 9Be and 197Au that were predicted based on this EMC-SRC correlation. Different corrections for the SRC cross section ratio were examined and all were shown to be consistent with a linear correlation between the strength of the EMC effect and the relative amount of SRC correlated pairs in nuclei. The linearity of the EMC-SRC correlation, regardless of the exact corrections considered, is a clear indication of the robustness of the EMC-SRC correlation.
This strengthens the speculation presented in Weinstein et al. (2011) that both the EMC effect and -SRC originate from high momentum nucleons in the nucleus.
More data is required to further map out and understand this correlation. Several experiments approved to run as part of the 12 GeV program at Jefferson Lab will measure both the SRC scaling factors and the EMC effect at high precision over a wide range of light and heavy nuclei Arrington and Day (2006); Arrington et al. (2010); Solvignon-Slifer and Arrington (2011). Another experiment Hen et al. (2011b) will search for medium modification of the structure function of deeply bound, high momentum, nucleons. This will be done by performing DIS scattering off high momentum nucleons in deuterium and tagging the partner (high momentum) recoil nucleon. The results of this experiment will allow to compare the structure function of free and bound nucleons and gain insight on the connection of the EMC effect to high momentum nucleons in the nucleus.
References
- Aubert et al. (1983) J. Aubert et al., Phys. Lett. B 123, 275 (1983).
- Ashman et al. (1988) J. Ashman et al., Phys. Lett. B 202, 603 (1988).
- Gomez et al. (1994) J. Gomez et al., Phys. Rev. D 49, 4348 (1994).
- Arneodo et al. (1988) M. Arneodo et al., Phys. Lett. B 211, 493 (1988).
- Arneodo et al. (1990) M. Arneodo et al., Nucl. Phys. B 333, 1 (1990).
- Allasia et al. (1990) D. Allasia et al., Phys. Lett. B 249, 366 (1990).
- Seely et al. (2009) J. Seely et al., Phys. Rev. Lett. 103, 202301 (2009).
- Weinstein et al. (2011) L. B. Weinstein, E. Piasetzky, D. W. Higinbotham, J. Gomez, O. Hen, and R. Shneor, Phys. Rev. Lett. 106, 052301 (2011).
- Day et al. (1987) D. B. Day et al., Phys. Rev. Lett. 59, 427 (1987).
- Frankfurt et al. (1993) L.L. Frankfurt, M.I. Strikman, D.B. Day and M. Sargsian, Phys. Rev. C 48, 2451 (1993).
- Egiyan et al. (2003) K. Egiyan et al. (CLAS Collaboration), Phys. Rev. C 68, 014313 (2003).
- Egiyan et al. (2006) K. Egiyan et al. (CLAS Collaboration), Phys. Rev. Lett. 96, 082501 (2006).
- Tang et al. (2003) A. Tang et al., Phys. Rev. Lett. 90, 042301 (2003).
- Piasetzky et al. (2006) E. Piasetzky, M. Sargsian, L. Frankfurt, M. Strikman, and J. W. Watson, Phys. Rev. Lett. 97, 162504 (2006).
- Shneor et al. (2007) R. Shneor et al., Phys. Rev. Lett. 99, 072501 (2007).
- Subedi et al. (2008) R. Subedi et al., Science 320, 1476 (2008).
- Baghdasaryan et al. (2010) H. Baghdasaryan et al. (CLAS Collaboration), Phys. Rev. Lett. 105, 222501 (2010).
- Fomin et al. (2012) N. Fomin et al., Phys. Rev. Lett. 108, 092502 (2012).
- Hen et al. (2011a) O. Hen, A. Accardi, W. Melnitchouk, and E. Piasetzky, Phys. Rev. D 84, 117501 (2011a).
- Ciofi degli Atti and Simula (1996) C. Ciofi degli Atti and S. Simula, Phys. Rev. C 53, 1689 (1996).
- Arrington and Day (2006) J. Arrington and D. Day, Inclusive Scattering from Nuclei at in the quasielastic and deeply inelastic regimes, Jefferson Lab Experiment E12-06-105 (2006).
- Solvignon-Slifer and Arrington (2011) P. Solvignon-Slifer and J. Arrington, Precision measurement of the isospin dependence in the 2N and 3N short range correlation region, Jefferson Lab Experiment E12-11-112 (2011).
- Arrington et al. (2010) J. Arrington, D. Gaskell, and A. Daniel, Detailed studies of the nuclear dependence of in light nuclei, Jefferson Lab Experiment E12-10-008 (2010).
- Hen et al. (2011b) O. Hen, L. Weinstein, S. Wood, and S. Gilad, In Medium Nucleon Structure Functions, SRC, and the EMC effect, Jefferson Lab experiment E12-11-107 (2011b).