11email: matute, isabel, pepa, cesar, chony, jaime, emilio, benitez, mcs, rosa, amb, fprada, quintana@iaa.es 22institutetext: Instituto de Física de Cantabria (CSIC-UC), E–39005, Santander, Spain; fsoto@ifca.unican.es 33institutetext: Centro de Estudios de Física del Cosmos de Aragón (CEFCA), E–44001 Teruel, Spain; moles, dch@cefca.es 44institutetext: Instituto de Astrofísica de Canarias, La Laguna, Tenerife, Spain; jalfonso@iac.es 55institutetext: School of Physics and Astronomy, Tel Aviv University, Israel; tjb@wise.tau.ac.il 66institutetext: Facultad de Física. Departamento de Física Atómica, Molecular y Nuclear. Universidad de Sevilla, Sevilla, Spain; jcc-famn@us.es 77institutetext: Institut de Ciències de l’Espai, IEEC-CSIC, Barcelona, Spain; fjc@ieec.fcr.es 88institutetext: Departamento de Astrofísica, Facultad de Física, Universidad de la Laguna, Spain; jcn@iac.es 99institutetext: Departamento de Astronomía, Pontificia Universidad Católica, Santiago, Chile; linfante@astro.puc.cl 1010institutetext: Departament d’Astronomía i Astrofísica, Universitat de València, Valencia, Spain; vicent.martinez@uv.es 1111institutetext: Observatori Astronòmic de la Universitat de València, Valencia, Spain
Quasi–stellar objects in the ALHAMBRA survey ††thanks: Based on observations collected at the German-Spanish Astronomical center, Calar Alto (Almeria, Spain), jointly operated by the Max-Planck-Institut für Astronomie at Heidelberg and the Instituto de Astrofísica de Andalucía (CSIC).
Abstract
Context. Even the spectroscopic capabilities of today’s ground and space–based observatories can not keep up with the enormous flow of detections ( deg-2) unveiled in modern cosmological surveys as: ) would be required enormous telescope time to perform the spectroscopic follow-ups and ) spectra remain unattainable for the fainter detected population. In the past decade, the typical accuracy of photometric redshift (photo-) determination has drastically improved. Nowdays, it has become a perfect complement to spectroscopy, closing the gap between photometric surveys and their spectroscopic follow-ups. The photo- precision for active galactic nuclei (AGN) has always lagged behind that for the galaxy population owing to the lack of proper templates and their intrinsic variability.
Aims. Our goal is to characterize the ability of the Advanced Large, Homogeneous Area Medium-Band Redshift Astronomical (ALHAMBRA) survey in assigning accurate photo-’s to broad-line AGN (BLAGN) and quasi-stellar objects (QSOs) based on their ALHAMBRA very–low–resolution optical–near-infrared spectroscopy. This will serve as a benchmark for any future compilation of ALHAMBRA selected QSOs and the basis for the statistical analysis required to derive luminosity functions up to .
Methods. We selected a sample of spectroscopically identified BLAGN and QSOs and used a library of templates (including the SEDs of AGN, and both normal and starburst galaxies, as well as stars) to fit the 23 photometric data points provided by ALHAMBRA in the optical and near-infrared (20 medium–band optical filters plus the standard JHKs).
Results. We find that the ALHAMBRA photometry is able to provide an accurate photo- and spectral classification for 88% of the 170 spectroscopically identified BLAGN/QSOs over 2.5 deg2 in different areas of the survey and brighter than (equivalent to ). The derived photo- accuracy is below 1% and is comparable to the most recent results in other cosmological fields that use photometric information over a wider wavelength range. The fraction of outliers (12%) is mainly caused by the larger photometric errors for the faintest sources and the intrinsic variability of the BLAGN/QSO population. A small fraction of outliers may have an incorrectly assigned spectroscopic redshift.
Conclusions. The definition of the ALHAMBRA survey in terms of the number of filters, filter properties, areal coverage, and depth is able to provide photometric redshifts for BLAGN/QSOs with a precision similar to any previous survey that makes use of medium-band optical photometry. In agreement with previous literature results, our analysis also reveals that, in the redshift interval, very accurate photo- can be obtained without the use of near-infrared (NIR) broadband photometry at the expense of a slight increase in the outliers. The importance of NIR data is expected to increase at higher (). These results are relevant for the design of future optical follow-ups of surveys containing a large fraction of BLAGN, such as many X–ray or radio surveys.
Key Words.:
cosmology: Observations – galaxies: active – galaxies: distances and redshifts galaxies: evolution – galaxies: high-redshift – quasars: general1 Introduction
The role of active galactic nuclei (hereafter AGN) in the formation of the early structures and their later evolution has been reviewed over the past 15 years, becoming a key ingredient of galaxy evolution models (e.g. Cattaneo 2002; Menci et al. 2003; Croton et al. 2006; Hopkins et al. 2010 and references therein). Evidence shows that many, if not all, massive galaxies harbor supermassive black holes (SMBHs; e.g. Kormendy & Richstone 1995). The close interaction between the formation and growth of the SMBH and the evolution of its host galaxy were initially revealed by: ) the tight correlations between the masses of central SMBHs and the velocity dispersions and luminosities of the bulges of many galaxies (Tremaine et al. 2002); ) the remarkable similarities in the redshift at which starburst and accretion activities ocurred and ) the observation of the so–called downsizing effect not only for the galaxy population but also for AGN, i.e. the most massive galaxies appear to have assembled the majority of their stars earlier than lower mass galaxies (Cowie et al. 1996; Zheng et al. 2007), while the density of low–luminosity AGN peaks at lower than the more powerful ones (e.g. Hasinger et al. 2008 and references therein). Therefore, the measure of the space density of AGN with cosmic time not only provides information about the relative importance of accretion activity to the global energy output in the universe but also places important constraints on early structure formation and galaxy evolution (e.g. Di Matteo et al. 2005, Hopkins et al. 2010).
Quasi-stellar objects (QSOs) are the members of the AGN family that have particularly high intrinsic luminosities allowing them to be detected at large distances and to provide unique inside into the early history of the AGN-host galaxy interaction. Moreover, QSOs are potential contributors to the ultraviolet (UV) ionizing background (Cowie et al. 2009) and have probably played a non-negligible role in the reionization of the universe (Fan et al. 2006, Wang et al. 2010).
The optical selection of QSOs has been performed mainly with follow-up spectroscopic observations of color–color selected candidates (e.g. SDSS, Richards et al. 2002 and 2dF, Croom et al. 2004). These observations use slitless or prism spectroscopic surveys and poorly efficient flux–limited spectroscopic surveys (e.g. VIMOS–VLT Deep Survey, Gavignaud et al. 2006; Bongiorno et al. 2007). A novel technique with respect to previous selection criteria was introduced by the CADIS (Meisenheimer et al. 1998) and COMBO–17 surveys (Wolf et al. 2003). These photometric surveys used several optical broad– and medium–band filters to characterize the nature of the detected population and derive its photometric redshift (photo-) via the spectral energy distributions (SEDs). The fluxes reached by the survey have allowed the study of the high- QSO population, thus overcoming the problem of QSO incompleteness in the redshift interval (Richards et al. 2002). This redshift range is important because it corresponds to the peak and the turnover of the observed QSO space density (e.g. Wolf et al. 2004).
Over the past decade, a clearer understanding of the QSO evolution has been achieved thanks to a more accurate characterization of their different SEDs, to a more precise treatment of their variability, and to a significant improvement in their photo- determination. This advance has been encouraged by the conception of modern cosmological surveys and newly available space-based observing facilities (e.g. HST, XMM–Newton, Chandra, Spitzer and Herschel among others) that have been able to detect a large amount of sources (). In particular, when a given scientific goal does not require detailed knowledge of the spectral properties of individual objects, properly designed photometric surveys can provide a highly reliable photo- and spectral classification for each source. These photo-’s are an essential complement to the usually small fraction of sources with spectroscopic redshifts in major extragalactic surveys and to more reliably probe the fainter detected population, which is difficult to access using current ground-based spectroscopic observatories. In addition, photo- are used to validate uncertain spectroscopic redshifts typically obtained for spectra of low signal-to-noise ratio (S/N) or limited wavelength coverage (e.g. Fernández-Soto et al. 2001). Several computational methods have been developed to derive photometric redshifts with increasingly high precision (BPZ, HyperZ, LePhare, ZEBRA, AnnZ, EAzY, among others). Only recently have photo- for AGN (Salvato et al. 2009; Luo et al. 2010; Cardamone et al. 2010) reached accuracies similar to those computed for normal and starburst galaxies (1–2%; e.g. Ilbert et al 2009). A description of the current state of the art photo- computation as well as a detailed performance comparison of various photo- codes was provided by Hildebrandt et al. (2010).
In this context, we present the analysis of photometric redshift solutions found for a population of spectroscopically identified QSOs using the optical and near-infrared (NIR) multi-band catalog of the ALHAMBRA survey. The ALHAMBRA survey was designed with an optimal filter combination in order to provide one of the most homogeneous, large, deep, and accurate photometric surveys. Given the proposed depth of the ALHAMBRA filters of AB24.5–25, we expect to sample the whole QSO LF up to and up to z6 for sources with . At the current stage, the survey has mapped 2.5 deg2 of the sky in seven different regions. The results presented here, and the comparison with existing data from other cosmological surveys, will prove the capabilities of the survey to derive accurate photometric redshifts for the BLAGN/QSO population. Furthermore, this test will potentially identify redshift ranges for which QSO photo- estimation maybe unreliable or QSOs with atypical SEDs that would then be suitable for more detailed study.
This paper is structured as follows. In Sect. 2, we describe the current photometric catalog from the ALHAMBRA survey as well as the ancillary data available in each of the ALHAMBRA fields from other cosmological surveys. This section also introduces the QSO sample selection. The methodology followed during the photo- determination is discussed in Sect. 3 while in Sect. 4 we quantify the precision of our photo- estimates by comparing them with previous results for this type of sources. Finally, Sect. 5 discusses the implications of our results and planned future analysis. A detailed QSO catalog will be presented in a forthcoming paper. Throughout our analysis, we assume a CDM cosmology with , , and . Unless otherwise specified, all magnitudes are given in the AB system.
2 Data set
| Field | alpha(J2000) | delta(J2000) | Area (deg2) | Obs. period | Surveys | E() | Spectro-QSO | Source |
|---|---|---|---|---|---|---|---|---|
| () | () | () | () | () | () | () | () | () |
| ALH-2 | 02 28 32.0 | +00 47 00 | 0.50 | Sep05–Nov09 | DEEP2 | 0.030 | 30/29 | 1,2 |
| ALH-3 | 09 16 20.0 | +46 02 20 | 0.25 | Dec04–May09 | SDSS | 0.015 | 2/2 | 1 |
| ALH-4 | 10 00 28.6 | +02 12 21 | 0.25 | Dec04–May09 | COSMOS | 0.018 | 81/77 | 3 |
| ALH-5 | 12 35 00.0 | +61 57 00 | 0.25 | May05–Jun09 | HDF-N | 0.011 | 18/15 | 1,4,5 |
| ALH-6 | 14 16 38.0 | +52 25 05 | 0.19 | Aug04–Aug09 | EGS-AEGIS | 0.011 | 35/33 | 1,2,6 |
| ALH-7 | 16 12 10.0 | +54 30 00 | 0.50 | Aug04–Jul09 | SWIRE/ELAIS-N1 | 0.007 | 11/11 | 1,4,7 |
| ALH-8 | 23 45 50.0 | +15 34 50 | 0.50 | Aug04–Aug09 | SDSS | 0.024 | 3/3 | 1 |
| TOTAL QSOs$a$$a$footnotetext: | 2.44 | 180/170 |
()= ALHAMBRA field name; (,)=Central coordinates of the field; ()= Area covered by each field; ()= Period between the beginning and the end of the observations in a given field; ()= Name of the cosmological survey for which a particular ALHAMBRA field overlaps; ()= Mean Galactic reddening along the line of sight derived by Schlegel, Finkbeiner & Davis (1998) from the 100 m data; ()= Total number of spectroscopically identified QSOs in the field and those within our selection criteria; ()= Source of the QSO classification and spectroscopic redshift: (1)= Schneider et al. (2010) ; (2)= DEEP webpage, Davis et al. (2003); (3)=Brusa et al. (2010); (4)= Veron–Cetty, M. P. & Veron, P. (2010); (5)= Barger et al. (2008); (6)= C. Willmer priv. comm; (7)= Rowan-Robinson et al. (2008);
$a$$a$footnotetext: Sum over all the ALHAMBRA fields of the total/selected spectroscopic QSOs.
2.1 Photometric data: The ALHAMBRA survey.
The ALHAMBRA222http://alhambra.iaa.es:8080 (Advanced, Large, Homogeneous Area, Medium-Band Redshift Astronomical) survey provides a photometric dataset over 20 contiguous, equal-width, non-overlapping, medium-band optical filters (3500 – 9700 Å) plus 3 standard broad-band NIR filters , , and Ks over 8 different regions of the northern hemisphere (Moles et al. 2008). The survey aims to understand the evolution of the structures and the different families of extragalactic sources throughout cosmic time by sampling a large enough cosmological fraction of the universe. This requires precise photometric redshifts for several hundreds of thousands objects and, therefore, a survey with high photometric accuracy as well as deep and wide spectral coverage over a large area. The simulations of Benítez et al. (2009), relating the image depth and photo- accuracy to the number of filters, have demonstrated that the filter–set chosen for ALHAMBRA can achieve a photo- precision, for normal and star-forming galaxies, that is three times better than a classical 4–5 optical broad-band filter set. The final survey parameters and scientific goals, as well as the technical properties of the filter set were described by Moles et al. (2008). The survey has collected its data for the 20+3 optical-NIR filters in the 3.5m telescope, at the Calar Alto observatory333http://www.caha.es, using the wide–field camera LAICA in the optical and the OMEGA–2000 camera in the NIR. The full characterization, description, and performance of the ALHAMBRA optical photometric system was presented by Aparicio–Villegas et al. (2010). The strategy of ALHAMBRA for each run has been to observe the fields with the lowest airmasses trying to complete the requested integration time for each filter in order to reach the planned depth (ABmag25). In consequence, and depending also on the telescope/instrument downtime and weather, the time to complete each filter in each field can vary from months to several years444Further details of the observations will be provided in a companion paper.. Therefore, although ALHAMBRA photometry allows us to detect variability, the lack of a common band(s) taken during all the observing runs does not allow us to correct for its effect. The deep NIR counts in one of the ALHAMBRA fields (ALH-8), over 0.5 deg2, which has a 50% detection efficiency depth of , , and (Vega), have been analyzed by Cristóbal–Hornillos et al. (2009). Their results helped to constrain different type-dependent galaxy evolutionary models.
In this work, we used the seven ALHAMBRA fields for which data have been currently observed and reduced. The central coordinates of these 7 fields, the area covered by each, the observing epoch, their coincidence with other cosmological surveys, and their mean Galactic extinction are detailed in Table 1. The total number of spectroscopically identified QSOs, as well as the fraction selected for our analysis, are given in Col. 7 of Table 1. Figure 1 and Table 2 detail the general characteristics of the ALHAMBRA 23 filter set.

The photometric data points used in this work are given by the MAG_AUTO measure by SExtractor (Bertin & Arnouts 1996). To avoid the excessive weight of some points in the computation of a photo-, we adopted a minimum photometric error of (i.e. if a photometric error is smaller than 0.05, it is set to 0.05) for the method described in Sect. 3. In agreement with the results of other authors (e.g. Bolzonella et al. 2000), we found that there is no gain, or even that we obtain poorer results for some objects, when we consider . The photometric data points of each object were corrected for interstellar extinction using the values of provided by the maps of Schlegel, Finkbeiner & Davis (1998), which are based on IRAS 100 m data555http://irsa.ipac.caltech.edu/applications/DUST/.
2.2 Sample selection
Broad-line AGNs (BLAGN hereafter) and QSOs are powerful emitters over the entire electromagnetic spectrum. They show significant spectral features in the form of intense emission lines (with EW ranging from several tens to several thousands of Å) in the rest-frame UV, optical, and NIR regime. These properties make QSOs easily detectable out to very high redshifts () and perfect candidates to help improve our understanding of the accretion mechanisms within SMBHs (). They also probe the distribution of large-scale structures and the physical conditions of the intergalactic medium (IGM). The strong features that characterize the QSO optical emission spectrum allow us to test the ALHAMBRA photometry and its ability to produce very low resolution spectra. This would provide a correct spectral classification and a high-precision redshift estimate for the expected population of several thousands of QSOs.
We selected our initial QSO candidates from a subsample of the current ALHAMBRA catalog (v3), which was created using the following photometric criteria:
-
•
A survey quality flag . Each ALHAMBRA source was flagged with a parameter (“percent–weight” in the catalog) that takes into account the total exposure time of a given source relative to the maximum for a given field. A low value of this flag () indicates that the source is either within a region strongly affected by the dithering process during the observation, contains bad pixels/artifacts, or is located near a bright (masked) source. A detailed comparison with the deeper photometry data available for some fields from other surveys shows that source detections with percent–weight are highly reliable and that a negligible fraction of them are spurious.
-
•
The source must be within the very high confidence magnitude interval of the survey. The chosen magnitude of reference is A678M filter centered on 6789 and the interval is defined by . The bright magnitude cut ensures that no source saturates any filter, while the faint cut avoids sources with photometric errors larger than 0.2 magnitudes.
We decided against the inclusion of a stellarity criteria, as the precision of the one derived by the SExtractor (Bertin & Arnouts 1996) package was valid only for the brighter part of the QSO sample ().
| Name | FWHM | AB | Offset | |||
|---|---|---|---|---|---|---|
| (m) | (m) | corr. | (AB) | |||
| (1) | (2) | (3) | (4) | (5) | (6) | (7) |
| A366M | 0.3661 | 0.0279 | 0.96 | -0.033 | 21.81 | 0.08 |
| A394M | 0.3941 | 0.0330 | 0.02 | -0.210 | 21.60 | 0.05 |
| A425M | 0.4249 | 0.0342 | -0.13 | -0.081 | 21.65 | 0.05 |
| A457M | 0.4575 | 0.0332 | -0.18 | -0.011 | 21.62 | 0.07 |
| A491M | 0.4913 | 0.0356 | -0.05 | -0.065 | 21.54 | 0.06 |
| A522M | 0.5224 | 0.0326 | -0.04 | -0.054 | 21.48 | 0.06 |
| A551M | 0.5510 | 0.0297 | 0.01 | 0.003 | 21.48 | 0.07 |
| A581M | 0.5809 | 0.0324 | 0.07 | -0.001 | 21.39 | 0.05 |
| A613M | 0.6134 | 0.0320 | 0.13 | 0.009 | 21.35 | 0.06 |
| A646M | 0.6461 | 0.0357 | 0.23 | 0.006 | 21.33 | 0.08 |
| A678M | 0.6781 | 0.0314 | 0.24 | -0.046 | 21.20 | 0.06 |
| A708M | 0.7078 | 0.0332 | 0.29 | -0.055 | 21.14 | 0.05 |
| A739M | 0.7392 | 0.0304 | 0.34 | 0.007 | 21.16 | 0.06 |
| A770M | 0.7699 | 0.0354 | 0.39 | 0.000 | 21.11 | 0.06 |
| A802M | 0.8020 | 0.0312 | 0.44 | 0.002 | 21.06 | 0.07 |
| A829M | 0.8294 | 0.0296 | 0.48 | 0.007 | 21.00 | 0.08 |
| A861M | 0.8614 | 0.0369 | 0.54 | -0.023 | 20.91 | 0.05 |
| A892M | 0.8918 | 0.0303 | 0.50 | 0.022 | 20.93 | 0.08 |
| A921M | 0.9208 | 0.0308 | 0.48 | 0.028 | 20.83 | 0.10 |
| A948M | 0.9482 | 0.0319 | 0.52 | 0.077 | 20.65 | 0.15 |
| 1.2094 | 0.2471 | 0.87 | 0.104 | 20.65 | 0.06 | |
| 1.6482 | 0.2665 | 1.38 | 0.186 | 20.41 | 0.08 | |
| 2.1409 | 0.3040 | 1.83 | 0.155 | 20.20 | 0.09 |
Columns: (1) Filter name; (2) Filter mean wavelength; (3) Filter FWHM; (4) AB–Vega magnitude correction: = AB_correction; (5) Offsets applied to each filter as =offset during the photometric redshift determination (see Sect. 3.3 for details); (6) Mean magnitude in each filter band for the spectroscopic sample (Sect. 2.3); (7) Mean magnitude errors in each filter band for the spectroscopic sample.
2.3 Spectroscopic data
To assess the quality and accuracy of the photo- determination for the ALHAMBRA database, we compiled all the published or publicly available spectroscopic information for BLAGNs/QSOs. The online services and public spectroscopic catalogs included the Sloan Digital Sky Survey (SDSS777http://www.sdss.org/) DR7 (Schneider et al. 2010), the Deep Extragalactic Evolutionary Probe (DEEP/DEEP2888http://deep.ucolick.org; Davis et al. 2003), the All-wavelength Extended Groth strip International Survey (AEGIS999http://aegis.ucolick.org/; Davis et al. 2007), the COSMOS101010http://cosmos.astro.caltech.edu/ XMM source catalog (Brusa et al. 2010), the GOODS-North redshift compilation by Barger et al. (2008), the SWIRE111111http://swire.ipac.caltech.edu/swire/swire.html spectroscopic catalog by Rowan-Robinson et al. (2008) and the 13th edition of the Veron-Cetty & Veron QSOs catalog (2010; VERONCAT121212http://heasarc.gsfc.nasa.gov/W3Browse/all/veroncat.html hereafter). We verified the quality of the identifications according to the following criteria: ) All spectra from the DR7 SDSS catalog were visually inspected to determine whether they contained broad-line emission; ) spectra with a high-quality classification flag (flag3) were selected from the DEEP/DEEP2 and the AEGIS database and visually inspected to confirm that they displayed broad-line emission; ) as neither a spectral classification nor a redshift quality were given by Barger et al. in the GOODS-N field, valid BLAGN/QSO candidates were selected based on their hard X–ray luminosity ([2–8 kev]) being brighter that erg s-1; ) in the COSMOS field, we selected the high-quality public spectra of BLAGN (flags131313flags 18 and 218 refer to a spectroscopic redshift computed with a single line 13, 14, 18, 213, 214, 218; Lilly et al. 2007), while we considered as bona fide BLAGN/QSO the remaining of XMM sources without public data reported by Brusa et al. (2010) as ’bl’ based on MMT and IMACS spectroscopy; ) all SWIRE sources have high quality spectra (I. Pérez–Fournón priv. comm.; and ) all the sources from the VERONCAT were considered as bone fide BLAGN/QSOs. No lower redshift or absolute magnitude cutoff was included in the source selection as our goal is to test the efficiency of our method and photometry as good redshift estimators not only for the most powerful BLAGNs and QSOs but also for the low redshift Seyfert 1 nuclei, which may provide an important contribution to the total light of their host galaxies. In all cases, the match between the ALHAMBRA photometry and the spectroscopic catalogs was performed using a one arcsec search radius and always identified a unique counterpart. The sources of the BLAGN/QSO spectroscopic redshifts for each of the ALHAMBRA fields are:
-
•
ALH-2: This 0.5 deg2 field partially overlaps the deep strip of SDSS whose DR7 version provides redshifts for 23 QSOs. The common region of this area with field–4 of the DEEP/DEEP2 survey yields 7 additional sources from their data product release 3 (DR3141414http://deep.berkeley.edu/DR3/dr3.primer.html) of the DEEP2 spectroscopic catalog. Of the 30 spectroscopic redshifts for BLAGN/QSO available in the field, 29 (6 from DEEP2 and 23 from SDSS) comply with our photometric criteria.
-
•
ALH-3: This consists of a 0.25 deg2 field area which partially overlaps with that of the SDSS. The matching between ALHAMBRA and SDSS DR7 spectroscopy yields 2 QSO redshifts, for which both sources verify our photometric criteria.
-
•
ALH-4: This is a 0.25 deg2 field included in the COSMOS survey area. The common area contains a total of 81 BLAGN/QSO redshifts of which 77 (7 from SDSS and 70 from COSMOS) comply with our photometric criteria.
-
•
ALH-5: This field covers a 0.25 deg2 area overlapping that of the GOODS–N. There are a total of 18 BLAGN/QSOs with spectroscopic redshifts (9 from SDSS, 6 from Barger et al. 2008, and 3 from the VERONCAT). Of these, 15 (7 from SDSS, 6 from GOODS–N, and 2 from the VERONCAT) comply with our photometric criteria.
-
•
ALH-6: This 0.19 deg2 field is centered on the GROTH strip and therefore overlaps with the DEEP2, AEGIS, and SDSS surveys. In total, there are 35 spectroscopically identified BLAGN/QSO in this field, of which 33 sources (6 SDSS, 6 DEEP2 and 21 AEGIS) comply with our photometric criteria.
-
•
ALH-7: A deg-2 field centered on the ELAIS-N1 of the SWIRE survey. Sources with spectroscopic redshifts and classifications are provided by the catalog of Rowan-Robinson et al. (2008), the SDSS spectroscopy and the VERONCAT. All 11 BLAGN/QSO found in this field (1 from SDSS, 8 from SWIRE, and 2 from VERONCAT) comply with our photometric criteria.
-
•
ALHAMBRA-8: The 3 QSO spectroscopic identifications in this deg2 field are provided exclusively by the QSO DR7 catalog of the SDSS. All 3 sources comply with our photometric criteria.
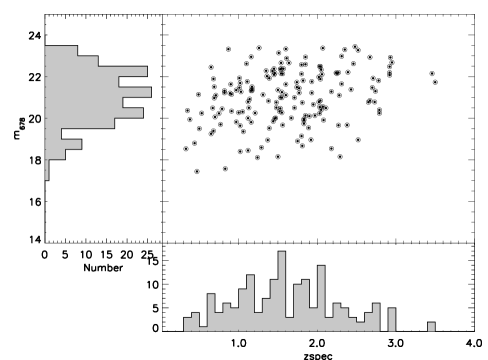
The final spectroscopic catalog of the ALHAMBRA fields includes 94% (170/180) of the total numbers of sources spectroscopically identified in the different fields. The ALH4-COSMOS field contains 44% of the sources, followed by the ALH2 and ALH6 fields (DEEP2/AEGIS) which corresponds to 17% and 19% of the IDs, respectively. Table 1 details the number of identified sources in each field, while Figure 2 shows the redshift distribution of the selected spectroscopic sample.
Although the surveys from which the spectroscopic sample is extracted encompass a wide range of selection criteria (color selection in the SDSS, optical flux-limited in zCOSMOS_bright, X–ray selected for IMACS and MMT spectroscopy, etc), we find their redshift distribution compatible within the errors. The mean redshift and 1 dispersion for the sources extracted from the different spectroscopic catalogs are: 1.610.63 (SDSS), 1.990.68 (zCOSMOS_faint), 1.920.64 (zCOSMOS_bright), 1.240.45 (MMT), 1.550.66 (IMACS), 1.810.81 (GOODS-N), 1.560.88 (DEEP2), 1.560.63 (AEGIS), 1.420.69 (SWIRE), and 1.240.78 (VeronCat).
| Index | SED Name | Class | ||||||||||||||||||||||||||||||||||||||||
|---|---|---|---|---|---|---|---|---|---|---|---|---|---|---|---|---|---|---|---|---|---|---|---|---|---|---|---|---|---|---|---|---|---|---|---|---|---|---|---|---|---|---|
| 1 | Ell2 | Elliptical (5 Gyr old) $a$$a$footnotetext: 2 | Ell5 | Elliptical (2 Gyr old) $a$$a$footnotetext: 3 | Ell13 | Elliptical (13 Gyr old) $a$$a$footnotetext: 4 | Arp220 | Starburst $a$$a$footnotetext: 5 | M82 | ” $a$$a$footnotetext: 6 | IRAS 20551–4250 | ” $a$$a$footnotetext: 7 | IRAS 22491–1808 | ” $a$$a$footnotetext: 8 | NGC 6240 | ” $a$$a$footnotetext: 9 | S0 | S0 $a$$a$footnotetext: 10 | Sa | Sa $a$$a$footnotetext: 11 | Sb | Sb $a$$a$footnotetext: 12 | Sc | Sc $a$$a$footnotetext: 13 | Sdm | Sdm $a$$a$footnotetext: 14 | Sd | Sd $a$$a$footnotetext: 15 | Spi4 | Spiral $a$$a$footnotetext: 16 | Sey18 | Seyfert 1.8 $a$$a$footnotetext: 17 | Sey2 | Seyfert 2 $a$$a$footnotetext: 18 | IRAS 19254-7245 | Seyfert 2 $a$$a$footnotetext: 19 | QSO2 | QSO 2 $a$$a$footnotetext: 20 | hyb1_gal10_agn90 | Hybrid 10% S0 + 90% QS02 $b$$b$footnotetext: 21 | hyb1_gal20_agn80 | … |
| 22 | hyb1_gal30_agn70 | … | ||||||||||||||||||||||||||||||||||||||||
| 23 | hyb1_gal40_agn60 | … | ||||||||||||||||||||||||||||||||||||||||
| 24 | hyb1_gal50_agn50 | … | ||||||||||||||||||||||||||||||||||||||||
| 25 | hyb1_gal60_agn40 | … | ||||||||||||||||||||||||||||||||||||||||
| 26 | hyb1_gal70_agn30 | … | ||||||||||||||||||||||||||||||||||||||||
| 27 | hyb1_gal80_agn20 | … | ||||||||||||||||||||||||||||||||||||||||
| 28 | hyb1_gal90_agn10 | Hybrid 90% S0 + 10% QS02 | ||||||||||||||||||||||||||||||||||||||||
| 29 | hyb2_gal10_agn90 | Hybryd 10% I22491 + 90% TQSO1 $b$$b$footnotetext: 30 | hyb2_gal20_agn80 | … | ||||||||||||||||||||||||||||||||||||||
| 31 | hyb2_gal30_agn70 | … | ||||||||||||||||||||||||||||||||||||||||
| 32 | hyb2_gal40_agn60 | … | ||||||||||||||||||||||||||||||||||||||||
| 33 | hyb2_gal50_agn50 | … | ||||||||||||||||||||||||||||||||||||||||
| 34 | hyb2_gal60_agn40 | … | ||||||||||||||||||||||||||||||||||||||||
| 35 | hyb2_gal70_agn30 | … | ||||||||||||||||||||||||||||||||||||||||
| 36 | hyb2_gal80_agn20 | … | ||||||||||||||||||||||||||||||||||||||||
| 37 | hyb2_gal90_agn10 | Hybryd 90% I22491 + 10% TQSO1 | ||||||||||||||||||||||||||||||||||||||||
| 38 | QSOL | QSO (low-luminosity) $b$$b$footnotetext: 39 | QSOH | QSO (high-luminosity) $b$$b$footnotetext: 40 | TQSO1 | QSO composite $a$$a$footnotetext: 41 | QSO1 | ” $a$$a$footnotetext: 42 | syth_qso–0.25 | QSO synthetic$c$$c$footnotetext: 43 | syth_qso–0.50 | ” | ||||||||||||||||||||||||||||||
| 44 | syth_qso–0.75 | “ | ||||||||||||||||||||||||||||||||||||||||
| 45 | syth_qso–1.00 | ” | ||||||||||||||||||||||||||||||||||||||||
| 46 | syth_qso–1.25 | “ | ||||||||||||||||||||||||||||||||||||||||
| 47 | QSO_Cristiani | QSO $d$$d$footnotetext: 48 | QSO_VVDS | QSO composite $e$$e$footnotetext: 49 | QSO_vandenBerk | QSO composite $f$$f$footnotetext: 50 | Mrk231 | BALQSO $a$$a$footnotetext: |

3 QSO photo- determination
We used the publicly available template fitting code LePhare161616http://www.oamp.fr/people/arnouts/LE_PHARE.html (Arnouts et al. 1999, Ilbert et al. 2006) to estimate redshifts for our selected QSOs. The code matches the photometric data of each ALHAMBRA QSO source to a library of available templates providing the best-fit, spectral classification, and photometric redshift by means of a minimization process. The minimization process accepts the inclusion of user-supplied priors, different extinction laws, and the possibility to apply systematic offsets to the different photometric bands in order to achieve the best match between the colors of the sample and those provided by the template library. The full capabilities and possibilities of the LePhare minimization code was extensively discussed by Ilbert et al. (2006, 2009). Our final selection of templates, adopted reddening laws, priors, and systematic offsets are discussed in the following sections.
3.1 Template selection
The list of extragalactic templates used in this work are detailed in Table 15 and Figure 3. The selection includes SEDs for QSOs, Seyferts, starburst, normal galaxies, and stars. To include low luminosity BLAGN that are partially or completely dominated by their host galaxy light, we adopted the hybrid templates (consisting of a mixture of QSO and host galaxy SEDs) introduced by Salvato et al. (2009). The variety of templates is justified by the need to test the ability of the ALHAMBRA survey to differentiate broad-line AGN emission from that of other extragalactic sources or stars, and enable us to do a blind search for these sources (Matute et al., in preparation).
In Tab. 15 and Fig. 3, the templates are organized as:
-
•
Non–active and starburst galaxies: This includes 3 elliptical templates of different ages (2, 5, and 13 Gyr; #1–3), the starburst galaxies Arp 220, M 82, NGC 6240, IRAS 20551, and IRAS 22491171717May contain an AGN responsible for 20% of the bolometric flux (e.g. Veilleux et al. 2009) (#4–8) and 7 spirals (S0 through Sd; #9–15). They are all part of the SED library published by Polletta et al. (2007).
-
•
Obscured BLAGN: Includes the Polletta et al. (2007) composite templates of a Seyfert 1.8 and a Seyfert 2 and the Seyfert–2 IRAS 19254 (#16–18). The high-luminosity obscured sources are represented by a type–2 QSO (QSO2) and the BALQSO Mrk 231 templates (Polletta et al. 2007; #19 & #50). We also added the hybrid template library of Salvato et al. (2009) defined by 9 different combinations of a S0 and a QSO2 template (#20–28).
-
•
QSO and hybrid–QSO templates: Here we considered both the high and low luminosity SDSS composites (indices #38, #39), two templates from Polletta et al. (2007; QSO1 and TQSO1 with indices #40 and #41), the Cristiani & Vio QSO SED (#47), the VVDS mean QSO SED (Gavignaud et al. 2006; #48), and the mean QSO from Vanden Berk et al. (2001; #49) also based on SDSS data. Hybrid templates include 9 different combinations of the starburst/ULIRG IRAS 22491 template and a QSO1 template (Salvato et al. 2009; #29–#37). As the quality and accuracy of the fit improved in several cases, we completed the list with a set of 5 synthetic QSO templates (#42–46), covering continuum slopes () from to (in steps of 0.25) below 1 m and fixed at above 1 m (LePhare template database and references therein).
Finally, the stellar template database includes 131 spectra from the Pickels (1998) stellar library plus 4 spectra of white dwarfs from Bohlin, Colina & Finlay (1995) and 19 additional templates from the LePhare stellar library. Stellar templates were also included because white dwarfs and F/G stars QSOs have similar colors to F/G stars in the =[2–3] redshift interval. Thus, our final database contains 204 templates (50 extragalactic + 154 stellar). During the minimization process, Galactic and extragalactic templates were used separately.
3.2 Extinction
The photometry for several of the sources analyzed in this work defines a continuum that strongly deviates from single or even double power-laws, most probably because of dust obscuration. For many of these types of sources, there is an ongoing debate about whether (some of) these red QSOs are obscured by either dust or an intrinsically red continuum (Richards et al. 2003; Young, Elvis & Risaliti 2008). Thus, our multiband template fit takes into account the possibility of intrinsic dust obscuration within the source. We adopted the Small Magellanic Cloud (SMC) extinction law (Prevot et al. 1994), which has been shown to reproduce the observed reddening for mildly obscured QSOs at , for which there are no indications of the Galactic feature at 2175Å (Hopkins et al. 2004; Richards et al. 2003, York et al. 2006). Gallerani et al. (2010) appeared to measure some deviation from the SMC extinction law for higher redshift sources which is one reason for adopting alternative extinction laws (see below). The attenuation due to dust () is given as a function of the color excess as . We assumed and a color excess in the range [0,1].
Furthermore, as our spectroscopic sample includes lower redshift Seyfert 1 nuclei, which may have a strong host-galaxy contribution, we considered alternative extinction laws as the dust present in different galaxy types follow extinction curves that deviate from that of the SMC. These deviations include variations of the steepness in the attenuation curve as in the starburst extinction law derived by Calzetti et al. (2000), or the presence of a broad bump around 2175Å as found for the Milky Way (MW; Seaton et al. 1979; Cardelli et al. 1989) or the Large Magellanic Cloud (LMC; Fitzpatrick 1986). Therefore, to reproduce normal galaxy and starburst spectra we also considered in the minimization solutions based on the LMC, MW, Calzetti’s law, and Calzetti’s law plus the absorption feature around 2175 Å. In this case, the minimization process takes into account all possible SEDs and extinction laws simultaneously, choosing the best suited to each source. These additional extinction laws allow us to probe their relevance to the accuracy of the results.
The light attenuation by the inter-galactic medium (IGM) was taken into account internally by LePhare following the opacity curves, binned into redshift intervals of , published by Madau (1995).
3.3 Systematic offsets
Photometric redshifts depend strongly on the precision of the photometry and the capabilities of the template database to reproduce the colors of the source population as a function of . If we were to assume that the selected template database is representative of our source population, then for a given filter the average deviation between the observed flux and the best-fit predicted flux should be zero for normally distributed uncertainties. If this is not the case, a zero-point offset must be applied to the photometry derived from the template database when there is a non-zero average deviation between the observed and predicted fluxes. The ALHAMBRA photometric calibration is based on a selection of NGSL stars following the methodology discussed in Aparicio–Villegas et al. Aparicio–Villegas et al. (2010). We note here that we have not modified this criteria. The computed offsets instead, ”adapt“ the templates to provide a better fit the observed photometry. Therefore, alternative templates or object selection can (and will) lead to different offsets (e.g. Table 1 by Ilbert et al. 2006).
We used the spectroscopic sample described in Sect, 2 and the colors in the filters A457M, A646M, and A829M to compute these systematic offsets using an iterative approach of find the best-fit SED for each source, deriving the mean deviations for each filter, applying offsets, re-computing best-fit SEDs, etc. The iteration process was halted when the variation in between iterations drops below 2%. In general, the procedure did not require more than 4 iterations to converge. We found that the offsets to be applied are small and agree with the typical photometric error for each band in the sample. Table 2 reports the values of these corrections as well as the typical photometric error for each band in columns 5 and 7, respectively.
3.4 Priors
The introduction of important a priori information into the redshift probability distribution function (Pdz) based on Bayesian probability can in many cases improve the quality of the solutions by favoring a particular redshift based on known redshifts and/or color distributions (e.g. Benítez 2000). Our analysis only makes use of a particular luminosity and redshift range prior and does not include any redshift distribution or color information of known BLAGN/QSO populations. We restricted the permitted absolute magnitudes in the A457M () filter between -17 and -28. Absolute magnitudes in this filter are consistent with the commonly used broad-band standard filter . This includes not only the typical range where most BLAGN/QSOs are found () but also the range for host-dominated BLAGN and normal galaxies (Salvato et al. 2009; Polletta et al. 2007; Rowan-Robinson et al. 2008).
3.5 Photo- determination summary
We used the code LePhare to estimate photometric redshifts for 170 spectroscopically identified BLAGN and QSOs with high quality ALHAMBRA photometry. For the minimization process, we considered the following:
-
•
A database of 204 templates: 154 stellar and 50 extragalactic.
-
•
Several extinction laws: MW, LMC, SMC, and Calzetti’s starburst laws with a color-excess range of =[0.0,1.0].
-
•
Given our template library, we made a correction to the zero-point of the filters that show a non-zero average deviation between the observed and best-fit predicted magnitudes.
-
•
A simple luminosity prior of -17-28.
-
•
A redshift space interval of binned in redshifts intervals of z=0.04.
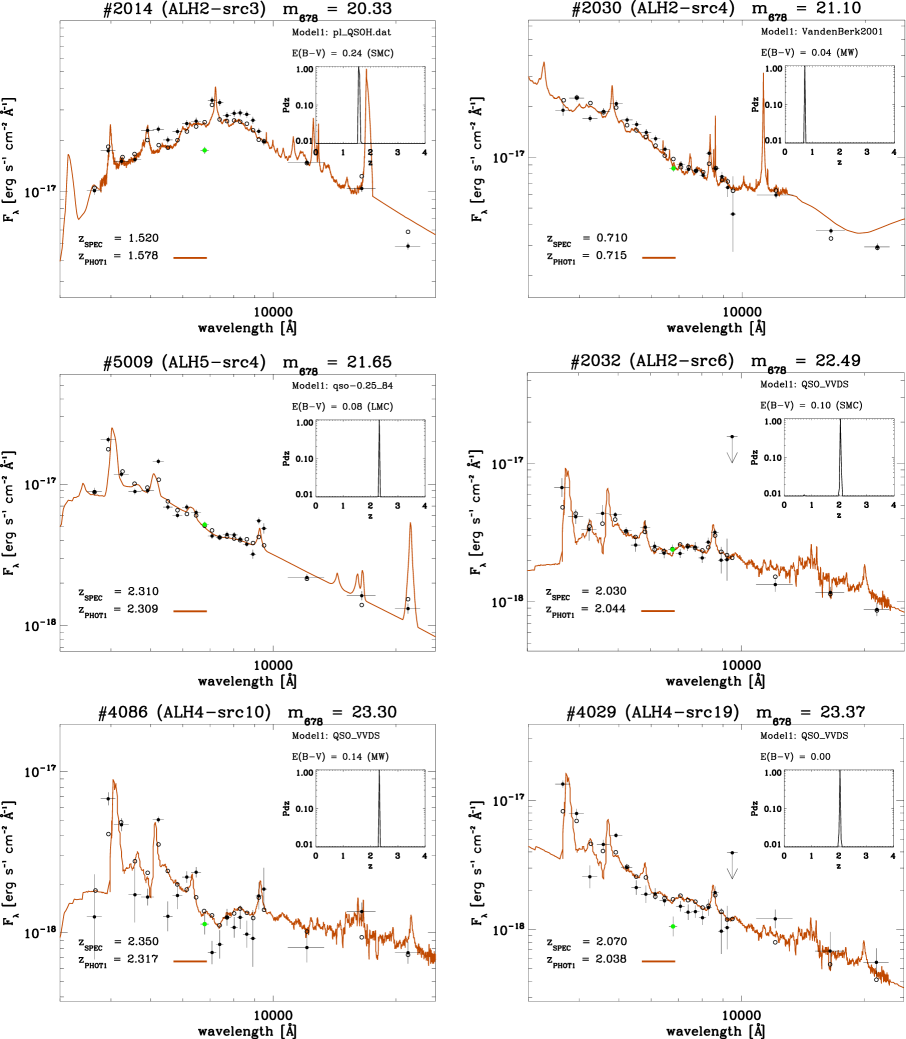
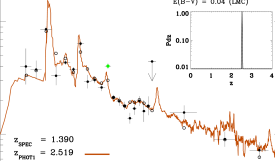
Figure 4 shows an example of the excellent agreement between the data and the fitted template for 6 sources with a wide range of magnitudes (), redshifts (), and intrinsic extinctions ( ).
4 Results and discussion
4.1 Photo- accuracy
The efficiency of the photo- determination is quantified by comparing the spectroscopic redshifts (hereafter spectro-) of 170 sources in our BLAGN/QSO sample. Photometric redshifts are generally characterized by both their accuracy and outlier fraction. The accuracy is defined as the standard deviation of , denoted , where , while the outlier fraction () is defined as the fraction of sources with catastrophic solutions (i.e. solutions that are inconsistent with the measured spectro-). In our analysis, we assumed that a source is an outlier if . This value was selected a priori to be compatible with the cutoff of similar studies (e.g. Luo et al. 2010, Salvato et al. 2009, Ilbert et al. 2009, Rowan-Robinson et al. 2008). An alternative accuracy estimate that has been used by several authors (e.g. Ilbert et al. 2006, Brammer et al. 2008) is the normalized median absolute deviation (NMAD) defined as
.
This parameter can be directly compared to the standard deviation of in the case of normal distributions and has the advantage of being less sensitive to outliers. From now on, we use as our estimate of the photo- accuracy.
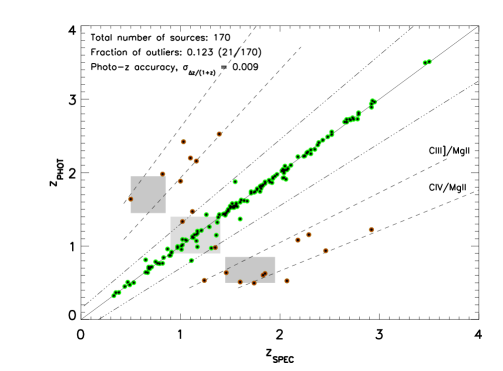
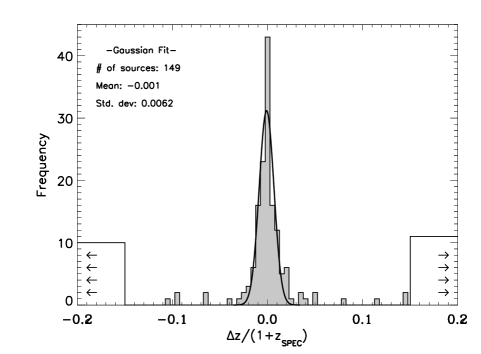
We now discuss our results based on the number of extinction laws considered in the computation, namely either a single (SMC) extinction law (SEL hereafter) or multiple (SMC, LMC, Milky–Way, and Calzetti) extinction laws (MEL hereafter). Table 4 describes the solutions found for the two sets of extinction laws considered. In the case of a SMC extinction law, we obtained an accuracy of with a fraction of outliers of % (21 out of 170 sources). A comparison between the derived photo- and the spectro- is shown in the top panel of Fig. 5. The narrow scatter present for the good fits (green dots) is highlighted by the distribution of the source redshift accuracy that lies in the range (i.e. no outlier region) and shown in Fig. 6. This distribution is well-represented by a Gaussian with no measurable bias (centered at ) and a of 0.006. Identical results were found when we considered several extinction laws during the minimization process (, %) but, as we see in the following paragraphs, the MEL approach is able to more accurately reproduce the SED distribution of the BLAGN/QSO population.
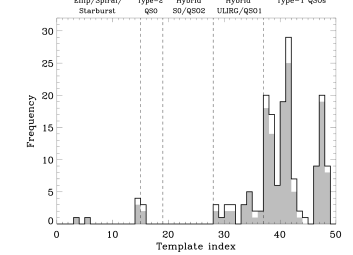
Besides the ability to provide precise photo-’s, our analysis allows us to recover the correct SED for most of the sources. Figure 7 presents the distribution of the templates for the MEL best-fit solutions. We did not find sources with stellar templates that have best-fit solutions (i.e. ) and the majority of the sources are best-fitted by pure type-1 QSO templates or QSO hybrid templates (ULIRG/QSO1 template indices #29 and above; Sect. 3.1). When we did not take into account the outlier fraction of the sources, we found that 95.3% of them (142/149) have either a QSO or hybrid–QSO best-fit template, 1.3% (2/149) are fitted by a QSO2 or hybrid-QSO2 template, and 3.4% (5/149) are fitted with a normal or starburst template. Five sources have best-fit solution templates compatible with a non-active SED. A closer look at the ALHAMBRA photometry, the best fit solution, and the observed spectra (when available) revealed that: One source might be incorrectly classified as BLAGN since both the spectra and the ALHAMBRA photometry point to an early-type galaxy; one source belongs to the fainter part of the population () and the associated errors () have diluted any possible BLAGN signature in the ALHAMBRA photometry; the other 3 sources have optical spectra compatible with galaxy templates with different degrees of starforming and post-starforming activities, i.e. no signs of broad emission and a continuum with a well-defined 4000 Å break, but with ALHAMBRA photometry showing some degree of AGN activity (blue continuum and indications of faint, typical BLAGN line-emission namely of Mg II , C III] or C IV at the spectroscopic redshift of the source). The incorrect solutions found for these 3 sources are probably a consequence of the uncertainties expected from the method, particularly regarding the chosen template database and the absence of any variability correction of the photometry. As a test of the degeneracy introduced by the chosen template database, we considered an alternative database of only QSOs and hybrid QSO/ULIRG templates (see indices #29–39 in Table 2.3 and Fig. 3) for the 5 sources with a normal galaxy or starburst best-fit solution. We found that: ) for 2 sources we were unable to recover in this case the photo-, casting some doubts on the spectral classification of the sources or an incomplete template database; ) a correct photo- was found for the other 3 sources where hybrid templates with a weaker BLAGN component (10–20%) were selected by the best-fit solution. This last case highlights the degeneracy introduced by the selected template database for certain host and BLAGN luminosity regimes. For this small fraction of sources (2%; 3/149), the incorrect spectral classification, using the method described here, will be taken into account in any statistical analysis of the BLAGN/QSO population detected in the ALHAMBRA fields to be presented in a forthcoming paper (Matute et al., in preparation).
Furthermore, we note that the photo- determination described here is able to recover the redshift of the sources in the interval , which has been traditionally biased against the selection of QSOs because of their similar colors to F/G stars. Hence, the photometry and the method described here could provide an efficient way of both classifing and deriving a reliable photometric redshifts for BLAGN/QSO candidates pre-selected, for example, by their X–ray flux. The catalog and derived luminosity functions for BLAGN/QSO selected purely based on the ALHAMBRA photometry will be presented in a companion paper (Matute et al. in preparation).
The dependence of our results on redshift, apparent magnitude of the source, and the systematic offsets applied during the photo- computation are described in the following sections. These dependences are similar in the two sets of extinction laws unless otherwise specified.
| Medium-bands + JHKS | Medium-bands | |||||||
|---|---|---|---|---|---|---|---|---|
| SEL$a$$a$footnotetext: | MEL$b$$b$footnotetext: | SEL$a$$a$footnotetext: | MEL$b$$b$footnotetext: | |||||
| No offsets | Offsets | No offsets | Offsets | No offsets | Offsets | No offsets | Offsets | |
| (1) | (2) | (3) | (4) | (5) | (6) | (7) | (8) | |
| 0.010 | 0.009 | 0.011 | 0.009 | 0.013 | 0.013 | 0.014 | 0.011 | |
| 15.9 | 12.3 | 14.1 | 12.3 | 16.4 | 15.3 | 19.4 | 15.3 | |
| Extincted fraction $c$$c$footnotetext: | 46.9 | 61.7 | 61.6 | 79.0 | 45.8 | 55.6 | 71.0 | 81.3 |
| $d$$d$footnotetext: | 0.045 | 0.058 | 0.085 | 0.092 | 0.037 | 0.049 | 0.063 | 0.085 |
| QSO1–Hybrid fraction$e$$e$footnotetext: | 92.3 | 92.6 | 95.2 | 95.3 | 92.2 | 91.7 | 94.9 | 95.1 |
4.1.1 Dependence on redshift
The accuracy of the photo- results is rather independent of the redshift with the exception of the interval =[0.9,1.4] (light–grey square in Fig. 5a for the SMC results). The presence of only one prominent line (Mg II ) in this interval introduces some aliasing that depends on the intensity of the line and how well is sampled by the ALHAMBRA filters. This small degradation of the solution occurs when the peak of the Mg II line falls within two ALHAMBRA filters. The distribution of the outlier fraction of the sources (Fig. 5, red dots) follows a bimodal behaviour around 1.4. Below this redshift ( 1.4), the minimization process tends to overestimate the photo- solutions, while it underestimates them at higher redshifts ( 1.4). This effect can be explained by the QSO color/redshift degeneracy (i.e. the degree of similarity between the colors at different redshifts; e.g. Richards et al. 2001) and a line misidentification (Croom et al. 2004). These degeneracies, still present in the ALHAMBRA data but to a much lesser extent than for broadband photometry, are highlighted as grey shaded areas and dot–dashed lines in Fig. 5 for the color–color and line misidentification degeneracies. Further details of the origin of these degeneracies are given in Sect. 4.3 where we explore the nature of the outlier fraction of sources.
4.1.2 Dependency with apparent magnitude
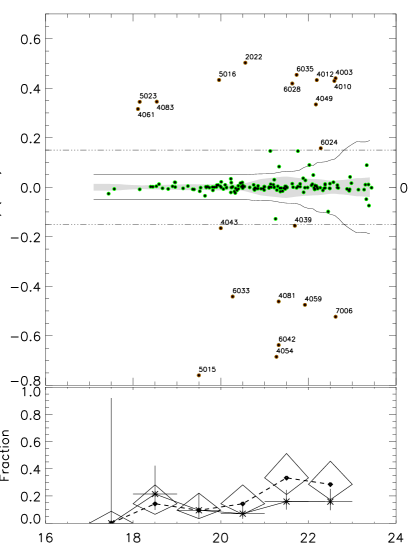
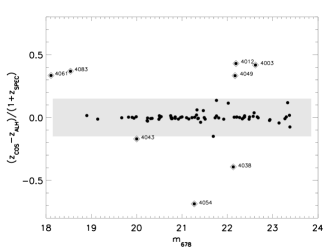
As highlighted in the central panel of Fig. 5, we do not find any dependence of the accuracy on the apparent magnitude of the source but only a clear degradation of the solutions is found at fainter magnitudes () caused by the slightly noisier photometry ( at as indicated by the continuous line in the central panel of Fig. 5). On the other hand, the outlier fraction shows a moderate correlation with apparent magnitude (bottom panel of Fig. 5), where 62% of the outliers have . Nevertheless, although some outliers might be produced by noisier photometry, other factors might also contribute to the catastrophic failures (see Sect. 4.3).
4.1.3 Dependence on photometric offsets
Table 4 reports the improvement in the fit achieved by including the photometric offsets derived from the ALHAMBRA photometry and the template dataset. Although the accuracy is only marginally higher, we found that the greatest benefit is the reduction in the numbers of outliers (from 16% to 12%). The same behaviour has been previously observed by other authors (e.g. Ilbert et al. 2009).
4.2 Extinction distribution
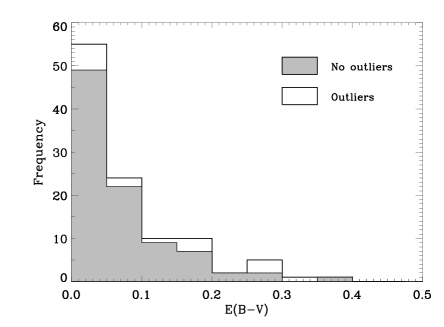
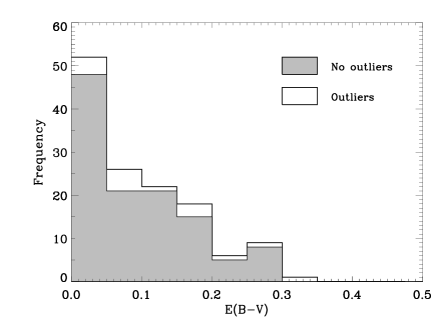
The distribution of the color excess required by the best-fit solutions is shown in Fig. 8. Considering only the SMC extinction law (Fig. 8, left), we found that (92 out of 149) of the non-outlier sources require some dust extinction in their best-fit solution. The mean extinction of the sample is , with the majority of these sources (53%) having a color excess compatible with the mean Galactic value along the line of sight (). Only 5 sources require extinctions in the range . The solutions obtained using the MEL approach required a slightly larger fraction of extincted sources (79%) with a mean color excess of . A significant fraction of sources (41%) with small extinctions () was also found in this case. We note here that, since several templates in our database are already extincted, the derived values of should only be considered as lower limits when these template are chosen by the best-fit solution.
The presence of dust-extincted QSOs is no surprise as the SDSS survey has established the existence of a non-negligible fraction of QSOs with spectral indices () redder than with extinctions as high as (Gregg et al. 2002; Richards et al. 2003). The extinction values found in this work for BLAGN/QSO are in good agreement with the extinction interval derived by Richards et al. (2003; =[0.07–0.135]) in order to reproduce the spectral indices of red QSOs using templates of QSOs with normal colors from the SDSS. A detailed analysis of the selection effects introduced by intrinsic dust extinction will be carried out for the future catalog release of QSOs detected by the ALHAMBRA survey (Matute et al., in preparation).
4.3 Nature of the outliers
To fully characterize the photo- estimate for the ALHAMBRA QSOs, it is fundamental to understand the reasons for an incorrect photo- determination. In the following, we describe the photometry and nature of the 12% of the sources (21/170) with inaccurate photo- determinations in an attempt to infer the reasons for the incorrect solutions. The outlier best-fit templates (Fig. 7, open fraction of the histogram), extinction values (Fig. 8, open fraction of the histogram), and redshift distribution (upper panel, Fig. 5) are similar to those of the remaining population. The most probable reasons for the catastrophic failures are enumerated in the following paragraphs. We only discuss the MEL fit approach as it offers the best results, but similar conclusions can be drawn from the SEL approach.
1) The less precise photometry of fainter sources. The apparent dependence of the outlier fraction on magnitude has already been discussed in Sect. 4.1.2. This dependence is almost expected as the larger photometric errors of these fainter objects (continuous line in the central panel of Fig. 5) broadens the Pd distribution, increasing the number of peaks and directly influencing the photo- results. Nevertheless, only 2 outliers (10% of all the outliers; Fig. 5 #’s 4049 & 6024) have large enough photometric uncertainties () that can explain their incorrect photo- solution.
2) Emission-line misclassification. Eight outlier solutions (38% of all the outliers; Fig. 5 #’s 2022, 4010, 4061, 5015, 5023, 5016, 6028 and 6035) misclassify either a single or pair of emission lines depending on the redshift of the source and on how intense and well-sampled the lines are by the ALHAMBRA photometry (see Sect. 4.1.1). The expected source distribution for single line misclassifications (confusion of the C III] and C IV lines with Mg II and viceversa) is outlined in the top panel of Fig. 5 by the dashed lines. The emission-line pairs Mg II – H and C III] – Mg II can be confused in the redshift intervals z[0.6–0.9] and z[1.5–1.9] owing to the limited resolution of the ALHAMBRA spectra (i.e. the ability to resolve the line given its intensity and position with respect to the ALHAMBRA filters). This latter source of confusion is highlighted as the dark grey areas in the top panel of Fig 5. For 6 out of the 8 sources, we found secondary solutions in agreement with the spectro-. For these sources, additional a priori information would be needed in order to favor one solution over another. A simple a posteriori condition that weights the solution at each redshift (Pdz), given the source magnitude, was derived from known luminosity functions of optically selected QSOs. We found that this approach does not always reduce the fraction of outliers in our sample while, if applied to the whole ALHAMBRA survey, may introduce a bias.
3) The possibility of an incorrectly assigned spectro-. The ALHAMBRA photometry and the solutions found for 3 sources (14% of all the outliers; Fig. 5 source #’s 4059, 4081 and 7006) seem to indicate that an incorrect spectroscopic redshift has been assigned. An example of one of these sources is shown in Fig. 9, where the ALHAMBRA low-resolution spectra show a well-defined power-law continuum with signs of two or more intense emission-lines that do not correspond to the assigned spectro-. A low S/N spectra and/or limited wavelength coverage are typical causes of an incorrect assignment of spectroscopic redshifts (Fernández–Soto et al. 2001). Two out of three sources are located in the COSMOS field. These sources spectro- come from VIMOS/VLT observations (Brusa et al. 2010) that are not included in the public release of the zCOSMOS database. Some degeneracy in the spectro- is expected given the limited wavelength range covered by the VLT/VIMOS observations of . This means that just a single broad emission-line will be visible in certain redshift intervals (e.g. confusion may arise between Mg II at and CIII at ), as seems the case for these 3 outliers. Although further confirmation of their true redshifts is required, these sources prove how precise photo- can complement spectro- making them an invaluable tool in modern observational cosmology.
| GALAXIES | |||||||||
| Survey | 4148 | 30 (12) | UV–IRAC | LePhare | 31 | 0.007 | (0.15) | (1) | |
| GOODS-N/HDF-N | 130 | 7(–) | BPZ | 6 | 0.06 | 1.0 | (3, 4) | ||
| MUSYC (all) | 2551 | 32 (18) | Opt–8.0 m | EAY | semi-analytical | 0.010 | 5.0 (0.10) | (6) | |
| SWIRE (all) | 5982 | 6–10 (–) | 0.36-4.5 m | ImpZ-2 | 9 | 0.035 | 1.0 (0.15) | (7) | |
| COMBO-17 | 813 | 17 (12) | 0.35–0.93 m | – | PEGASE lib. | 0.07 | 2.0 (0.15) | (8) | |
| NDWFS–Boötes | 14448 | 13 (–) | UV-Opt-NIR-MIR | min. | 4 LRTg | 0.041 | 5.0 | (10) | |
| Lockman Hole | 209 | 21 (–) | FUV-Opt-NIR | LePhare | 31 | 0.034 | 10.0 (0.15) | (11) | |
| AGN | |||||||||
| XMM-COSMOSf | 236 | 30 (12) | UV–IRAC | Le Phare | 30/31 | 0.013 | 7.2 (0.15) | (2) | |
| C-COSMOSf | 236 | 30 (12) | UV–IRAC | Le Phare | 30 | 0.011 | 5.1 (0.15) | (2) | |
| MUSYC (X–ray) | 236 | 32 (18) | Opt–8.0 m | EAY | 1g | 0.012 | 12.0 (0.12) | (6) | |
| CDF-S | 446 | 35 (18) | UV–8.0 m | ZEBRA | 265 | 0.01–0.06 | 1.4–8.1 (0.15) | (5) | |
| SWIRE (QSO) | 158 | 6–10 (–) | 0.36-4.5 m | ImpZ-2 | 9 | 0.093 | 33.0 (0.10) | (7) | |
| COMBO-17 (QSO) | 52 | 17 (12) | 0.35–0.93 m | – | 1 | 0.007 | 17.3 (0.10) | (8,9) | |
| NDWFS–Boötes | 5347 | 13 (–) | UV-Opt-NIR-MIR | min. | 4 LRTg | 0.05–0.18 | 5.0 | (10) | |
| Lockman Hole | 90 | 21 (–) | FUV-Opt-NIR | LePhare | 30 | 0.069 | 18.9 (0.15) | (11) | |
| ALHAMBRA | 170 | 23 (20) | Opt–NIR | h | LePhare | 50 | 0.009 | 12.3 (0.15) | (12) |
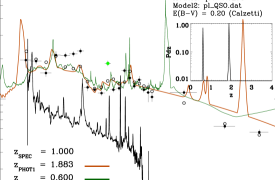
4) Intrinsic variability. Seven sources (33% of all the outliers; Fig. 5 #’s 4003, 4012, 4039, 4043, 4054, 6033 and 6042) have unusual ALHAMBRA SEDs that are incompatible with the template database, indicating that variability is probably playing an important role. None of the sources display signs of either blending or a close companion that might contaminate their photometry. Figure 10 shows one of these sources and illustrates the disagreement in the continuum and emission features between the ALHAMBRA photometry and the observed spectra. An estimate of the intensity of the variability can be obtained from the 5 sources within the COSMOS field using the catalog published by Salvato et al. (2011). All 5 sources display flux variability of and in some cases as large as . The importance of the variability correction for the photo- computation of BLAGN and QSOs has been reported in the past by several authors (Wolf et al. 2004, Salvato et al. 2009). Unfortunately, owing to the observing strategy of ALHAMBRA, it is impossible to set the photometry to a common epoch.
For only one source (#4083) does its incorrect photo- solutions seem unclear as it has a fairly bright () power-law spectrum with low variability ( from Salvato et al. 2011).
In summary, we found that 10% of the outliers can be explained by their less precise photometry, 38% are caused by emission-line misclassification, 14% shown clear evidence of an incorrectly assigned spectro-, and the remaining 33% have significant intrinsic variability.
4.4 Performance comparison with other surveys
Our results are compared to those already published in the literature in other cosmological fields. Table 4.3 summarizes the main characteristics of the photo- accuracy for several relevant cosmological surveys, including the wavelength range covered, number of photometric bands used, number of sources in the spectroscopic sample used to calibrate the photo-, the depth of the photometry, the photometric code used, the number of templates, the final precision in terms of the accuracy (), and the fraction of outliers (). The table has been divided into one section for the galaxy and one for the AGN results. This highlights the accuracy differences between the two populations, as well as the significantly larger (by factors of ) spectroscopic samples available to the former because AGN represent only % of the extragalactic population. We note here that the table highlights simply the differences in the wavelength coverage and filter type used by each survey. The reader must be aware of the caveats in this comparison, namely the different depths, source populations, methodology, spectroscopic sample used, and the computation of the accuracy estimates.
The benefit of a continuous optical coverage with medium–band photometry is clearly illustrated in Tab. 4.3, where we compare broadband surveys such as SWIRE and HDF-N with medium–band surveys like MUSYC, COMBO-17, and ALHAMBRA itself. The precision of the results are particularly higher for the BLAGN population, where the accuracy increases by a factor of 10 and the fraction of outliers decreases by a factor of 3 or more.
A more interesting comparison is that between ALHAMBRA and the surveys that include a certain number of medium optical filters and different wavelength coverages. Since the ALHAMBRA survey is a natural successor to the COMBO-17 survey (Wolf et al. 2003), it is mandatory to compare the performance of its photometric system with that of COMBO-17 in the E-CDFS field. We found that, for BLAGN/QSO, ALHAMBRA is only marginally worse than the latest recalibration of the COMBO-17 data (Wolf et al. 2008) in terms of accuracy (0.009 vs. 0.007). On the other hand, it has a smaller fraction of outliers (12.3% vs. 17.3%). The narrower medium–band passbands of COMBO-17 (FWHM of 200 Å vs. 300 Å) may be held responsible for the slight accuracy advantage, but also introduce a highly redshift-dependent selection function owing to the non-continuous optical coverage of the filters, as in the case of ALHAMBRA. This continuous, non-overlapping coverage of the optical by the ALHAMBRA filters, together with the addition of NIR broadband photometry, has helped to reduce the number of catastrophic failures. Furthermore, our results are obtained without applying the variability correction made to COMBO-17 data.
As part of the Multiwavelength Survey by Yale–Chile (MUSYC; Gawiser et al. 2006), photo- estimates results were published by Cardamone et al. (2010) in the E-CDFS using the deeper, more extensive, broad-band photometry and also including photometry from 18 medium-band filters taken with the Subaru telescope. The performance comparison between the ALHAMBRA and MUSYC X–ray (AGN-dominated) population yields identical values. This result is unsurprising given that the definition of the MUSYC medium–band photometric system is very similar to that of ALHAMBRA, i.e. continuous, non-overlapping medium–band filters. Nevertheless, we note that, given the nature of the E-CDFS observations, the results obtained by MUSYC extend to much fainter optical magnitudes (). Photometric redshifts estimates are also available in this field for the sources detected by the Chandra 2 Ms exposure in the 436 arcmin2 CDF-S (Luo et al. 2010). Although the highest accuracy and outlier fraction found by the authors is as low as 0.01 and 1.4% respectively, they also found that the strong dependence of this result on the spectroscopic sample, used to correct their SED library, could increase the dispersion and outlier fraction of the result to and %. A larger dispersion would be expected as their analysis also extends to a much fainter population () as a result of the depth of the Chandra observations ( erg cm-2 s-1 in the 0.5–2.0 keV band). The Luo et al. results have been included under the AGN section of Table 4.3, although given the depth of the CHANDRA observations, an important fraction of sources is expected to be dominated by intrinsically faint AGN, starbursts, or even normal galaxies.
The COSMOS survey (Scoville et al. 2007) provides the largest number of BLAGN/QSOs of our ALHAMBRA sample thanks to its extensive spectroscopic follow-up (Lilly et al. 2007; Brusa et al. 2010 and references therein). This spectroscopic follow-up, coupled with the vast multiwavelength information available in the field, has allowed the computation of precise photometric redshift for galaxies and AGN (Ilbert et al. 2009; Salvato et al. 2011). Our photo- determination and that of COSMOS share a similar methodology, the use of the same photometric code (LePhare) as well as several templates in the dataset. A direct comparison is therefore possible between their findings and our results for the BLAGN/QSO population (the QSOV sample in Salvato et al. 2011), allowing us to further quantify the ALHAMBRA results through: ) the comparison of the photometric system of both surveys, i.e. a COSMOS 30 filter–set with a significant number of broad-band filters, including NUV/GALEX and mid-IR/IRAC photometry but also 12 medium-band filters and 2 narrow-band filters, against the 23 ALHAMBRA filter–set dominated by optical medium passbands but with no info in the NUV or mid-IR; ) the impact of the variability correction applied to the COSMOS data.
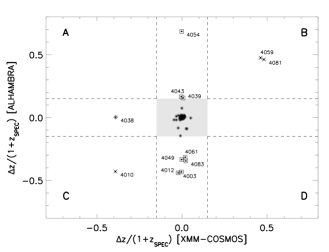
We found in general good agreement between our photo- and the fraction of BLAGN/QSOs published by Salvato et al. (2011) located within the ALHAMBRA field (77 sources in 12.5% of the COSMOS area). The results of this comparison are presented in Fig. 11. The left panel shows the overall agreement between both surveys, with 90% of the sources (69/77) lying within over the entire magnitude range of the sample. However, this comparison does not establish whether or when any of the two photometric estimates provide an accurate photo-. This information is given in the right panel of Fig. 11, where we compare the accuracy found by COSMOS and ALHAMBRA source by source. The threshold limits for outliers () are represented by vertical and horizontal dashed lines for the COSMOS and ALHAMBRA, respectively. The central grey square contains the sources for which the two surveys photo- estimates agree with the measured spectro- (84%; 65/77). For 8 of the 12 sources in disagreement, COSMOS provides a more accurate solution (squares in Fig. 11), while 1 source has a more reliable estimate in ALHAMBRA (diamond). Of the 8 sources with more accurate COSMOS solutions, 5 need a strong variability correction according to Salvato et al. (2009; see Sect.4.3), which may explain our wrong estimates, 2 sources have the line misclassification uncertainty described in Sect. 4.3 (#4061 and #4083) and another one has large photometric uncertainties in ALHAMBRA (#4049). Finally, in both surveys, 3 sources have photo- estimates that inconsistent with their spectro- (quadrants B and C in Fig. 11). We note that these photo- estimates are very similar for 3 of the sources (# 4059, 4081 and 4010) and that the redshifts of these sources are based on a single line spectrum. For two of them, there seems to be an incorrect measurement of the spectro- (see Sect. 4.3). For the third source, the photo- solution is degenerate, showing two peaks of similar intensity in the Pd distribution, and the method selects the incorrect photo-.
To summarize, we observe that the accuracy of the ALHAMBRA photometric redshift determination for the BLAGN/QSO population is, as expected, much better than any broad–band survey and similar to any recent photometric survey including medium passband filters. This result is obtained without the advantage of the larger wavelength coverages of other surveys and thanks to the ALHAMBRA filter selection in the optical and NIR. The fraction of outliers is comparable to or better than other cosmological surveys that include no variability correction. The importance of the variability correction for BLAGN/QSOs (Wolf et al. 2004; Salvato et al. 2009) is highlighted by our larger outlier fraction (by a factor of 2) compared to a survey such as COSMOS, whose observation strategy allowed all its photometry to be set to a common epoch.
4.5 The impact of the NIR photometry
The need for NIR photometry in order to increase the accuracy of photo- and reduce the number of catastrophic failures for normal and starburst galaxies has been demonstrated by several authors (Connolly et al. 1997; Fernández-Soto et al. 1999; Rowan-Robinson et al. 2003; Ilbert et al. 2006). The subsequent improvement (with an increase in accuracy and a reduction in the outlier fraction by factors of 2-3; Ilbert et al. 2006) is caused by these photometric bands providing a tighter constraint of photo- solutions as they sample the peak emission of the old stellar population (m rest-frame) in the [0,1] redshift range. At redshifts above , the peak stellar emission moves out the wavelength range covered by the JHKS filters and longer wavelength photometry (e.g. Spitzer/IRAC) is required to sample this emission. In the case of the AGN population, Salvato et al. (2009, 2011) illustrated that, when only broad-band imaging is available, sufficiently high photo- precision and an outlier fraction suitable to scientific analysis can only be obtained with the addition of NIR photometry.
We investigated here the importance of NIR photometry to the photo- solutions of BLAGN and QSOs when medium-band photometry is available in the optical. To do so, we proceeded as described in Sect. 3 without using the , , and broadband filters. The results of the analysis are summarized in Table 4 (columns #5 to #8) for the SEL and MEL solutions. We found that the impact of the NIR photometry is negligible in terms of accuracy (with a marginal decrease of 0.2–0.3%) but does have influence on the fraction of outliers, which increases by 3-5% depending on the set of extinction laws considered during the fit. The larger outlier fraction is dominated by sources with degenerate solutions (showing two or more peaks in the Pd distribution) that can be constrained by the NIR photometry. On the other hand, the distribution of the SEDs and the required extinction is also very similar to the solution with and without photometry. This result is important to unveiling and characterizing the BLAGN population of future very large ALHAMBRA-like optical photometric surveys such as the JPAS202020http://j-pas.org/ survey or to planning medium-band optical photometric follow-ups to characterize the population of the all-sky X–ray survey to be carried out by the future eROSITA212121http://www.mpe.mpg.de/erosita/ mission (Cappellutti et al. 2011), as detailed below.
We conclude that, although the use of NIR photometry helps us to alleviate the fraction of outliers, its importance for BLAGN/QSO photo- determination (in the redshift range) is significantly smaller than for the normal and starburst population when a continuous coverage of the optical with medium-band photometry is available. Nevertheless, the importance of photometry obviously increases with redshift and in particular at , where the limited number of optical detections due to the continuum depression bluewards of Ly make the NIR bands necessary to constrain the continuum slope of BLAGN/QSOs and their photo- solutions.
4.5.1 A practical case
In the future, several surveys will provide large samples of BLAGN and QSOs. One of these surveys is to be carried out by the eROSITA mission. eROSITA will map all the sky more than one order of magnitude deeper in X–ray flux ( erg cm-2 s-1) than the previous ROSAT All Sky Survey. The deep part of the survey will cover 200 deg2 down to a flux of erg cm-2 s-1. In total, the eROSITA mission is expected to discover more than 106 new AGN including large fractions of BLAGN and QSOs given the survey flux limits. To aid the follow-up of the AGN population uncovered by eROSITA and, in order to obtain reasonable photo- solutions ( and ), Salvato et al. (2011) discussed the need for at least JHK photometry when only 4–5 broad bands are available in the optical, such as those provided by the very wide-field surveys LSST222222http://www.lsst.org/ and Pan–STARSS232323http://pan-starss.ifa.hawaii.edu.
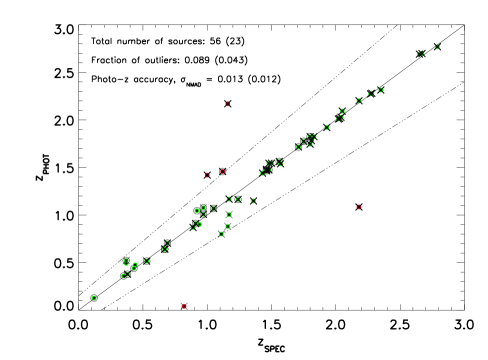
Assuming an ALHAMBRA-like survey covering the entire sky, we can estimate the number of BLAGN/QSOs that could be photometrically identified in eROSITA following the methodology described here. For this purpose, the XMM–COSMOS field serves as a benchmark of the accuracy achievable with such an approach by cutting the XMM-COSMOS X–ray catalog (Brusa et al. 2010) to the fluxes to be reached by the eROSITA all-sky and deep surveys as well as the final magnitude cutoff of the ALHAMBRA photometry (). This X–ray selection yields a total of 65 (56 with spectro-) sources within the ALHAMBRA-COSMOS region for the deep selection and 24 (23 with spectro-) for the shallow all–sky selection. Photo- solutions were computed for these sources using the ALHAMBRA photometry and the results are presented in Fig. 12. The photo- accuracies obtained (, for eROSITA-deep; , for eROSITA-shallow) are significantly higher than those for broad-band photometry and similar to the results discussed in Sect. 4. The spectroscopic sample is dominated by BLAGN/QSOs (82%, 46 out of 56) for which the ALHAMBRA photometry is able to recover a correct BLAGN/QSO classification (templates from #29 to #49 in Fig. 3) for (36/46) and (17/19) of the deep and shallow samples, respectively. The extrapolation of this efficiency from the ALH-4/COSMOS area (0.25 deg2) to the eROSITA deep (200 deg2) and all-sky extragalactic (20000 deg2) surveys show that an ALHAMBRA-like photometric survey can select and provide high accuracy photo- solutions for more than and BLAGNs, respectively.
Unfortunately, the telescope time that would be required to carry out a survey such ALHAMBRA, even in the smaller deep regions of eROSITA, is too long for any publicly available observatory, i.e. the time to execute an ALHAMBRA-like survey in 200 deg2 will be 10 times longer than that of ALHAMBRA itself, roughly 40 years. On the other hand, a dedicated telescope facility optimized for large-area photometric surveys would do the job in a fraction of the time. This is the case of the planned Javalambre PAU (Physics of the Accelerating Universe) Astrophysical Survey (JPAS, Benítez et al. 2009). This photometric survey, will be carried out at the Javalambre observatory with a 2.5m telescope and a 5 deg2 FOV camera, and will sample 8000 deg2 of the northern sky over four years, starting in late 2013. The JPAS survey will take the photo- precision to the next level with an expected accuracy of thanks to its 54 narrow-band optical filters (FWHM100Å). The classification and photo- estimates of BLAGN and QSOs will be significantly higher in the common region covered by JPAS and eROSITA with respect to ALHAMBRA. This is due to the narrower JPAS filter set and its ability to correct for variability. On the basis of the above ALHAMBRA/eROSITA results, we expect JPAS to select and provide very accurate photo- for at least BLAGN/QSOs in the JPAS/eROSITA common area.
5 Conclusions and future work
We have explored the ability of the ALHAMBRA survey photometry to assign very accurate photometric redshifts to a population of BLAGNs and QSOs. We have achieved a precision better than 1% using a catalog of 170 spectroscopically identified BLAGN/QSO in the ALHAMBRA fields. This precision is similar to the previously published photo- accuracy for BLAGN/QSOs in surveys that make use of medium-band optical photometry. This has been possible despite the limited wavelength coverage of ALHAMBRA relative to other surveys and thanks to its photometric system definition (consisting in 20 continuous, non-overlapping optical medium-band filters plus the 3 NIR broadbands , , and ).
We have used the publicly available code LePhare to derive our photo- solutions by means of fitting our photometry to a template database of normal and starburst galaxies, type-1/2 Seyfert, QSOs, and stars. Our treatment has included a correction for systematic offsets between the different photometric bands and the template database, Galactic extinction, absorption by IGM, and the possibility of intrinsic reddening by adopting various extinction laws. In addition to the excellent accuracy of out photo-, our analysis has demonstrated that:
-
1.
The medium-band filter set used by the ALHAMBRA photometry is able to detect the emission and absorption features that characterize QSO optical spectra in the redshift interval .
-
2.
We have been able to easily differentiate QSO emission from stellar emission over the entire QSO redshift range from 0 to 3.
-
3.
In the redshift interval and , we have characterized the nature of 87.7% of the sources providing a correct SED type and robust photo-. The fraction of outliers (12.3%) shows a clear correlation with magnitude with 70% of the outliers being located at .
-
4.
The most probable reasons for our fraction of outliers are: ) the faintness or poor photometric quality of some sources, ) line misclassification, ) the intrinsic variability of the AGN population (for which the ALHAMBRA photometry applied no correction), and ) the possibility of an incorrect spectro- assignment owing to the limited wavelength coverage of the spectra of some objects.
-
5.
Near-IR photometry is not fundamental to constrain the photo- solutions of BLAGN and QSOs, at least in the redshift interval , if the optical regime is covered by a continuous medium-band filter set such as that of ALHAMBRA. This result is relevant to the design of future optical follow-ups of surveys with a large fraction of BLAGN, as in the case of either X–ray or radio surveys.
We therefore conclude that the analysis performed here validates the feasibility and accuracy of the photo- determination for a large number of sources with the ALHAMBRA limited (but well-defined) set of filters. In the particular case of BLAGN and QSOs, our methodology and results suggest the potential ability of the ALHAMBRA photometry to detect these sources and build a large and unbiased BLAGN/QSO database. The publication of such a catalog as well as the precise estimate of its inherent incompleteness necessary to derive meaningful statistical properties (e.g. number counts and luminosity functions) are left to a forthcoming paper.
Acknowledgements.
The authors will like to thank Mara Salvato for her helpful advice and for providing templates, solution details, and variability corrections for the photo- determination of XMM-Newton sources in the COSMOS field. This work has made use of the TOPCAT tool (Taylor 2005). We thank Cécile Cartozo for the careful reading of this manuscript and an anonymous referee for constructive comments and helpful suggestions that improved the quality of this paper. Part of this work was supported by Junta de Andalucía, through grant TIC-114 and the Excellence Project P08-TIC-3531, and by the Spanish Ministry for Science and Innovation through grants AYA2006-1456, AYA2010-15169, AYA2010-22111-C03-02, and AYA2011-29517-C03-01.References
- Aparicio–Villegas et al. (2010) Aparicio–Villegas, T., Alfaro, E. J., Cabrera-Caño, J., et al. 2010, AJ, 139, 1242
- Arnouts et al. (1999) Arnouts, S., Cristiani, S., Moscardini, L. et al. 1999, MNRAS, 310, 540
- Barger et al. (2008) Barger, A. J., Cowie, L. L., & Wang, W. -H. 2008, ApJ, 689, 687
- Benítez et al. (2009) Benítez, N., Moles, M., Aguerri, J. A. L., et al. 2009, ApJ, 692, L5
- Benítez (2000) Benítez, N. 2000, ApJ, 536, 571
- Bertin & Arnouts (1996) Bertin, E., & Arnouts, S. 1996, A&AS, 117, 393
- Bohlin et al. (1995) Bohlin, R. C., Colina, L., & Finlay, D. S. 1995, AJ 110, 1316
- Bolzonella et al. (2000) Bolzonella, M., Miralles, J.-M., Pelló, R. 2000, A&A, 363, 476
- Brammer et al. (2008) Brammer, G. B., van Dokkum, P. G., & Coppi, P. 2008, ApJ, 686, 1503
- Brusa et al. (2010) Brusa, M., Civano, F., Comastri, A., et al. 2010, ApJ, 716, 348
- Bongiorno et al. (2007) Bongiorno, A., Zamorani, G., Gavignaud, I., et al. 2007, A&A, 472, 443
- Calzetti et al. (2000) Calzetti, D., Armus, L., Bohlin, R. C., et al. 2000, ApJ, 533, 682
- Cappelluti et al. (2011) Cappelluti, N., Predehl, P., Böhringer, H., et al. 2011, Memorie della Societa Astronomica Italiana Supplementi, 17, 159
- Cardamone et al. (2010) Cardamone, C. N., van Dokkum, P. G., Urry, C. M., et al. 2010, ApJS, 189, 270
- Cardelli et al. (1989) Cardelli, J. A., Clayton, G. C., & Mathis, J. S. 1989, ApJ, 345, 245
- Cattaneo (2002) Cattaneo, A. 2002, MNRAS, 333, 353
- Connolly et al. (1997) Connolly, A. J., Szalay, A. S., Dickinson, M., Subbarao, M. U., & Brunner, R. J. 1997, ApJL, 486, 11
- Cowie et al. (2009) Cowie, L. L., Barger, A. J., Trouille, L. 2009, ApJ, 692, 1476
- Cowie et al. (1996) Cowie, L. L., Songaila, A., Hu, E. M., & Cohen, J. G. 1996, AJ, 112, 839
- Cristiani & Vio (1990) Cristiani, S., & Vio, R. 1990, A&A, 227, 385
- Cristóbal-Hornillos et al. (2009) Cristóbal-Hornillos, D., Aguerri, J. A. L., Moles, M., et al. 2009, ApJ, 696, 1554
- Croom et al. (2004) Croom, S. M., Smith, R. J., Boyle, B. J., et al. 2004, MNRAS, 349, 1397
- Croton et al. (2006) Croton, D. J., Springel, V., White, S. D. M., et al. 2006, MNRAS, 365, 11
- Davis et al. (2003) Davis, M., Faber, S. M. Newman, J., et al. 2003, SPIE, 4834, 161
- Davis et al. (2007) Davis, M., Guhathakurta, P., Konidaris, N. P., et al. 2007, ApJ, 660, L1
- Di Matteo et al. (2005) Di Matteo, T., Springel, V., & Hernquist, L. 2005, Nature, 433, 604
- Fan et al. (2006) Fan, X., Strauss, M. A., Becker, R. H., et al. 2006, AJ, 132, 117
- Fernández-Soto et al. (1999) Fernández-Soto, A., Lanzetta, K. M., & Yahil, A. 1999, ApJ, 513, 34
- Fernández-Soto et al. (2001) Fernández-Soto, A., Lanzetta, K. M., Chen, H. -W., Pascarelle, S. M., & Yahata, N. 2001, ApJS, 135, 41
- Fitzpatrick (1986) Fitzpatrick, E. L. 1986, AJ, 92, 1068
- Gallerani et al. (2010) Gallerani, S., Maiolino, R., Juarez, Y., et al. 2010, A&A, 523, A85
- Gavignaud et al. (2006) Gavignaud, I., Bongiorno, A., Paltani, S., et al. 2006, A&A, 457, 79
- Gawiser et al. (2006) Gawiser, E., van Dokkum, P. G., Herrera, D., et al. 2006, ApJS, 162, 1
- Gehrels (1986) Gehrels, N. 1986, ApJ, 303, 336
- Giavalisco et al. (2004) Giavalisco, M., Ferguson, H. C., Koekemoer, A. M., et al. 2004, ApJ, 600, 93
- Gregg et al. (2002) Gregg, M. D., Lacy, M., White, R. L., et al. 2002, ApJ, 564, 133
- Hasinger (2008) Hasinger, G. 2008, A&A, 490, 905
- Hildebrandt et al. (2010) Hildebrandt, H., Arnouts, S., Capak, P., et al. 2010, A&A, 523, 31
- Hopkins et al. (2004) Hopkins, P. F., Strauss, M. A., Hall, P. B., et al. 2004, AJ, 128, 1112
- Hopkins et al. (2010) Hopkins, P. F., Croton, D., Bundy, K., et al. 2010, ApJ, 724, 915
- Ilbert et al. (2006) Ilbert, O., Arnouts, S,; McCracken, H. J., et al. 2006, A&A, 457, 841
- Ilbert et al. (2009) Ilbert, O., Capak, P., Salvato, M., et al. 2009, ApJ, 690, 1236
- Jiang et al. (2010) Jiang, L., Fan, X., Brandt, W. N., et al. 2010, Nature, 464, 380
- Kormendy & Richstone (1995) Kormendy, J., & Richstone, D. 1995, ARA&A, 33, 581
- Madau (1995) Madau, P. 1995, ApJ, 441, 18
- Meisenheimer et al. (1998) Meisenheimer, K., et al. 1998, in The Young Universe, eds. D’Odorico, S., Fontana, A., Giallongo, E., ASP Conf. Ser., Vol. 146, p. 134
- Menci et al. (2003) Menci, N., Cavaliere, A. Fontana, A., et al. 2003, ApJ, 587, 63
- Moles et al. (2008) Moles, M., Benítez, N., Aguerri, J. A. L., et al. 2008, AJ, 136, 1325
- Luo et al. (2010) Luo, B., Brandt, W. N., Xue, Y. Q., et al. 2010, ApJS, 187, 560
- Lilly et al. (2007) Lilly, S. J., Le Fèvre, O., Renzini, A., et al. 2007, ApJS, 172, 70
- Pickles (1998) Pickles, A. 1998, PASP, 110, 863
- Prevot et al. (1984) Prevot, M. L., Lequeux, J., Prevot, L., Maurice, E., & Rocca-Volmerange, B. 1984, A&A, 132, 389
- Polletta et al. (2007) Polletta, M., Tajer, M., Maraschi, L., et al. 2007, ApJ, 663, 81
- Richards et al. (2003) Richards, G. T., Hall, P. B., Vanden Berk, D. E., et al. 2003, AJ, 126, 1131
- Richards et al. (2006) Richards, G. T., Lacy, M., Storrie-Lombardi, L. J., et al. 2006, ApJSS, 166, 470
- Rowan-Robinson et al. (2008) Rowan-Robinson, M., Babbedge, T., Oliver, S., et al. 2008, MNRAS, 386, 697
- Rowan-Robinson (2003) Rowan-Robinson, M. 2003, MNRAS, 345, 819
- Salvato et al. (2009) Salvato, M., Hasinger, G., Ilbert, O.e, t al. 2009, ApJ, 690, 1250
- Salvato et al. (2009) Salvato, M., Ilbert, O., Hasinger, G. et al. 2011, arXiv:1108.6061v1
- Schneider et al. (2010) Schneider, D. P., Richards, G. T., Hall, P. B., et al. 2010, AJ, 139, 2360
- Schlegel et al. (1998) Schlegel, D. J., Finkbeiner, D. P., & Davis, M. 1998, ApJ, 500, 525S
- Scoville et al. (2007) Scoville, N. Z., Aussel, H., Brusa, M., et al. 2007, ApJS, 172, 1
- Seaton (1979) Seaton, M. J. 1979, MNRAS, 187, 73
- Taylor (2005) Taylor, M. B. 2005, Astronomical Society of the Pacific Conference Series, Vol. 347, Astronomical Data Analysis Software and Systems XIV, ed. P. Shopbell, M. Britton, & R. Ebert, p. 29
- Tremaine et al. (2002) Tremaine, S., Gebhardt, K., Bender, R., et al. 2002, ApJ, 574, 740
- Vanden Berk et al. (2001) Vanden Berk, D. E., Richards, G. T., Bauer, A., et al. 2001, ApJ, 122, 549
- Veilleux et al. (2009) Veilleux, S., Rupke, D. S. N., Kim, D. -C., et al. 2009, ApJS, 182, 628
- Veron-Cetty & Veron (2010) Veron-Cetty, M. P. & Veron, P. 2010, A&A, 518A, 10
- Wang et al. (2010) Wang, Y. -Y., Wang, L., Xiang, S. -P., et al. 2010, RAA, 10, 199
- Willott et al. (2007) Willott, C. J., Delorme, P., Omont, A., et al. 2007, AJ, 134, 2435
- Willott et al. (2009) Willott, C. J., Delorme, P., Reylé, C., et al. 2009, AJ, 137, 3541
- Wolf et al. (2003) Wolf, C., Wisotzki, L., Borch, A., et al. 2003, A&A, 408, 499
- Wolf et al. (2004) Wolf, C., Meisenheimer, K., Kleinheinrich, M., et al. 2004, A&A, 421, 913
- Wolf et al. (2008) Wolf, C., Hildebrandt, H., Taylor, E. N., et al. 2008, A&A 492, 933
- York et al. (2000) York, D. G., Adelman, J., Anderson, J. E. Jr., et al. 2000, AJ, 120, 1579
- York et al. (2006) York, D. G., Khare, P., Vanden Berk, D., et al. 2006, MNRAS, 367, 945
- Young et al. (2008) Young, M., Elvis, M., & Risaliti, G. 2008, ApJ, 688, 128
- Zheng et al. (2007) Zheng, X. Z., Bell, E. F., Papovich, C., et al. 2007, ApJ, 661, L41