suppression and QCD phase diagram
Abstract
QCD phase diagram is obtained by analysing centrality dependence of suppression in =17.3 Pb+Pb and =200 GeV Au+Au collisions. ’s produced in initial interactions are assumed to dissolve if local temperature exceeds a threshold temperature. The threshold temperature depends on the (local) fluid temperature and baryonic chemical potential, which are obtained, under certain assumptions, from experimentally determined quantities e.g. rapidity density, net baryon density. QCD critical line with curvature parameter is consistent with experimental data. is factor of 3 larger than in lattice QCD calculations.
pacs:
PACS numbers: 25.75.-q, 25.75.DwI introduction
In recent years, there is much interest in QGP phase diagram in plane, the temperature and the baryonic chemical potential Fukushima:2010bq ,Fukushima:2008wg ,Stephanov:2007fk ,Asakawa:1989bq . Presently, only one point in the phase diagram is known from lattice QCD simulations, at 0, the QCD transition is a cross over Aoki:2006we at (pseudo) critical temperature 157 (3)(3) MeV Borsanyi:2011zz . From theoretical considerations, QCD phase transition is expected to be 1st order in baryon dense matter. One then expects a QCD critical end point (CEP), where the transition changes from 1st order to cross-over. To access the QCD phase diagram and CEP, systematic study of nuclear collisions, as a function of collision energy, has been planned at FAIR Senger:2011zz in the energy range =5-40 GeV.
At finite baryon density, Fermion determinant is complex and standard technique of Monte-Carlo importance sampling fails. Several techniques have been suggested to circumvent the problem, (i) reweighting Fodor:2001pe ,Fodor:2004nz , (ii) analytical continuation of imaginary chemical potential de Forcrand:2002ci , D'Elia:2002gd and (iii)Taylor expansion Allton:2003vx ,Gavai:2003mf . These methods has been used to locate the phase boundary in plane. The calculations suggest that the curvature parameter () in the expansion,
| (1) |
is small Philipsen:2008gf . As an example, in Fig.1, QCD phase diagram obtained in the analytical continuation method Fodor:2001pe (the filled circles) and in Taylor expansion Kaczmarek:2011zz of (chiral) are shown. Both the methods gives nearly identical phase diagram for , curvature parameter is small, . At larger , they differ marginally. For comparison, in Fig.1, chemical freeze-out curve Becattini:2005xt ,Cleymans:2006qe , obtained in statistical model analysis of particle ratios are shown (the red line). Curvature of the chemical freeze-out curve is factor of 4 larger than the curvature in the QCD phase diagram. Small curvature of the QCD critical line, compared to the chemical freeze-out is interesting. Experimental signal of critical end point will get diluted as the deconfined medium produced at the critical end point will evolve longer to reach chemical freeze-out. Fluid will have more time to washout any signature of CEP.
In the present letter, we obtain the curvature parameter by analysing experimental data on suppression. Existing data in =17.3 GeV Pb+Pb and =200 GeV Au+Au collisions, constrain the curvature parameter within a narrow range, . It is factor of 3 larger than in the lattice QCD calculations. To our knowledge, this is the first attempt to obtain QCD critical line from experiment data.
II Model for suppression in QGP
In a deconfined medium (QGP), inter-quark (color) potential is screened. The screening increases with temperature and above a certain temperature, the potential is too weak to bind charm and anti-charm quarks into a bound state. Charmonium states are then suppressed. Matsui and Satz Matsui:1986dk , first predicted the phenomena. Over the years, in several experiments, yield in heavy ion collisions has been measured. Measurements at SPS (=17.3 GeV) and RHIC (=200 GeV) energy validate Matsui and Satz’s predictions.
To mimic the onset of deconfining phase transition above a critical energy density and subsequent melting of ’s, QGP motivated threshold model was proposed in Blaizot:2000ev ; Blaizot:1996nq . In the threshold model, suppression is linked with the local transverse density. If the local transverse density, at the point where is formed, exceed a critical or threshold value, ’s are melted. In the present paper, we use a variant of the threshold model, if the local temperature of the fluid, exceed a threshold value , ’s are melted. Approximately 30-40% of observed ’s are from feed-down decay of the higher states, and Satz:2005hx . Higher states, and are expected to melt at temperature , . Lattice QCD calculations indicate that ’s can survive up to Satz:2005hx , higher states survive up to . For sequential melting of charmonium states, if the melting temperatures and are substantially different, survival probability should show at least two step distribution (see for example Fig.4 in Digal:2001bh ). No such two step distribution is seen either in =200 GeV Au+Au or in =17.3 GeV Pb+Pb collisions. Absence of two step structure in survival probability indicate that the melting temperatures of ’s and higher states are not substantially different. In the following we assume direct and feed-down ’s are melted at the common temperature . In a baryon rich medium, melting temperatures depend on the QGP phase diagram through the critical temperature as in Eq.1.

Threshold model require the local temperature () and (baryonic) chemical potential () of the fluid produced in nuclear collisions. We propose to obtain them from experimentally measured quantities, e.g. charged particles rapidity density and net baryon rapidity density . Experimentally measured values of Adler:2004zn and Appelshauser:1998yb ,Bearden:2003hx , in 0-5% =17.3 and 200 GeV collisions, are listed in table.1. The initial entropy density is then determined from the well known relation Hwa:1985xg ,
| (2) |
In Eq.2, is the initial time, for which we have used the canonical value =1.0 fm. We do note that Eq.2 is obtained under the assumption of isentropic, longitudinal expansion. Similarly, initial baryon density is obtained as,
| (3) |
in Eq.2-3 indicate that the entropy density and baryon density in Eqs.2,3 must be understood as spatially averaged over entropy/baryon density. To introduce spatial dependence, we assume, that in an impact parameter collision, initial entropy density and baryon density in the transverse plane is distributed as Kolb:2003dz ,
| (GeV) | (MeV) | (MeV) | ||
| 17.3 (Pb+Pb) | 308 | 75 | 191.5 | 390.2 |
| 200.0 (Au+Au) | 690 | 7 | 242.4 | 23.6 |
| (4) | |||||
| (5) |
and is fixed to reproduce the average entropy density and baryon density , as determined from experimental values. and in Eq.4,5 are the transverse profile of the participant density and binary collision number, obtained in a Glauber model. is the fraction of hard scattering. It is approximately constant in the energy range =17-200 GeV, 0.12.
Local entropy density () and baryon density () can be converted into local temperature and baryonic chemical potential using an equation of state. In Kapusta:2010ke , a parametric form of QGP equation of state was given, which matches with the lattice QCD simulation at zero chemical potential and to the known properties of nuclear matter at zero temperature. Entropy density () and baryon density () in parameterised form are,
| (6) | |||||
| (7) |
, , . In table.1, the average initial temperature and baryonic chemical potential in =17.3GeV Pb+Pb and =200 GeV Au+Au collisions are listed. From SPS to RHIC, chemical potential decreases by a factor of 15. Temperature however is increased by 25%.
To obtain survival probability (), we randomly distribute ’s in the reaction plane and count the number of ’s that survive the threshold condition, . We note that apart from suppression in deconfined matter, ’s are suppressed in cold nuclear matter also (CNM effect). It is important to eliminate the suppression due to CNM effect. If cold nuclear matter effects are accounted for, the survival probability of ’s can be obtained as,
| (8) |
where is the survival probability in cold nuclear matter and is the survival probability in QGP. In =200 GeV d+Au collisions, production is consistent with cold nuclear matter effect quantified in a Glauber model of nuclear absorption with mb Vogt:2005ia . mb Arnaldi:2009ph in =17.3 GeV Pb+Pb collisions.
III Results
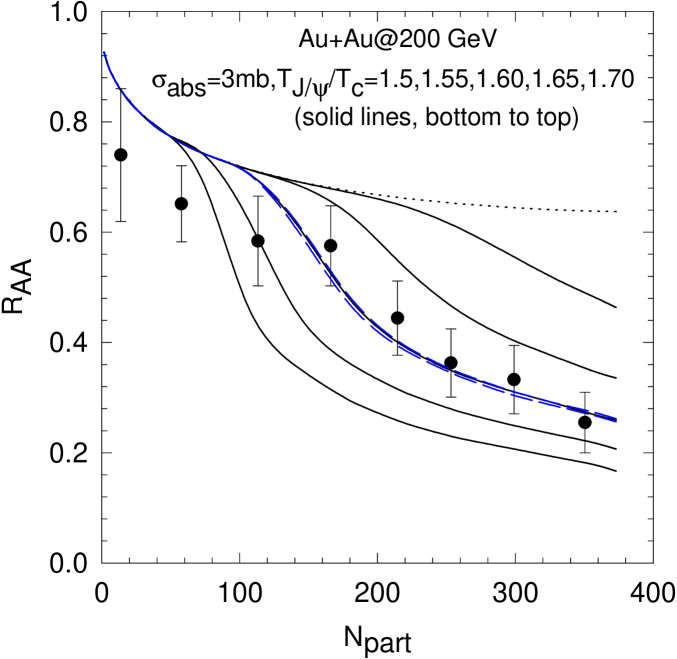
The present model has two parameter, the threshold temperature for melting, and the curvature parameter of the QCD critical line. The critical temperature is fixed to =160 MeV. The free parameters are obtained by fitting experimental data on production in =17.3 GeV Pb+Pb Arnaldi:2009ph and =200 GeV Au+Au Adare:2006ns collisions. In =200 GeV Au+Au collisions, the fluid is essentially baryon free and model predictions do not depend sensitively on the curvature parameter. The dependence on melting temperature however is strong. In Fig.2, for threshold temperature =1.5, 1.55,1.6, 1.65, and 1.7, model predictions are compared with the PHENIX data Adare:2006ns for nuclear modification factor in =200 GeV Au+Au collisions. CNM effect is quantified in Glauber model of nuclear absorption with =3 mb. Experimental data are well explained for the threshold temperature . The melting temperature is consistent with lattice QCD calculation Satz:2005hx . The blue lines in Fig.2 are model predictions with =0.0 and 0.1, . They cannot be distinguished.
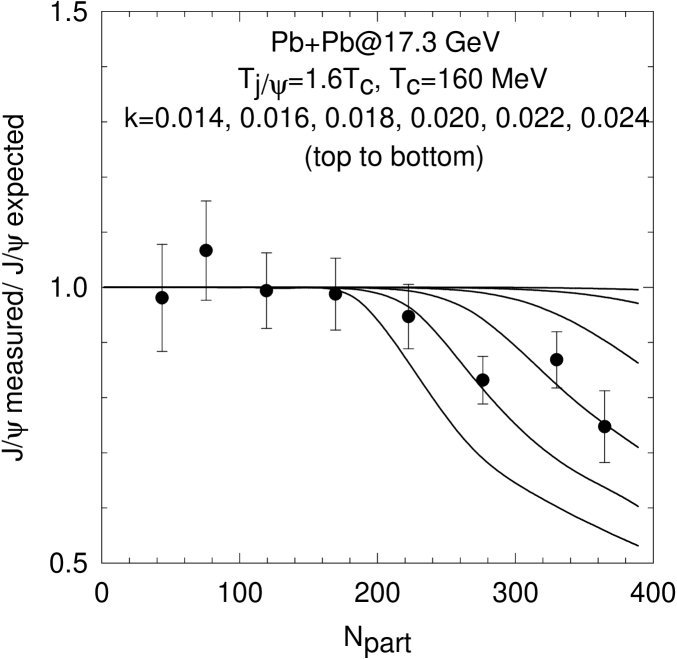
Curvature parameter is constrained when ’s are absorbed in baryon rich plasma. In 158 AGeV Pb+Pb collisions fluid is baryon rich and suppression depend sensitively on the curvature parameter . In Fig.3, centrality dependence of suppression in =17.3 GeV Pb+Pb collisions is shown Arnaldi:2009ph ,Brambilla:2010cs . The data are shown as the ratio of measured ’s over the expected ’s (in a Glauber model of nuclear absorption). Upto =200, the ratio is consistent with unity. Suppression in addition to the CNM effect is required in collisions only. In Fig.3, the solid lines are threshold model predictions with and =0.014, 0.016, 0.018, 0.020, 0.022 and 0.024 respectively. Unlike in =200 GeV Au+Au collisions, in =17.3 GeV Pb+Pb collisions, survival probability shows sensitive dependence on . For , ’s are not suppressed in QGP medium. Best description to the data is obtained with 0.02 (). Description to the data deteriorate for lower or higher curvature. If uncertainty in the melting temperature is accounted for, Pb+Pb data fix the curvature parameter within a narrow range, , for .
In Fig.1, QCD critical line obtained with the curvature parameter is shown (the blue circles with error bars). Curvature , obtained from data is 3 larger than in lattice QCD simulations ). It is also closer to the chemical freeze-out curve. The result is encouraging with respect to detection of QCD critical end point. If QCD critical line is close to the chemical freeze-out, possibility of distortion of signals associated with CEP, e.g. charge fluctuations etc., will be lessened.
Before we summarise the results some limitations of the model are noted. Experimental information of particle density and baryon density is converted to local temperature and baryonic chemical potential using the EOS (see Eq.6,7). The EOS is for massless quarks and gluons, adjusted to reproduce zero chemical potential lattice QCD simulations. How far it represent the real world is uncertain. The model is also a static model. It neglect the possibility that ’s, initially produced in a cold region and survived, at a later time can drift into a hotter region and get melted. Such possibilities, if accounted for would reduce the survival probability. Consequently, the present model give a lower limit of curvature parameter .
IV summary and conclusions
To summarise, we have shown that in a threshold model, suppression is sensitive to the curvature parameter of the QCD phase diagram. In threshold model, suppression depend on the local temperature and chemical potential. A model is proposed to obtain local temperature and chemical potential, from experimentally determined quantities e.g. rapidity density, net baryon rapidity density. QCD critical line with curvature parameter =0.018-0.023 is consistent with experimental centrality dependence of suppression in =17.3 GeV Pb+Pb and =200 GeV Au+Au collisions. =0.018-0.023 is approximately 3 times larger than that obtained in lattice QCD simulations.
References
- (1) K. Fukushima and T. Hatsuda, Rept. Prog. Phys. 74, 014001 (2011) [arXiv:1005.4814 [hep-ph]].
- (2) K. Fukushima, Phys. Rev. D 77, 114028 (2008) [Erratum-ibid. D 78, 039902 (2008)] [arXiv:0803.3318 [hep-ph]].
- (3) M. A. Stephanov, PoS LAT 2006, 024 (2006) [hep-lat/0701002].
- (4) M. Asakawa and K. Yazaki, Nucl. Phys. A 504, 668 (1989).
- (5) Y. Aoki, G. Endrodi, Z. Fodor, S. D. Katz and K. K. Szabo, Nature 443, 675 (2006) [hep-lat/0611014].
- (6) S. Borsanyi, G. Endrodi, Z. Fodor, C. Hoelbling, S. Katz, S. Krieg, C. Ratti and K. Szabo, J. Phys. G G 38, 124101 (2011).
- (7) P. Senger, Nucl. Phys. A 862-863, 139 (2011).
- (8) Z. Fodor and S. D. Katz, JHEP 0203, 014 (2002) [hep-lat/0106002].
- (9) Z. Fodor and S. D. Katz, JHEP 0404, 050 (2004) [hep-lat/0402006].
- (10) P. de Forcrand and O. Philipsen, Nucl. Phys. B 642, 290 (2002) [hep-lat/0205016].
- (11) M. D’Elia and M. -P. Lombardo, Phys. Rev. D 67, 014505 (2003) [hep-lat/0209146].
- (12) C. R. Allton, S. Ejiri, S. J. Hands, O. Kaczmarek, F. Karsch, E. Laermann and C. Schmidt, Phys. Rev. D 68, 014507 (2003) [hep-lat/0305007].
- (13) R. V. Gavai and S. Gupta, Phys. Rev. D 68, 034506 (2003) [hep-lat/0303013].
- (14) O. Philipsen, Prog. Theor. Phys. Suppl. 174, 206 (2008) [arXiv:0808.0672 [hep-ph]].
- (15) O. Kaczmarek, F. Karsch, E. Laermann, C. Miao, S. Mukherjee, P. Petreczky, C. Schmidt and W. Soeldner et al., Phys. Rev. D 83, 014504 (2011) [arXiv:1011.3130 [hep-lat]].
- (16) F. Becattini, J. Manninen and M. Gazdzicki, Phys. Rev. C 73, 044905 (2006) [hep-ph/0511092].
- (17) J. Cleymans, H. Oeschler, K. Redlich and S. Wheaton, J. Phys. G 32, S165 (2006) [arXiv:hep-ph/0607164].
- (18) T. Matsui and H. Satz, Phys. Lett. B 178, 416 (1986).
- (19) J. P. Blaizot, M. Dinh and J. Y. Ollitrault, Phys. Rev. Lett. 85, 4012 (2000) [arXiv:nucl-th/0007020].
- (20) J. P. Blaizot and J. Y. Ollitrault, “J/Psi Suppression In Pb Pb Collisions: A Hint Of Quark-Gluon Plasma Phys. Rev. Lett. 77, 1703 (1996) [arXiv:hep-ph/9606289].
- (21) H. Satz, J. Phys. G 32, R25 (2006) [arXiv:hep-ph/0512217].
- (22) S. S. Adler et al. [PHENIX Collaboration], Phys. Rev. C 71, 034908 (2005) [Erratum-ibid. C 71, 049901 (2005)] [nucl-ex/0409015].
- (23) H. Appelshauser et al. [NA49 Collaboration], Phys. Rev. Lett. 82, 2471 (1999) [arXiv:nucl-ex/9810014].
- (24) I. G. Bearden et al. [BRAHMS Collaboration], Phys. Rev. Lett. 93, 102301 (2004) [arXiv:nucl-ex/0312023].
- (25) R. C. Hwa and K. Kajantie, Phys. Rev. D 32, 1109 (1985).
- (26) P. F. Kolb and U. W. Heinz, In *Hwa, R.C. (ed.) et al.: Quark gluon plasma* 634-714 [nucl-th/0305084].
- (27) J. I. Kapusta, Phys. Rev. C 81, 055201 (2010) [arXiv:1001.3650 [nucl-th]].
- (28) R. Vogt, Acta Phys. Hung. A 25, 97 (2006) [arXiv:nucl-th/0507027].
- (29) R. Arnaldi [NA60 Collaboration], Nucl. Phys. A 830, 345C (2009) [arXiv:0907.5004 [nucl-ex]].
- (30) N. Brambilla et al., Eur. Phys. J. C 71, 1534 (2011) [arXiv:1010.5827 [hep-ph]].
- (31) A. Adare [PHENIX Collaboration], arXiv:nucl-ex/0611020.
- (32) S. Digal, P. Petreczky and H. Satz, arXiv:hep-ph/0110406.