The AGB population of NGC 6822: distribution and the C/M ratio from JHK photometry
Abstract
Context. NGC 6822 is an irregular dwarf galaxy and part of the Local Group. Its close proximity and apparent isolation provide a unique opportunity to study galactic evolution without any obvious strong external influences.
Aims. This paper aims to study the spatial distribution of the asymptotic giant branch (AGB) population and metallicity in NGC 6822.
Methods. Using deep, high quality photometry, taken with WFCAM on UKIRT, carbon- and oxygen-rich AGB stars have been isolated. The ratio between their number, the C/M ratio, has then been used to derive the [Fe/H] abundance across the galaxy.
Results. The tip of the red giant branch is located at mag and the colour separation between carbon- and oxygen-rich AGB stars is at mag (i.e. mag). A C/M ratio of has been derived in the inner kpc of the galaxy, which translates into an iron abundance of [Fe/H] dex. Variations of these parameters were investigated as a function of distance from the galaxy centre and azimuthal angle.
Conclusions. The AGB population of NGC 6822 has been detected out to a radius of kpc giving a diameter of arcmin. It is metal-poor, but there is no obvious gradient in metallicity with either radial distance from the centre or azimuthal angle. The detected spread in the TRGB magnitude is consistent with that of a galaxy surrounded by a halo of old stars. The C/M ratio has the potential to be a very useful tool for the determination of metallicity in resolved galaxies but a better calibration of the C/M vs. [Fe/H] relation and a better understanding of the sensitivities of the C/M ratio to stellar selection criteria is first required.††thanks: Tables. 2, 3 and 4 are only available in electronic form at the CDS via anonymous ftp to cdsarc.u-strasbg.fr (130.79.128.5) or via http://cdsweb.u-strasbg.fr/cgi-bin/qcat?J/A+A/
Key Words.:
techniques: photometric - stars: AGB and post-AGB - stars: carbon - galaxies: irregular - galaxies: dwarf1 Introduction
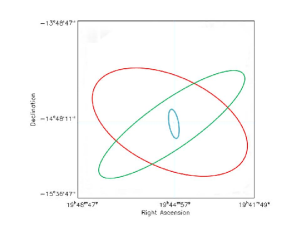
Forming part of the Local Group, NGC 6822 is an irregular dwarf galaxy (dIrr) similar to the Small Magellanic Cloud (SMC). At a distance of kpc, mag, (Mateo, 1998; Lee et al., 1993) it is the closest ‘independent’ dIrr galaxy beyond the Magellanic Clouds. Its close proximity and apparent isolation have made NGC 6822 a popular candidate for studies of galactic evolution, without the strong gravitational influences of other systems (Battinelli et al., 2006). The morphology of the galaxy can be broadly divided into three structural components (Fig.1); firstly, a central bar which contains much of the young stellar population is clearly visible at optical wavelengths and is orientated almost in a north-south direction (Hodge et al., 1991; Karampelas et al., 2009). This bar is embedded in a large envelope of neutral hydrogen oriented in a roughly SE-NW direction. Although this kind of HI structure is not unique in the Local Group – IC 1613 and IC 10 have similar structures (Weldrake et al., 2003; Roberts, 1972) – NGC 6822 is unusual in that the HI envelope is so much more extended than the main optical component. A third, halo-like structure made up of old- and intermediate age stars has been detected by Letarte et al. (2002) and is approximately degree along the major axis. This elongated spheroidal structure is positioned orthogonally to and is dynamically decoupled from the HI envelope (Demers et al., 2006; de Blok & Walter, 2006; Battinelli et al., 2006).
The detection of RR Lyrae stars in NGC 6822 (Baldacci et al., 2004; Clementini et al., 2003) indicates the presence of an old stellar population Gyr old whereas the many HII and OB associations confirm that star formation is still ongoing. NGC 6822 has been the focus of numerous investigations of its stellar content (e.g. de Blok & Walter, 2006; Komiyama et al., 2003; Gallart et al., 1996) and several estimates have been made of its iron abundance. Using optical photometry, Gallart et al. (1996) obtained [Fe/H] dex from the slope of the red giant branch (RGB). Further analysis of the RGB population by Tolstoy et al. (2001) yielded a value of [Fe/H] dex from the strength of CaII absorption lines, in agreement with the result of Davidge (2003) who derived the same [Fe/H] value from the slope of the RGB in the near-infrared (NIR). Studies of the AGB population by Cioni & Habing (2005) and Kang et al. (2006) using the ratio of C- to M-type stars, the C/M ratio, have detected a spread in the metallicity of the population of [Fe/H] dex and [Fe/H] dex (between and dex), respectively. The difference between the two values is attributed to differences in the size and location of the observed area. Clementini et al. (2003) obtained a value of [Fe/H] dex from the average period of old RR Lyrae variables. Looking at the younger stellar population, Venn et al. (2001) derived an average value of [Fe/H] dex from the optical spectroscopy of A-type supergiants. These results suggest, as expected, that the chemical enrichment of the interstellar medium in NGC 6822 has been a continual process due to multiple stellar generations, since star formation began.
Cool AGB stars trace the old- and intermediate-age population in galaxies, and as they are among the brightest objects they are detected well in the NIR, providing a sample that is relatively unobscured by dust along the line of sight. The purpose of this paper is to study the distribution of AGB stars and the metallicity (iron abundance) across the galaxy. During the AGB phase, mixing mechanisms dredge up triple- processed material from the He-burning shell and can cause the dominant metal abundance in the stellar atmosphere to change from oxygen to carbon. Oxygen-rich stars have an excess of oxygen atoms in their atmosphere relative to carbon, which leads to the formation of O-rich molecular species (i.e. TiO, VO, H2O). Carbon-rich stars have a higher abundance of carbon atoms relative to oxygen, leading to the formation of carbonaceous molecules (i.e. C2, CN, SiC). These two types of stars are known as M- (C/O 1) and C-type (C/O 1). Stars in which the number of carbonaceous molecules equals the number of oxygen rich molecules (i.e. C/M ) are S-type stars. At lower metallicities the transformation from an initially O-rich atmosphere to a C-rich one is easier as fewer dredge-up events are required (Iben & Renzini, 1983; Blanco et al., 1978), therefore the ratio between stars of spectral type C and M should provide an indirect measure of the local metallicity at the time those stars formed.
2 Observations and data reduction
Observations were obtained using the Wide Field Camera (WFCAM) on the m United Kingdom Infrared Telescope (UKIRT) in Hawaii during two runs, in April and November , as part of a large project to survey the AGB content of Local Group galaxies in the Northern Hemisphere (PI Irwin). WFCAM comprises four non-contiguous Rockwell-Hawaii-II infrared detector arrays (HgCdTe ) that can be utilised to observe an area of deg2 (a tile) on the sky with a scale of per pixel. A mosaic of four tiles was obtained in three broad-band filters (, and ) covering a contiguous area of deg2 centred on the optical coordinates of NGC 6822 (). We refer the reader to Casali et al. (2001) for a more detailed description of the WFCAM instrument. The exposure time of each tile in the band was sec, from the co-addition of exposures of sec each taken in a dithered pattern of positions. In the and bands the exposure time was sec from the co-addition of single sec exposures, in a micro-stepping following a dithered pattern of positions. The total exposure time per pixel over the two runs was then sec in and sec in and .
Reduction of the data, including all the standard steps for instrumental signature removal –flat fielding, crosstalk, sky-correction and systematic noise– was completed using the WFCAM pipeline at the Institute of Astronomy in Cambridge. Sources extracted using the pipeline were given a morphological classification from which assorted quality control measures are computed. Astrometric and photometric calibrations were performed based on the 2MASS point source catalogue (Hodgkin et al., 2009; Irwin et al., 2004). The photometric measures are based on aperture photometry, with zeropoints calibrated against 2MASS although they are not transformed into the 2MASS system (Hodgkin et al., 2009). In other words the magnitudes and colours we quote are on the WFCAM instrumental system; transformation equations are given in Hodgkin et al. (2009, eq. ).
Duplicated sources were removed
using the photometric error and the morphological classification to
select a ‘best’ unique entry per object, to produce a final catalogue
containing sources. Most of which are, as we show in
Sect. 3.1, Milky Way (MW) foreground sources. With the
exception of one pointing in the NE that
suffered from technical difficulties in the form of jittering causing
oblong images in one set of the K-band observations,
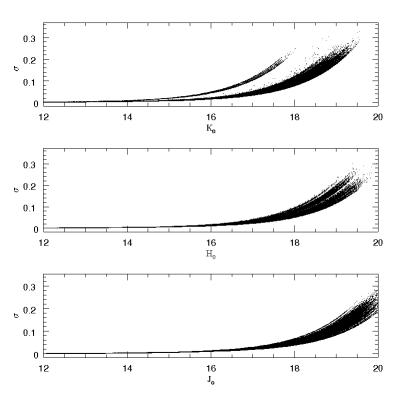
the typical seeing across the two observing runs was between . Figure 2 shows error vs magnitude
for each source in all three bands. The effect of the technical fault on
the -band observations can be seen in the top panel, sources from
that tile have a higher error for a given magnitude.
Total
reddening values across NGC 6822 have been found to vary widely from
E(B-V) = 0.24 in the outer regions to E(B-V) = 0.45-0.54 in the centre
(Hernández-Martínez
et al., 2009; Massey et al., 1995). Here, no corrections were made for
internal reddening. Corrections for the foreground component were
made using the extinction map of Schlegel et al. (1998). All
magnitudes and colours are
presented in their extinction-corrected (dereddened) form, denoted by
the subscript ‘’.
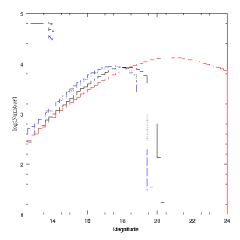
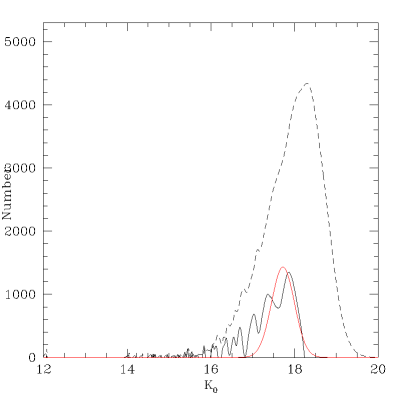
The maximum depth reached in each photometric band was and mag in and respectively. The completeness limit for each band has been inferred from Fig. 3 which shows the logarithmic distribution of the magnitudes in each band for our sample and the magnitude distribution of a synthetic MW foreground generated using the population synthesis code TRILEGAL Girardi et al. (2005). The shape of the sample distribution will be slightly different to that of the MW distribution due to the presence of NGC 6822 sources but the distributions do show some similar features. Both continue to increase along a similar line until they reach a peak and then start to decline. Whilst in the synthetically generated population this is due to some change in the population, in the sample distribution we believe the rollover, which occurs at brighter magnitudes, is the effect of decreasing completeness in the sample after the peak. Therefore, the data are assumed to be complete up to the peak of the distribution and we estimate the completeness at fainter magnitudes by normalising to the observed star counts at the peak of each band. In the -band we are complete to a depth of mag, falling to a completeness of between mag. In the -band we are complete to a depth of mag, falling to the level between mag and in the -band (including the poorer quality data) we are complete to a depth of mag, declining to complete between mag. For comparison, the completeness levels for the -band in the NE only are down to mag falling to the level between mag. AGB sources at the distance of NGC 6822 are expected to have an apparent magnitude brighter than mag, therefore we are confident that our sample is sufficiently complete for the purposes of this study.
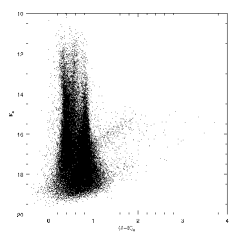
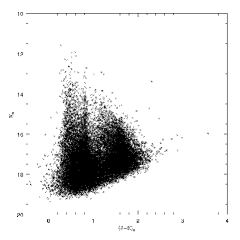
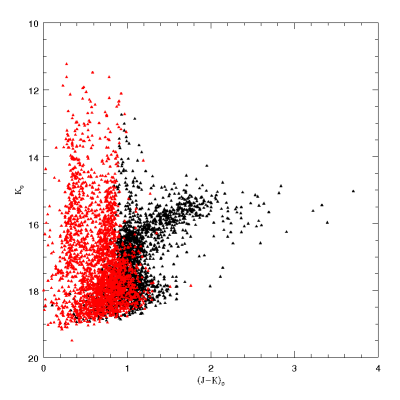
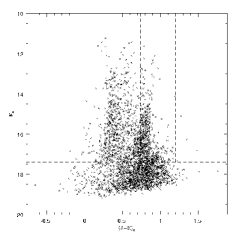
Sources in the photometric catalogue are flagged as stellar, probably stellar, compact but non-stellar, noise like, saturated, a poor-match with the astrometric data or non-stellar, in each band. This source classification is based on the flux curve-of-growth for a series of apertures; a similar method has been used in the IPHAS survey and is discussed in González-Solares et al. (2008). Considering only those sources with the same flag in all three bands, no compact non-stellar or poorly-matched sources remained; saturated objects (), noise-like sources, non-stellar, probably-stellar and stellar sources were left. To ensure a reliable data set for the subsequent analysis only sources consistently detected in all three photometric bands and classified as stellar or probably-stellar in each band were used. A colour-magnitude diagram (CMD) of these sources across the full observed area is shown in the left-hand panel of Fig. 4. Some of the sources listed as non-stellar are probably in fact stellar; comparing the first two panels of Fig. 4, many of the non-stellar sources with mag occupy the same region of the CMD diagram as the stellar sources. However, due to the problems of crowding or their being close to the detection limit of the data, it was not possible to resolve them adequately into individual stars and so they were classified as non-stellar and removed from the sample.
3 Analysis
3.1 The foreground
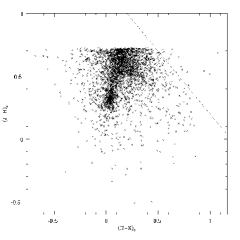
As NGC 6822 (, ) is close to the Galactic plane of the Milky Way observations suffer from heavy foreground contamination. The extent of this contamination is clearly seen in the left-hand panel of Fig. 4. Three vertical fingers at colours , and mag, have been associated with the following features following Nikolaev & Weinberg (2000): the bluest finger is due to blue supergiants of NGC 6822 and Galactic F-K dwarfs; the second is due to Galactic foreground stars including K-type dwarfs and giants as well as young supergiants of NGC 6822; the third results from Galactic M-type dwarfs and K-, M-type giants, as well as K- and M-type giants of NGC 6822. This feature merges with a less distinct vertical sequence, relating to the M-type AGB population of NGC 6822, up to about mag. At mag and brighter than mag, the C-type AGB stars of NGC 6822 occupy a diagonal sequence on the right of the CMD - these features are more clearly seen in the right-hand panel of Fig. 4. At magnitudes fainter than mag where the distinction between the vertical sequences becomes blurred, the sources are a mixture of Galactic G-, K- and M-type dwarfs as well as RGB and early-AGB stars belonging to NGC 6822.
The foreground contamination was substantially removed using
colour-selection criterion based on the work of Bessell & Brett (1988).
The appropriate colour
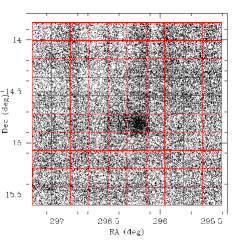
selection criterion was determined as follows; the full observed
area was subdivided into a grid of regions, each with dimensions
of (Fig. 5). Sources from the grid
region with the highest number density of sources - i.e. containing
the majority of NGC 6822 - were plotted on a
colour-colour diagram (, ). Sources from a region at the periphery
of the observed area (bottom left corner) that was assumed to be dominated
by MW foreground stars were then plotted on the same colour-colour diagram in a different colour
(Fig. 6). This process was repeated for each of
the peripheral regions to ensure that a suitable average
colour-selection criterion was adopted.
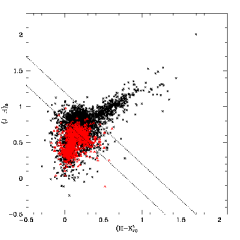
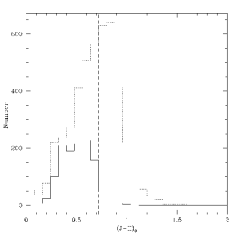
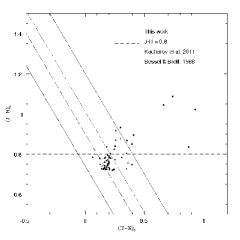
In Fig. 6 a distinct
separation in the colour distribution of the sources
from the centre and those from the outer region can be seen at mag. This is typical of all the peripheral regions.
Assuming that foreground stars are
evenly distributed across field, the stars with
mag are likely members of NGC 6822. This technique relies
on the separation of dwarfs and giants in to separate the foreground
dwarfs from NGC 6822 giants (Bessell & Brett, 1988, Fig. A3). The position of this
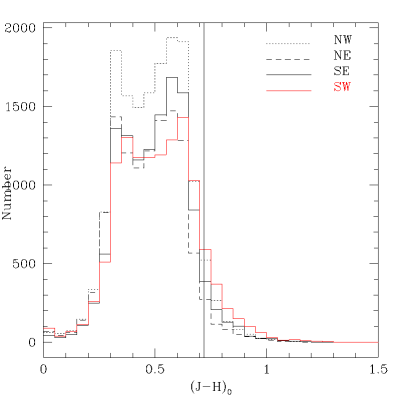
colour separation was confirmed using a colour histogram of sources
from the central and outer region (Fig. 7); the sharp decline
in the number of sources from the outer region at mag,
confirms the colour selection criterion.This method will also have
removed some genuine NGC 6822 sources bluer than (mostly RGB stars) from our sample.
However, as we are primarily interested in the detection and
identification of AGB, rather than RGB, stars this colour selection technique
is very effective (left-hand panel of Fig. 8)
and quite suitable for our purposes. Foreground giants are extremely
bright and are expected to have been removed as saturated sources ( mag)
during the data selection. Gullieuszik et al. (2008) also used this technique to remove
foreground contamination and to select C- and M-type stars above the
tip of the red giant branch (TRGB).
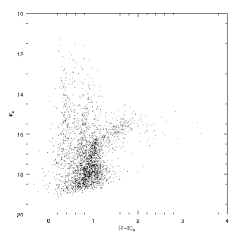
Some MW contamination of our sample is likely to remain. The presence of a few sources in the outer quadrant with mag suggests either a small leakage of foreground stars into the NGC 6822 sample or a small NGC 6822 component out to large radii. If they are contaminating sources many of them are later removed from the AGB sample by the application of a -band magnitude criterion (see Sect. 3.2). At most of the AGB stars retained in the central field will belong to the foreground, though this fraction will increase in the outer fields. Both alternatives are discussed further in Sect. 4.1.2. The right-hand panel of Fig. 8 presents a CMD of all the sources that remain after the application of the criterion and which are therefore are believed to be predominantly genuine members of NGC 6822. Although we are unable to absolutely identify individual sources in the CMD as MW contaminants, we note that the brightest sources extending up to mag - significantly above the C-type star branch - may be residual foreground contamination. We base this on the colour and magnitude distribution of a simulated foreground in the direction of NGC 6822 generated using TRILEGAL (Girardi et al., 2005). Using the maximum magnitude of the C-type star branch as a guide sources with a magnitude of mag have been isolated and their colour distribution examined. Approximately half lie near the mag boundary and seem likely to be foreground contamination, whilst the remainder lie significantly above this. After the application of the -band magnitude criterion discussed below, these potential contaminants make up less than of our sample. As we do not have conclusive evidence on which to reject these sources and due to their small number, it was decided not to use a bright magnitude limit or a more severe selection to remove them from our sample. However, the effect on our final results of using both of these methods to eliminate potential contaminants is discussed in Sect. 5.
3.2 The tip of the RGB
The TRGB is one of the most prominent features in the magnitude distribution
of old- and intermediate-age populations as it causes a large discontinuity
between the RGB and AGB populations and is commonly used to identify AGB
stars in galaxies outside the MW (e.g. Kang et al., 2006; Mouhcine et al., 2005).
In principle the removal of some genuine RGB sources as discussed in Sect.
3.1 may have affected our determination of the TRGB, however
the general position of the TRGB at mag still detectable in the
left-hand panel of Fig. 8 and is more obvious in the right-hand
panel of the same figure.
The exact position of the TRGB discontinuity was identified
from the magnitude distribution of sources within
a central region of using the Sobel edge
detection algorithm (Lee et al., 1993). This area was chosen
as it contains a large portion of the galaxy and therefore minimises
the effects of any residual MW contamination and is unaffected by the
poorer quality data collected in the outer NE field. The Sobel algorithm is a first derivative operator
that computes the rate of change (gradient) across
an edge, producing a peak where there is a significant change of
slope. Due to the large discontinuity (change in slope) in the magnitude distribution at the TRGB, the largest peak corresponds
to the position of the TRGB. As initially used by
Lee et al. (1993), the Sobel
filter had the disadvantage that the position of the resulting peak
is affected by both the bin sizing and the position of the bins in
the magnitude distribution. However, the improved analysis of
Sakai et al. (1996) applies the edge detection filter to a
smoothed magnitude distribution which is constructed by replacing each
discretely distributed stellar magnitude with a Gaussian curve of unit
integrated area and standard deviation equaling the magnitude error.
This avoids the problems of binning the data and is the technique
applied here.
After the Sobel filter was applied, a Gaussian was fitted to the strongest peak. The mean and dispersion of the fitted Gaussian were taken as the TRGB magnitude and associated error (Fig. 9). The following points should be noted: firstly, Cioni et al. (2000a) found the Sobel filter to be systematically biased towards fainter magnitudes, due to the effects of smoothing the data. Magnitude corrections were supplied by the same authors and have been applied here. Secondly, in order to ensure a credible detection with the Sobel filter, there must be at least sources in the range extending one magnitude fainter than the TRGB, according to Madore & Freedman (1995) and Bellazzini et al. (2002). As the TRGB is estimated by eye to lie between mag and the magnitude distribution contains in excess of sources in the range mag, the criteria regarding the reliable use of the Sobel filter have been met.
3.3 C- and M-type AGB stars
3.3.1 J-K colour selection
AGB stars of spectral type C or M are easily identified on a CMD
(Fig. 8, right panel). M-type stars follow a vertical
sequence above the TRGB with a large range of magnitudes at nearly
constant colour, whilst C-type stars display a smaller range of
magnitudes but a wider range of systematically redder colours,
resulting in a ‘red tail’ extending diagonally upwards and away from
the M-type stars. The redder colours of C-type stars are due to the
increasing molecular opacity in the stellar atmosphere as more carbon
is brought to the surface, leading to a marked cooling and a larger
temperature gradient across the population as stars develop from
M-type to C-type (Marigo et al., 2003). An estimate from the CMD
places this separation at mag. However, as there is
some overlap in the CMD between C- and M-type AGB stars, especially at
fainter magnitudes, it is difficult to identify a precise colour separation
between the two spectral types.
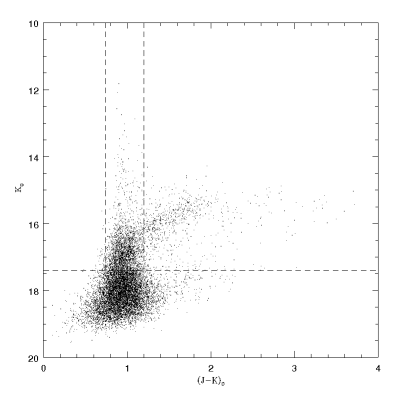
The adopted position of the separation has
been judged by eye from the discontinuity in the colour
histogram (Fig. 9) of the AGB sources in the same region used to determine the position of the TRGB. The highest
peak in Fig. 10 relates to M-type stars, followed at redder colours by a
significant drop and then a tail containing the C-type stars
(Cioni & Habing, 2005). The colour separation was found to lie
at mag. For mag and
mag, (Hodgkin et al., 2009, eq. 6 &
8), so the colour separation
corresponds to .
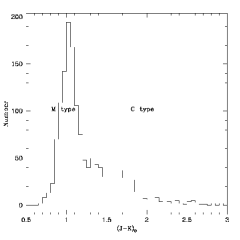
This value has been used for the purposes of identifying C- and M-type stars in the AGB sample. The application of such a sharp colour selection criterion suggests a strict transition between these two types of AGB stars; in reality this is unlikely and the colour separation depends strongly on the metallicity of the observed population (Battinelli et al., 2007). The identification and quantification of bias in our colour selection criterion will be the subject of a future paper using spectroscopic observations, but our selected value is strongly supported by the recent work of Kacharov et al. (2012).
3.3.2 A blue limit
The selected AGB sample spans a colour range of mag. In accordance with the findings of Bessell & Brett (1988) and Battinelli et al. (2007), it was decided to apply a ‘blue limit’ to the selection of M-type stars in order to exclude late K-type stars. An empirical blue limit of mag was used based on the colour histograms. In Fig. 10, mag marks the beginning of significant numbers of M-type AGB stars. To allow for some fluctuation in the position of this onset and the effects of binning the data, a slightly bluer limit has been selected to preserve genuine sources. The use of a more severe (redder) limit may underestimate the number of M-type stars; this is discussed further in Sect. 5.3.2.
The final criteria applied for the selection of M-type AGB stars was and mag. The upper colour limit is bluer than the limit applied in a study of the AGB population of NGC 6822 by Kang et al. (2006) ( mag) but it is in good agreement with the findings of Cioni & Habing (2005) ( mag). This limit also agrees well with the analysis of Battinelli et al. (2007), who in reviewing the colour limits applied in various studies of the AGB population in several Local Group galaxies, concluded that the C- and M-type star boundary is ill defined but suggest that mag is an appropriate limit for NGC 6822. An upper colour limit was not applied to the selection of C-type stars. We would expect the intrinsic colours of C-rich AGB stars to reach mag; sources redder than this may still be AGB stars that are heavily dust enshrouded, which are more likely to be C-type than M-type (Zijlstra et al., 2006).
4 Results
4.1 The structure of NGC 6822
4.1.1 Spatial distributions
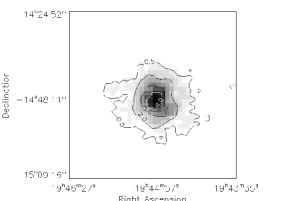
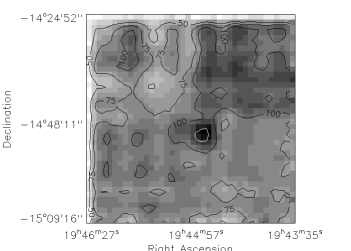
After the removal of much of the MW foreground and isolation of the C- and M-type AGB stars, source density plots were constructed to examine the distribution of these stars, the C/M ratio and the stellar population below the TRGB (RGB sources) across the surface of NGC 6822 (Fig. 11). The distribution of the removed MW foreground is also shown in this section (Fig. 12). The low resolution density maps have been constructed by counting the number of sources of various types in a 40 40 grid, where a single bin corresponds to , and then applying a box-car smoothing function of size . These maps were used to examine the large scale structure of the galaxy. The same procedure was then repeated to produce a high resolution map of the central of the galaxy in order to examine any finer structure that was present.
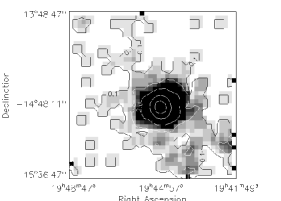
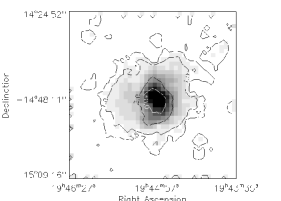
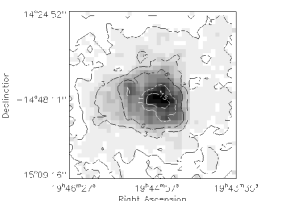
The distribution of C-type stars in both the low and high resolution maps are shown in the top panels of Fig. 11. The highest concentration of C-type stars is in the area of the bar, although the concentration is circular rather than following the elongated bar structure. The C-type stars do not appear to trace the HI envelope in any significant way.
The M-type AGB population (Fig. 11) is distributed similarly, though the bar-like elongation is clearer and the density of M-type stars is higher than for C-type stars. There is a clear under-density of M-type stars in the SE that is most obvious in the low resolution map and also in Table. 1 which shows the number counts of RGB, C-and M-type stars in the North-West, South-West, South-East and North-East of the observed area. There is a clear decline in the number of M-type AGB stars in the SE. This under-density may be due to a structure similar to the super giant shell, a large hole in the HI disk, described by de Blok & Walter (2000b), which does not contain any AGB stars. The high number of sources in the NW is attributed to the slightly better completeness levels in this region. Remaining MW foreground contamination would also affect M-type star and RGB counts in this region, the C-type star counts would not be affected as C-type stars are not seen in the MW foreground. This is discussed further at the in the context of foreground removal at the end of this section. There is also a clear overdensity in the SW of the galaxy which we will return to in Sect. 5.1.
| Type | ||||
|---|---|---|---|---|
| Carbon (C) | ||||
| Oxygen (M) | ||||
| RGB |
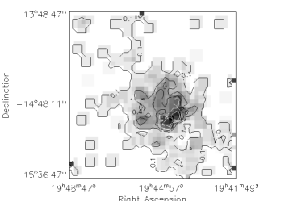
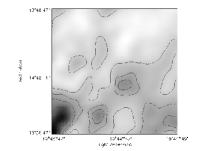
Figure 11 also shows the surface distribution of the C/M ratio across NGC 6822, where dark regions indicate a higher ratio. Variations in the C/M ratio are frequently assumed to reflect variations in the metallicity of the region, however, improvements in our understanding of stellar evolution and the effects of population age on the C/M ratio means that this traditional interpretation is no longer so straightforward. The C/M is not simply a function of metallicity, it is also dependent on the age of the population (Feast et al., 2010; Mouhcine & Lançon, 2003). Held et al. (2010) suggest that the ratio may be much more sensitive to the age variations in the population then previously thought. During their study of LeoI dSph, Held et al. (2010) concluded that the number of C-type stars is much more dependent on age than the number of M-type stars. A conclusion which is supported by the earlier work of Gullieuszik et al. (2008) on Leo II and by the work of Cioni et al. (2006). Gullieuszik et al. (2008) and Held et al. (2010) both show plots of the production of C- and M-type stars as a function of age, with the C-type star count peaking in the first Gyrs and falling off to almost nothing at Gyrs, both of which would affect the interpretation of the C/M ratio as a metallicity indicator in the conventional sense. A similar plot is shown by Cioni et al. (2006) for the LMC with the useful addition of another plot showing how this effects the C/M ratio. It is clear from this plot that the C/M ratio is dependent on the age of the underlying population. This age dependence is consistent with our current understanding of how carbon-rich AGB stars evolve. C-type stars are only expected to form over a certain mass, and therefore age, range due to their dependence on the efficiency and effects of the third dredge-up (TDU), Hot Bottom Burning (HBB), mass loss on the AGB and molecular opacity (Stancliffe et al., 2005; Marigo, 2007; Ventura & Marigo, 2010; Karakas, 2011). Karakas (2003) suggests that only AGB stars more massive than M⊙ undergo TDU and hence could become C-type stars. At present we do not have sufficient data to investigate the mass and age distribution of our candidate AGB stars. This work is been based on the classical interpretation of the C/M ratio as the calibration of Cioni (2009), like previous calibrations, derives the iron abundance solely from the C/M ratio without detailed consideration of other population variables such as age (or AGB star mass). However, we draw the readers attention to the age dependence of the C/M ratio as an aid to any future interpretation of our results when such data has been obtained.
Returning to Fig. 11, regions with the highest C/M ratio are located in and around
the centre of the galaxy, although there is no clear enhancement defining the
position of the bar. In fact the highest contour levels are slightly offset from
the centre. The high resolution map, especially, demonstrates the clumpy and
slightly elliptical distribution of the C/M ratio in the centre, set in two
larger, more evenly distributed regions with lower C/M ratio’s. Under traditional
assumptions this clumpy distribution would suggest areas of lower metallicity
in the galactic centre surrounded by regions with a higher metal content. Whilst
the patchy distribution of the C/M ratio may be a real feature, the
metallicity distribution, associated with the traditional
interpretation of the C/M ratio, would be unusual as the central regions of a galaxy are typically
expected to show a concentration of more metal-rich stars. It seems more
probable that the irregular clumps in the C/M ratio are not the result of metallicity
effects alone and other population parameters may also be important.
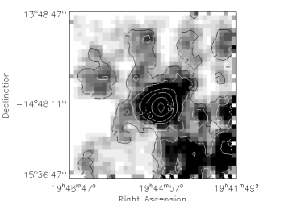
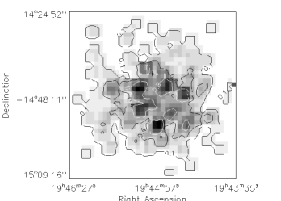
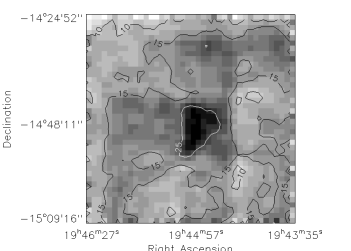
The
lower panels of Fig. 11 show the source density plots for all those
sources belonging to NGC 6822 that are below the TRGB ( mag)
and therefore were not identified as AGB stars. These sources will
mostly be RGB stars. They are distributed more smoothly
across the face of the galaxy and at a higher density than the AGB population. This makes the
under-densities due to the poor sensitivity in the NE more obvious,
however the under-density in the SE seen in the M-type AGB density
plots is less apparent in the low resolution RGB plot.
In the low resolution RGB density plot there is also for the first time
a noticeable contour in the NW-SE direction that may be tracing the HI envelope.
This contour extends slightly to the SW as well, but a stellar overdensity
in this region is not obvious.
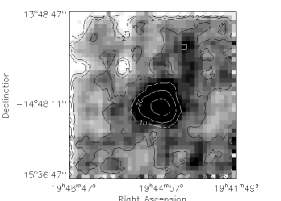
The source density plots in Fig. 12 show the distribution
of the sources removed from our data set as MW foreground stars
(Sect. 3.1). Foreground stars are expected to be
distributed homogeneously across the observed area. However, there are
overdensities in the centre and in the NW. This indicates that the
foreground removal in the centre at least has been slightly too severe
and some genuine NGC 6822 stars have also been removed, however, a CMD
(Fig. 13) of the sources in the central overdensity
indicates that few genuine M- and C-type stars have been
removed. Although sources fall within the region occupied
by the M-type AGB stars and sources fall in the region
occupied by the C-type stars, these objects do not conform to the same
CMD as the NGC 6822 AGB sources in Fig. 8 (right
panel) - there is no M-sequence at and no diagonal
C-branch. These sources are probably genuine MW stars correctly
subtracted. The greater number of sources in Fig. 13 are
below the TRGB. Therefore of the genuine NGC 6822 sources that have
been wrongly removed the majority will be (K-type) RGB, rather than
AGB, stars. These genuine RGB sources will fall primarily in the
left-hand branch (i.e. bluer than ) of the
inverted , shown in the colour-colour plot (Fig. 14) of
the same region - among genuine foreground sources. It is these RGB
sources that we believe are responsible for the overdensity seen in
the centre of the plots in Fig. 12. As RGB sources are not
our primary interest and as discussed in the Sect. 3.2 we do
not believe their loss will impact on our determination of important
variables, like the TRGB, it was decided to continue with the current
foreground removal technique. The overdensity seen in the NW of
Fig. 12 corresponds roughly to a WFCAM tile and suggests
better observing conditions in this direction resulted in more faint
stars and hence more foreground objects being catalogued there. A
version of the low resolution plot using only those sources with a
magnitude of shows a much smoother distribution of
sources with no obvious overdensity in the NW. Figures 2 and
3 were also produced separately for the NW and compared with
the average for the total observed area. Observations in the NW have
lower photometric errors and retain a completeness level to a
greater depth ( mag). These figures have not been
included here due to space restrictions, but seem to confirm the NW
overdensity in Fig. 12 to be primarily an observational
effect.
We acknowledge that the sharp colour separation
applied between the MW foreground and the M-type AGB stars of NGC 6822
(Fig. 6) may result in some genuine AGB sources being
lost. The number of M-type sources counted and therefore the C/M ratio
is affected by the imperfect nature of the colour selection
criteria. This will be discussed further in Sect. 5.3.1.
4.1.2 Stellar density profiles
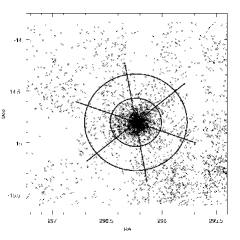
In order to further investigate the effectiveness of the foreground subtraction and the distribution of the NGC 6822 population, stellar density profiles of the AGB and the RGB (referring to all those sources below the TRGB) populations of NGC 6822 have been constructed. Using the position angle (PA) of the bar PA (Hodge, 1977) and its inclination (Cioni & Habing, 2005), the distance in kpc from the galactic centre and an angle in the plane of the galaxy, measured anticlockwise from the major axis of the bar were calculated for the central coordinates of each region in a multi-resolution grid (Fig. 15). The PA does not affect the calculated distances in this case (as ), it does give the zero-point of the angle . The PA and of the bar were used as it was the most prominent feature in the surface density plot of the AGB population.
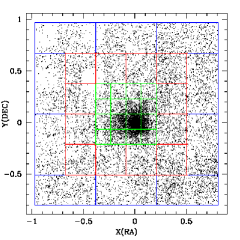
Fig. 16 shows the number density of C- and M-type AGB stars and RGB stars per unit area in each region of Fig. 15, plotted against distance from the galactic centre. The density of C-type stars show a fairly steep decline from the centre of the galaxy out to about kpc before leveling out. A similar pattern is repeated in the density profile of the M-type stars, leveling out closer to kpc. The density profile of the RGB stars shows similar behaviour - a steep decline is seen out to kpc after which the source density is almost constant out to kpc. We note the slight downturn at kpc and attribute this to the poorer quality data we received from the NE quadrant, this is discussed further below.
We consider two possible interpretations for the observed decline and leveling out of the source density profiles at kpc. The first is that the leveling out at a more constant stellar density is the result of remaining MW foreground sources becoming dominant in the sample at this distance, as foreshadowed in Sect. 3.1. The second alternative is that the stars beyond kpc constitute an extended halo around NGC 6822 populated predominantly by RGB and some M-type AGB stars, with few C-type stars. Under the former scenario the decline in the C- and M-type star density profiles at similar radial distances would then represent the decreasing stellar density of NGC 6822, whereas under the second scenario it would represent the transition radius from the central region to the halo.
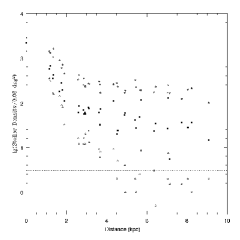
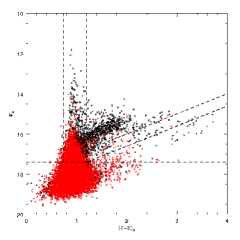
Figure 17 also illustrates the declining number of AGB stars, especially of C-type stars, with radial distance from the centre. It shows a CMD of all the sources (in black) remaining after the removal of the foreground with those sources which are outside the small grid - Fig. 15, i.e. kpc from the galactic centre - shown in red. The sources in black show the peak belonging to the M-type AGBs and the diagonal branch belonging to the C-type AGBs clearly. In comparison, sources more than kpc from the centre (red) do not generate the strong diagonal sequence. There are outer (red) sources at mag but most seem to have merged upwards from below the TRGB and do not look as though they belong to the C-star branch. Sources from the outer parts of the galaxy between mag, also do not follow the strong peak belonging to the M-type AGB stars quite as well. If the outermost stars are part of the MW foreground, then the clearest indication of where the stellar component of NGC 6822 ends is given by the stellar density profile of the C-type stars as they are not present in the MW foreground. This interpretation is also consistent with the much lower density and more even distribution of sources outside the centre of the galaxy in Fig. 11.
We have discounted the second scenario, an extended halo, as although extended stellar halo’s of this type have been detected in other galaxies, NGC 300 (Bland-Hawthorn et al., 2005) and M31 (Irwin et al., 2005) for example, in both cases the halo was discernible over several scale lengths. In the case of NGC 6822, if the slope in the stellar density profile of RGB population is measured between kpc a scale length of kpc is calculated. If the source density measurements from the NE quadrant, which are responsible for the apparent further decline in density at kpc, are removed the scale length of the proposed extended halo increases to kpc. Thus although the idea of an extended halo cannot be absolutely ruled out, we believe it is a dangerous inference to make based on a measurement over scale length or less. Therefore we adopt the first interpretation, that beyond kpc our sample is dominated by the MW foreground and that although genuine NGC 6822 AGB or RGB sources may still be present at low densities beyond this limit, we are unable to reliably disentangle them from the foreground with this data.
4.2 AGB catalogue
As a result of the analysis in Sect. 4.1.2, three catalogues are presented. The first, hereafter Catalogue 1, presents candidate C- and M-type AGB sources identified within kpc of the centre of NGC 6822. In order that our results may be verified we also present a second catalogue, Catalogue 2, containing all sources that met our reliability criterion (i.e. they have been classified as stellar or probably-stellar in all three photometric bands) across the full observed area - no other selection criteria have been applied to these sources. A third catalogue, Catalogue 3, is presented based on our findings during a comparative study of our work with the literature in Sect. 5.4 (we refer the reader to that section for further details) and contains sources identified as stellar or probably-stellar in only two photometric bands. Catalogue 3 also covers the full observed area. Table. 2 shows the first five lines of Catalogue 1, columns & list the Right Ascension and Declination in degrees for the equinox J2000, columns & list the dereddened magnitude and associated photometric error, columns & and & contain the same information for the and bands respectively and column classifies the star as either C- or M-type based on its colour. Tables 3 & 4 which contain similar data for Catalogues 2 and 3 but without the spectral type classifications and with the addition of three columns giving the flag reference for each photometric band. The flags are as follows; -1: stellar, -2: probably-stellar, -3: compact non-stellar, -8: poor astrometry match, -9: saturated, 0: noise-like and 1: non-stellar.
| 296.284058 | -14.350628 | 18.69 | 0.09 | 17.94 | 0.06 | 17.12 | 0.04 | |
| 296.081787 | -14.363892 | 17.95 | 0.05 | 17.15 | 0.03 | 17.07 | 0.04 | |
| 296.149323 | -14.364606 | 18.50 | 0.07 | 17.74 | 0.05 | 17.39 | 0.05 | |
| 296.248138 | -14.369500 | 18.09 | 0.05 | 17.34 | 0.04 | 17.18 | 0.04 | |
| 296.397949 | -14.374426 | 18.23 | 0.07 | 17.50 | 0.05 | 17.28 | 0.05 | |
| … | … | … | … | … | … | … | … | … |
| 296.377350 | -13.832600 | 15.56 | 0.009 | -1 | 15.19 | 0.008 | -1 | 15.14 | 0.010 | -1 |
| 296.366150 | -13.832656 | 14.84 | 0.006 | -1 | 14.50 | 0.005 | -1 | 14.45 | 0.006 | -1 |
| 296.564667 | -13.832878 | 16.23 | 0.010 | -1 | 15.86 | 0.010 | -1 | 15.75 | 0.040 | -2 |
| 296.771759 | -13.832906 | 17.28 | 0.030 | -1 | 16.61 | 0.030 | -1 | 16.39 | 0.070 | -1 |
| 296.739380 | -13.832977 | 14.42 | 0.004 | -1 | 14.10 | 0.004 | -1 | 14.08 | 0.010 | -1 |
| … | … | … | … | … | … | … | … | … | … | … |
| 296.335815 | -13.832008 | 0 | 0 | 0 | 16.34 | 0.02 | -1 | 16.23 | 0.02 | -1 |
| 296.630035 | -13.832100 | 0 | 0 | 0 | 16.46 | 0.02 | -1 | 16.43 | 0.07 | -1 |
| 296.654297 | -13.832395 | 18.28 | 0.07 | -1 | 17.81 | 0.08 | -1 | 17.45 | 0.17 | 1 |
| 296.562927 | -13.832434 | 19.05 | 0.14 | -1 | 18.28 | 0.11 | -1 | 0 | 0 | 0 |
| 296.705200 | -13.832597 | 18.56 | 0.09 | -1 | 18.02 | 0.09 | -1 | 0 | 0 | 0 |
| … | … | … | … | … | … | … | … | … | … | … |
Catalogue 1 contains AGB stars, of which are C-type stars and are M-type stars. Applying our selection criteria to Catalogue 2 we find candidate AGB sources of which are C-type stars and are M-type stars. However, it should be noted based on our findings in Sect. 4.1.2, that we would expect both samples to contain foreground contamination.
4.3 The C/M ratio
4.3.1 Catalogue 1
Conventionally the C/M ratio is used as an indirect indicator of the metallicity of the environment in which AGB stars formed (Mouhcine & Lançon, 2003). A higher ratio is assumed to imply a lower metallicity, because in low metallicity environments fewer dredge up events are required to create a carbon-rich atmosphere. The C/M ratio is also affected by the shift in the AGB evolutionary track to higher temperatures at lower metallicities, which reduces the number of M-type AGB stars and increases the number of K-type stars (Marigo et al., 1999; Iben & Renzini, 1983).
| (1) |
Within kpc of the centre of NGC 6822 a C/M ratio of is derived. Using Eq. 1 this yields an overall iron abundance of [Fe/H] dex. For the full observed area the C/M ratio is , which yields an iron abundance of [Fe/H] dex but the foreground contamination of the M-type star population is not negligible (Fig. 17). To obtain more reliable values for C/M and [Fe/H] further foreground removal is undertaken in Sect. 4.3.2.
The error in the count of C- and M-type stars in each region has been calculated using Poisson statistics (). This is appropriate as the determination of the number of C- and M-type stars is a counting exercise. Although we expect some variation in the number of stars of each type we would expect the number per unit area to be around some definite average rate (). The error associated with the C/M ratio and [Fe/H] has been calculated using the general formula of error propagation where the error associated with the count of C- and M-type stars have been treated as random and independent.
4.3.2 Statistical foreground removal
Whilst the removal of foreground contamination by colour is a very useful technique, it is imperfect. Individual sources with mag were removed as MW foreground (Sect. 3.1) but based on our findings in Sect. 4.1.2 it was decided that further statistical foreground removal was required. Using only those sources beyond the central kpc, i.e. those dominated by MW foreground, the average number density of C- and M-type stars that remained after the initial foreground removal was calculated. It was found that there were M-type stars and C-type stars remaining per deg2 (or M-type stars and C-type stars per kpc2). The count of AGB stars of each type inside a radius of kpc was then reduced accordingly. The effect of this statistical adjustment on the C/M ratio inside kpc is that it increases to , giving an [Fe/H] of dex. A comparison with previous estimates of the C/M ratio in NGC 6822 (Kang et al., 2006; Cioni & Habing, 2005) and the sensitivity of the ratio to the initial foreground selection criterion will follow in Sect. 5.
4.4 Gradients
Variations in the TRGB magnitude, C/M ratio and [Fe/H] across NGC 6822 are examined in this section as a function of distance from the galactic centre and azimuthal angle. The region inside kpc has been divided into annuli extending between kpc and kpc. These annuli have then been further divided every (Fig. 18) leaving regions that can be used to study any variation in the TRGB magnitude, C/M ratio and [Fe/H] with angle. In order to study these parameters as a function of distance from the galactic centre the area inside kpc has been separately divided into annuli at a spacing of kpc between kpc and the TRGB magnitude, C/M ratio and [Fe/H] measured/calculated for each annulus. Each region has been checked to ensure the criteria for the reliable application of the Sobel filter has been met.
4.4.1 The metallicity gradient
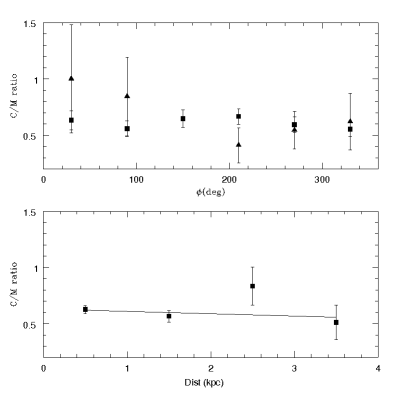
Prior to the calculation of the C/M ratio and [Fe/H] value the relevant statistically adjustments have been made to the counts of C- and M-type stars, as outlined in Sect. 4.3.2. The top panel of Fig. 19 shows the distribution of the C/M ratio as a function of angle for both the inner annuli ( kpc) and the outer annuli ( kpc) of Fig. 18. In the bottom panel of the same figure the C/M ratio is plotted as a function of distance from the galaxy centre. Similar plots for the [Fe/H] abundance have also been made and are presented in Fig. 20.
A spread of has been detected in the C/M ratio out to a radius of 4 kpc, this translates into a spread of 0.18 dex in the iron abundance between dex and dex. For the inner annuli there does not appear to be any obvious dependence on angle in the distribution of the C/M ratio (Fig. 19. For the outer annuli there is a significant scatter in the ratio and a possible decline in the ratio with increasing angle, however the size of the associated error bars, due to the small number of sources, suggest that we can not draw any firm conclusions about the behaviour of the C/M ratio with angle in the outer annuli. In the bottom panel of Fig. 19, the C/M ratio has been plotted as a function of distance for the annuli described above. A small negative gradient appears to be present in the C/M ratio (C/M dist/kpc), calculated using a weighted least-squares fit but the size of the associated error suggests this is not significant, again due to the declining stellar density and hence small number statistics.
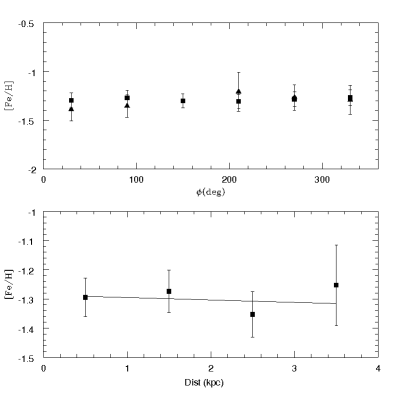
In the top panel of Fig.20 [Fe/H] is plotted as a function of angle. Data points for both the inner and the outer annuli are presented but there is no obvious variation of [Fe/H] with angle in either case. In the bottom panel [Fe/H] is plotted as a function of distance from the galactic centre. As with the C/M ratio a weighted fit of the data gives a slightly negative slope of [Fe/H] dist/kpc, which again implies no significant gradient.
As we have selected the C- and M-type stars in each region of the galaxy on the basis of
colour, reddening variations within NGC 6822 may also affect the distribution of the
C/M ratio.
The sensitivity of the C/M vs. [Fe/H] relation to changes in the
selection criteria for C- and M-type stars, and the robustness of the C/M ratio
as an indicator of metallicity, will be discussed further in Sect. 5.3.
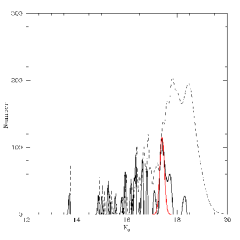
4.4.2 TRGB variations
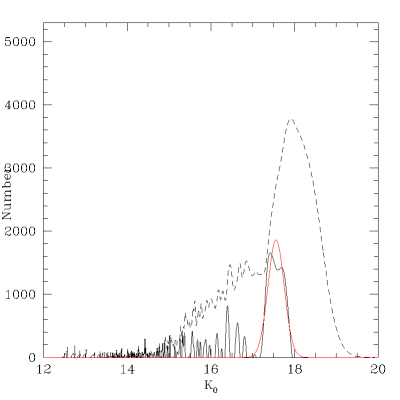
Within a radius of kpc (Fig. 18) a variation of mag was found in the magnitude of the TRGB, with an average and standard deviation of mag. When measurements made outside the kpc limit are included the spread of values in the position of the TRGB increases dramatically to mag. The much greater spread in TRGB values detected outside the central kpc is attributed to the decline in the number of genuine NGC 6822 sources, hence we are not detecting a genuine TRGB here but simply a variation in the magnitude distribution of the MW foreground. Figure 21 shows the -band magnitude distributions of stars within (left) and beyond (right) kpc. The AGB population is obvious in the inner sample at , but is inconspicuous in the outer subsample, consistent with the galaxy being lost in the MW foreground contamination beyond kpc (Sect. 4.1.2). Hence TRGB measurements beyond kpc are either poorly constrained or entirely spurious. The measurements arise only because the Sobel filter reports the position of the greatest change of slope in the magnitude distribution but if those stars are dominated by the MW foreground and not the RGB population in NGC 6822, then there may not be an RGB termination.
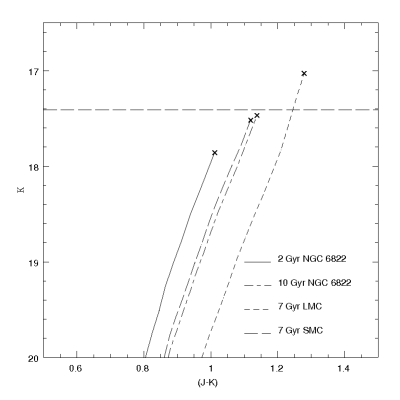
-band measurements of the TRGB magnitude are sensitive to both the age and metallicity of the population (Salaris & Girardi, 2005). In a population of a single metallicity, the TRGB in the -band is fainter in the intermediate-age stars than in the older population. Whilst in a population of a single age the TRGB magnitude is brighter with increasing metallicity. Fig. 22 clearly demonstrates the individual effects of these two variables. For a population of mixed age and metallicity the anti-correlation between these two affects makes it difficult to decipher the cause of any observed magnitude spread (Salaris & Girardi, 2005; Gullieuszik et al., 2008).
In order to try and understand the metallicity and age distribution of the underlying AGB population and also the structure of the galaxy, the distribution of the TRGB magnitude has been investigated as a function of distance from the galactic centre and azimuthal angle. Negative values on the vertical axis represent a TRGB brighter than mag. The top panel of Fig. 23 shows the variation in the TRGB magnitude with angle for both the inner and outer annuli (Fig. 18). The data shows no obvious trend with angle for either annuli.
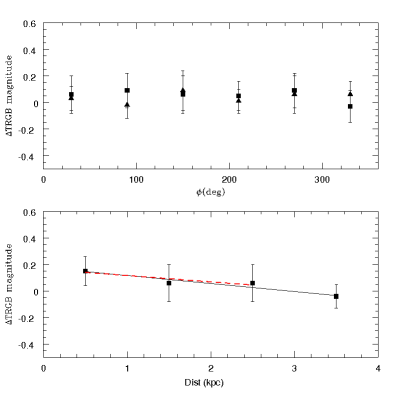
In the bottom panel of Fig. 23, a weighted fit to all the data shows a negative slope (TRGB dist/kpc) in the TRGB magnitude with radial distance. This is an interesting result but may be the result of increased distortion in the magnitude distribution as remaining foreground contamination becomes more severe in the outer annuli. Therefore a weighted fit was also made to the inner three data points only and a negative slope was again found (TRGB dist/kpc), although the slope is reduced from to a detection. Such a slope could be consistent with the presence of a halo of older stars around NGC 6822. Assuming an environment with relatively little variation in metallicity (Fig. 20) and given that there seems to have been little recent star formation in the outer galaxy (Battinelli et al., 2006; Stinson et al., 2009). A shift in the TRGB to brighter magnitudes could be indicative of the increasing age of the population (Salaris & Girardi, 2005). Therefore, although we advise caution due to the size of the associated errors in Fig. 23, the shift to a brighter TRGB magnitude in the outer galaxy may be a genuine feature.
An alternative possibility that the variation in the TRGB is due to the inclination of the galaxy to our line of sight, has been rejected as it would require NGC 6822 to have a depth of kpc. The effects of reddening have been shown to vary across NGC 6822, this may also account in part for the variation that has been detected. The Schlegel et al. (1998) maps show an extinction range of E() to in the direction of NGC 6822 and a spread of is found in the literature (Sect. 2). However, even the larger range of values is insufficient on its own to account for the TRGB magnitude spread.
As all the TRGB values measured within kpc of the galactic centre are within of the mean value ( mag) the spread we observe may also simply be the result of random statistical variations. The position of the TRGB is not a single value but a range due to the width of the RGB in a composite population (Held et al., 2010). The effect of the detected spread in metallicity ( dex) on the TRGB magnitude for populations of a single age has been considered but it is insufficient to account for the TRGB magnitude variation when considered alone. A sufficiently large spread in the age of the population could account for the variation we detect, however, at this time we are unable to constrain the age of the AGB population.
The most likely scenario is that the TRGB magnitude spread is the cumulative result of a number of factors including reddening, age, metallicity, some distortion by remaining foreground contamination and expected variations in the TRGB. The spread detected in the - () and -bands (), in conjunction with - and -band data that we have yet to analyse, could be used to constrain the metallicity, age and extinction variations in NGC 6822 due to the different sensitivities of each waveband to these variables.
5 Discussion
5.1 The structure of NGC 6822
The large area covered by the data gives a good overview of the structure of the galaxy. The primary result of Sect. 4 was the placement of the kpc limit on the stellar component of the galaxy. This radial limit is supported by the source density plots (Fig. 11), the density profiles (Fig. 16) and the magnitude distribution plots (Fig. 21).
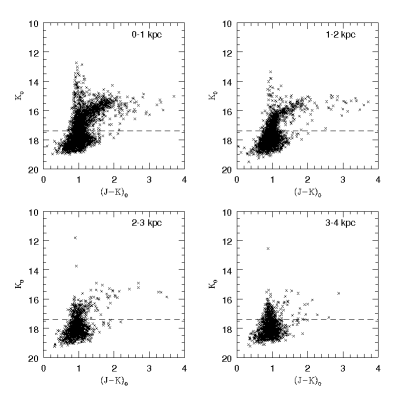
The source density plots in Sect. 4.1.1 show that the majority of the AGB population is concentrated in and around the region of the central bar but extends beyond this, with decreasing density out to about kpc. This is supported by Fig. 24 which shows a CMD of the sources contained within each of the annuli used to examine the behaviour of various parameters with distance (Sect. 4.4). The vertical sequence belonging to the M-type stars and the diagonal branch generated by the C-type stars are clearly visible in the top two panels especially but deteriorate with increasing distance from the galactic centre due to the declining number of sources. There does appear to be some structure beyond the kpc limit in the SW, this is particularly apparent in the low resolution source density plot of the M-type AGB population (Fig. 11). The cause of this overdensity in the SW will be discussed below. Aside from the SW overdensity, we detect no significant structure beyond the central kpc.
A radial limit of kpc corresponds to an angular distance of from the centre at a distance of kpc (a diameter of ) and is comparable to previous estimates of the extent of the stellar component of the galaxy by Letarte et al. (2002), Demers et al. (2006) and Battinelli et al. (2006). Using R, I, CN and TiO filters, Letarte et al. (2002) surveyed C-type stars in an area of in NGC 6822 and were the first to propose the existence of a “halo” of old - and intermediate age stars around NGC 6822. Letarte et al. (2002) suggested that the spheroid had a major-axis length of (i.e. a radius of kpc) at a distance of mag. This is smaller than what we see in Fig. 16; given the smaller observing area of Letarte et al. (2002), though by having data significantly further out (to a distance of kpc) we are able to see the extent of the structure more clearly and trace the AGB halo out to a radius of kpc. In a survey of area using and filters, Battinelli et al. (2006) traced the density enhancement of RGB sources, selected from their CMDs, from the centre of NGC 6822 out to a semi-major axis distance of ( kpc, assuming a distance of kpc). Battinelli et al. (2006) also provide a surface density profile of the C-type stars identified from the SDSS colours to supplement the findings of Letarte et al. (2002), although they admit that C-type stars cannot be unambiguously selected without appropriate corrections due to contamination from background galaxies in the data. They conclude that a non-negligible number of C-type stars are detected up to ( kpc). The extent of the RGB population detected by Battinelli et al. (2006) is comparable with what is seen in Fig. 16, however, we do not claim to reliably detect C-type stars out to such large distances as Battinelli et al. (2006). In a follow up to the work of Battinelli et al. (2006), Demers et al. (2006) observed two regions of in the J and Ks bands along the major-axis of the spheroidal halo to further assess the extent of the C-type population. They present a surface density profile that is consistent with the work of Battinelli et al. (2006) clearly showing the C-type population extends at least out to an angular distance of ( kpc at kpc), and possibly beyond. Kacharov et al. (2012) also provides evidence for a radial limit of kpc on the stellar component of NGC 6822, they found that all their candidate M- and C-type AGB stars outside the elliptical spheroid of Battinelli et al. (2006) for which they were able to collect low-resolution spectra were in fact MW dwarf stars.
We have detected the AGB population out to a distance of
kpc. However, Lee & Hwang (2005)
presented preliminary results reporting the discovery of a star cluster
belonging to NGC 6822 at a distance of kpc from the galactic centre.
Hwang et al. (2011) expand on these findings with new star clusters
associated with NGC 6822 spanning an area of ,
this is much larger than the area examined here or
by Battinelli et al. (2006). This suggests
that the structure of NGC 6822 is complex and cannot be traced by a single
stellar population. Such complex structure has also been detected
in other dwarf irregular galaxies like Leo A (Vansevičius et al., 2004), the LMC
(Minniti et al., 2003; Cioni et al., 2000b) and IC 10 (Demers et al., 2004).
The reliable detection of the AGB population of NGC 6822, the M-type star
population in particular and of the extent of the stellar halo has been hampered
by heavy foreground contamination. Our selection of the criterion for
the initial removal of the contaminating foreground will be discussed further
in Sections 5.2 and 5.3.1. However, we are confident that we have
isolated well the C- and M-type AGB population of NGC 6822 within kpc of the
galactic centre and for the first time provided NIR observations across the whole of
the AGB stellar component.
5.2 The SW overdensity
The overdensity seen in the SW of the low resolution M-type AGB source density plot in Fig. 11 is not seen C-type or RGB populations at any significant level. This would seem to suggest that the overdensity is either populated almost exclusively by M-type stars or that it is the result of an excess MW foreground with M-star-like NIR colours leaking into our sample. The fact that the overdensity is not observed in the C-type star density plots is consistent with either proposition, as C-type stars do not appear in the MW foreground in any significant quantity. Figure 25 shows the distribution of sources in a field at the edge of the observed area in the NE, NW, SE and SW (red). In the SW the distribution is clearly shifted to the red, and of the total number of sources in that region are redder than mag, compared to an average of in the NW, NE and SE quadrants. This indicates that the leakage of MW stars into the SW quadrant will be almost twice as high as in the other quadrants.
The reason for the difference in colour is harder to discern
but we suggest differential reddening. Our sample has been corrected
for foreground reddening using the Schlegel et al. (1998) dust
maps (Fig. 26), however,
the higher resolution of our data means that this correction is imperfect and
some reddening variation will still be present in the sample. This
may account for the redder distribution of sources in the SW and
the consequent leakage of more foreground sources into our sample
in that region. However, Kacharov et al. (2012) find only a negligible
variation in the NIR extinction across the observed area and conclude
that the overdensity in the SW (based on the same photometric
catalogue) may be a genuine extension of NGC 6822
but that spectroscopic confirmation is required.
An examination of the CMD
in the SW overdensity does not show any strong features to
suggest that this structure is made up of genuine NGC 6822 AGB
stars. Although there is a vertical feature extending to brighter
-band magnitudes than in the
SE, it does not represent a strong M-star peak and is probably the
result of the higher density of sources in the SW. Furthermore, the
magnitude distribution of the sources in the SW does not show a strong
TRGB but a rather broad distribution similar to the one seen in the
right-hand panel of Fig. 21.
Although, due to foreground contamination of the sample outside the densest
region of the galaxy and the difficulty of
identifying NGC 6822 stars with certainty from photometric data, we
can not rule out the possibility that the SW overdensity does contain
some outlying AGB stars.
In the context of reddening variations across the galaxy, it is also interesting to note the underdensity in the SE that was seen in the source density plot of the M-type AGB stars (Fig. 11), but which is much less apparent in the other source density plots. Previously (Sect. 4.1.1) we suggested that this underdensity may coincide with the Super Giant Hole in the HI disk (de Blok & Walter, 2000a). This region also coincides roughly with an area of significant reddening variation (Fig. 26) and from the colour distribution in Fig. 25 it is clear that the decline in sources in the SE occurs at bluer colours ( mag) relative to the SW and NW. We conclude that the underdensity in the SE is more likely to be the result of an over subtraction of sources due to imperfect reddening-correction in that region rather than a real feature.
The removal of foreground contamination via colour alone is a useful but imperfect method as the selection of the colour criterion used is subjective. Any under- or over-subtraction of the foreground will primarily affect the M-type AGB sources rather than the redder C-type stars - see Fig. 6 - and can affect bias the derived C/M ratio; this will be discussed further in Sect. 5.3.1.
5.3 C/M ratio and [Fe/H]
Globally we find a [Fe/H] value of dex (C/M ) for AGB stars within a kpc radius of the centre. This value is in good agreement with the findings of other authors who have derived the iron abundance of NGC 6822 using the C/M ratio.
Using broad- ( and ) and narrow-band ( and ) filters to
identify the C-type population in the central of NGC
6822, Letarte et al. (2002) derived the C/M ratio to be . The size of the M-type population in the work of
Letarte et al. (2002) was estimated by subtracting the estimated
stellar density of the foreground, measured in two strips at the edge
of the observed area that were assumed to contain a negligible number
of genuine NGC 6822 sources, from the total observed sample. No iron
abundance was given by Letarte et al. (2002) but using the
relation of Cioni (2009), this corresponds to a value
of [Fe/H] dex.
Using similar techniques to those employed
here ( and -band photometry) Cioni & Habing (2005)
estimated the C/M ratio in the central of NGC 6822 to
be , with an absolute variation of . This corresponds to
[Fe/H] dex and a variation in the iron abundance of
[Fe/H] dex using the C/M vs. [Fe/H] relation given in
the same paper. Again using photometric filters,
Kang et al. (2006) surveyed the central of
NGC 6822 and reported an overall C/M ratio of , with
variations between and in the north
and south respectively. This translates into [Fe/H]
dex globally, using the relations of Battinelli & Demers (2005) and
Cioni & Habing (2005) (Groenewegen, 2006), with a
variation of dex across the observed area. Using the
more recent relation of Cioni (2009) we derive an
average [Fe/H] of dex with a spread of dex using the
values of Kang et al. (2006).
More recently Kacharov et al. (2012) have presented a C/M ratio of with a variation between and , based on their analysis of the original UKIRT catalogue used here but selection criteria determined from the analysis of a spectroscopic sample. This ratio yields a mean [Fe/H] between and dex using the relations of Groenewegen (2006), Battinelli & Demers (2005) and (Cioni, 2009) with average values of , and dex respectively. These values are in good agreement with our own but the following points should be noted; firstly, some of the selection criteria used here, in particular the blue limit, are quite different from those used by Kacharov et al. (2012). Secondly, Kacharov et al. (2012) themselves note that their spectroscopic sample is biased towards C-type stars, which may have affected their determination of the AGB selection criteria and therefore their determination of the C/M ratio. Both of these points are discussed in more detail below (Sect. 5.3.2). For our analysis we have adopted the most recent calibration of Cioni (2009) but for comparison we note that using our C/M ratio () and the relations of Cioni & Habing (2003), Groenewegen (2006) and Battinelli & Demers (2005) we obtain [Fe/H] values of dex, dex and dex, respectively, in the central kpc of the galaxy. Therefore any comparison of metallicities derived from the C/M ratio must take into account the relations that have been used to derive them.
Other estimates of the mean metallicity of the old- and intermediate-age stars of NGC 6822 that do not rely on the C/M ratio range between dex (Tolstoy et al., 2001; Davidge, 2003) and dex (Gallart et al., 1996), with significant scatter. Tolstoy et al. (2001) used measurements of the equivalent width of Ca II triplet lines of individual RGB stars in NGC 6822 to determine a mean metallicity of dex with a range between and dex. Tolstoy et al. (2001) comment that they do not see any evidence for spatial variations but they only observed a small area () near the centre of the galaxy. Davidge (2003) used photometry to investigate the slope of the RGB in three fields () across NGC 6822 and determined a mean value of [Fe/H] dex. Therefore the global value of [Fe/H] we present is consistent with previous findings for AGB and RGB stars from a number of sources and sits about the mid-point of the range of metallicities proposed for the galaxy. The consistency between these populations suggests little chemical evolution during their genesis but the wider metallicity range seen if genuinely old RR Lyrae and genuinely young A-type stars are considered (Sect. 1) shows that the chemical enrichment of the ISM of NGC 6822 has been a continual process across multiple stellar generations.
5.3.1 Sensitivity to the foreground J-H cutoff
The colour ( mag) used to remove foreground contamination was selected as described in Sect. 3.1. Kacharov et al. (2012) used a similar colour ( mag) for the removal of the foreground based on their spectroscopic analysis of a small subset of the photometric catalogue. However, considering the effects of residual MW contamination in the photometric sample on our analysis of the C/M ratio and the underlying structure of the galaxy after the application of our colour criterion, we feel it warrants further discussion.
Figure 6 shows the colour-colour diagram of sources from the galactic centre and the MW foreground and shows the position of the cut off. We see that there is some leakage from the foreground above this limit. Based on their spectroscopic sample, Kacharov et al. (2012) examine what percentage of their confirmed MW dwarfs fall in the same region as the AGB stars using different cuts. As we would expect from Fig. 6 this percentage is reduced with increasing values of . Based on Fig. 6, a colour selection of mag would reduce foreground leakage into our sample significantly, but it would also eliminate many genuine M-type AGB stars. Consequently, the C/M ratio is sensitive to any variation in the criterion used for the removal of the foreground. A change in the colour criterion from to mag, leaving all other selection criteria unchanged and with no statistical foreground removal, would reduce the total number of remaining NGC 6822 stars from to , of which are AGB stars compared to previously. This is very significant for the determination of the C/M ratio as it is primarily the number of M-type stars that is reduced, i.e. their number decreases from to whereas the number of C-type stars is only reduced by from to . The effect on the C/M ratio over the whole observed area is to increase it from ([Fe/H] dex) to ([Fe/H] dex). Within the central kpc the C/M ratio increases from to ([Fe/H] dex). Some statistical foreground removal is still required, although this is reduced to M-type stars and C-type stars per kpc2. With the inclusion of the statistical foreground subtraction, the C/M ratio within kpc of the galactic centre increases to ([Fe/H] dex).
Thus given the dramatic reduction in the M-type star population and the effect on the resultant C/M ratio, and the spectroscopic agreement of Kacharov et al. (2012) with our foreground selection criterion we are confident that a mag colour selection, with the additional statistical subtraction detailed in Sect. 4.3.2, maximises the foreground removal whilst minimizing the effects of over subtraction on the C/M ratio and the derived metallicity.
Fig. 27 also shows the effectiveness of a more severe cutoff in eliminating a number of the very bright sources with mag (Sect. 3.1) which may be MW foreground sources that survived the mag colour selection. Interestingly, such a cut does not eliminate all the bright sources and as of them sit above mag they may well be genuine NGC 6822 sources. This possibility is supported by the sharp decline in the number of bright sources seen in the outer CMDs of Fig. 24; if these sources belonged to the MW foreground we would expect them to be homogeneously distributed across the observed area and therefore to see more of them in the outer CMDs that cover larger areas on the sky. This is not the case; in fact they are more prevalent in the central regions where NGC 6822 stars are concentrated, which suggests that at least some of these bright sources do belong to NGC 6822 - possibly red supergiants younger than the AGB population.
5.3.2 Sensitivity to the J-K blue limit
The blue limit is also important in the determination of the C/M
ratio. Here a limit of mag is used to exclude late
K-type stars from the sample whilst preserving as many genuine M-type
AGB’s as possible. As with the foreground criterion, the
blue limit can impact the number of M-type stars
significantly. Kacharov et al. (2012) use a blue limit of
mag, derived from their spectroscopic subset to
further eliminate foreground contamination from MW dwarfs from their
sample. This greatly affects the derived C/M ratio. This limit is
based on the colours of their spectroscopically confirmed
sample. However, whilst Kacharov et al. (2012) find no stars in
their spectroscopic sample that simultaneously have colours of
mag and mag, their original
spectroscopic sample was biased towards C-type stars and of the
photometric catalogue does fall in this region (in Catalogue 1
of our the candidate AGB sources lie in this region). As
Kacharov et al. (2012) were unable to classify this they
have excluded them when deriving the C/M ratio. We prefer to use a
lower blue limit for the selection of M-type stars as discussed in
Sect. 3.3.2, even though a bluer limit may remove
slightly more ‘potential’ MW contaminants from the sample
(Fig. 27).
In order to examine the sensitivity of the C/M
ratio to the blue limit used for the selection of M-type stars we have
applied a cutoff of mag to our AGB sample, leaving
all other selection criteria unchanged and without statistical
foreground subtraction. The resulting C/M ratio for the full observed
area increases to ([Fe/H] dex) and
inside the central kpc the ratio becomes C/M
([Fe/H] dex). With the inclusion of statistical
foreground subtraction (reduced to M-type stars per
kpc2), the C/M ratio increases to ([Fe/H] dex) within kpc of the centre.
Bessell & Brett (1988) suggest an even redder limit of mag to completely exclude those stars with a spectral type
earlier than M. Such a severe colour selection would also
expel more of the possible MW remainders (Fig. 27) but the
sharp reduction in the number of M-type stars would increase the
global C/M ratio to ([Fe/H] dex)
within a radius of kpc (with statistical foreground removal). The
results of our sensitivity analysis are summarised in
Table. 5, where all values include statistical foreground
removal and [Fe/H] values have been calculated using the relation
of Cioni (2009).
| 0.74 | 0.90 | 1.01 | |
|---|---|---|---|
| 0.72 | |||
| 0.80 | - | - | |
| - | - | ||
5.3.3 K-band and J-band criteria
Among other NIR studies of NGC 6822, there is quite a spread in the -band TRGB magnitude, the brightest of which is mag (Górski et al., 2011). As the C-star branch departs from the vertical column of M-type stars in the CMD above the TRGB. A brighter TRGB can reduce the number of M-type stars without any significant impact on the C-type star count. Górski et al. (2011) used a slightly modified Sobel filter with -band photometry, details of which are given by Gieren et al. (2006), to determine a TRGB magnitude for NGC 6822, which is much brighter than the TRGB used here. In order to examine the sensitivity of the C/M ratio to the TRGB magnitude we have applied the TRGB of Górski et al. (2011) to our sample, leaving all other selection criteria unchanged and with no statistical foreground removal. This gives a C/M ratio of ([Fe/H] dex) in the central kpc. With the inclusion of statistical foreground removal, this value increases to C/M ([Fe/H] dex).
We also examine the sensitivity of the C/M ratio to the application of an upper bound on the -band magnitude. As discussed in Sect. 3.1, sources which survived the foreground removal exhibited magnitudes significantly brighter than the C-type star branch and were considered as potential foreground interlopers. These sources are shown in the colour-colour diagram in Fig. 27. It was decided not to eliminate these sources from our sample using another magnitude cut during our main analysis, although due to the relatively small number of sources the effect on our final results would not have been significant if we had. Excluding all those sources with mag and leaving all other selection criteria unchanged, increases the C/M ratio to ([Fe/H] dex) within the central kpc (with statistical foreground removal).
Finally we examine the impact of applying -band selection criterion to eliminate those sources in Fig. 17 (Sect. 4.1.2) that we now believe belong primarily to the foreground but have merged into the C-star selection zone from below the TRGB. Based on Fig. 17 a -band criteria of mag was considered. Such a cut reduces the C/M ratio to ([Fe/H] dex) within kpc of the centre. However, the spectroscopic sample of Kacharov et al. (2012) suggests this would exclude a number of genuine C-type stars and heavily bias the ratio. Based on that work, a -band magnitude selection of mag in the region mag would seem more appropriate. When applied, this criteria has little effect on the C/M ratio - inside the kpc radial limit the ratio is reduced from to ([Fe/H] dex). All values are presented after statistically foreground removal. Neither of these cuts were implemented during our analysis as the work of Kacharov et al. (2012) was not available during the determination of our selection criteria and there was no clear justification based on our photometric data for the positioning of such a cut. The effect of the -band criteria on the C/M ratio does not appear to be significant.
We have carefully analysed the impact of various criteria on our selection process and the determination of the C/M ratio. The most important factors in selecting C- and M-type AGB candidates are the and boundaries and the TRGB magnitude. Using the extremes of these three criteria (, TRGB mag) as well as the band ( mag) and -band ( mag) criteria discussed above we would estimate the systematic error in our derived values to be which translates into a systematic error on the iron abundance of dex. However, we feel that both the value (Bessell & Brett, 1988) and the TRGB value (Górski et al., 2011) are too extreme and seriously bias calculated C/M ratio. Therefore, we prefer to calculate the systematic error based on the use of the most extreme selection criteria that we feel are appropriate (, TRGB and mag) and derive a C/M ratio and iron abundance errors of and dex, respectively.
5.4 Comparison with other catalogues
Catalogues of the AGB population of NGC 6822 were also presented by Letarte et al. (2002), Cioni & Habing (2005) and Kang et al. (2006) during their studies of the galaxy. Here we compare their findings with our Catalogue 1. The area observed in each study is presented in comparison with the area of our observations in Fig. 28.
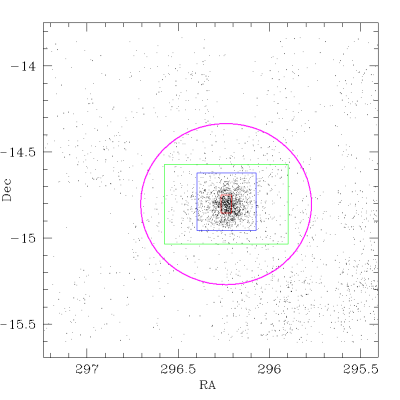
5.4.1 Letarte et al. (2002)
Letarte et al. (2002) identified carbon stars mainly tracing a ‘halo-like’ structure, extending beyond the optical size of the galaxy, using and criteria. In the same area (Fig. 28) we find AGB sources, of which we have been classified as C-type stars. The discrepancy of sources has several causes, which we explore below.
It may partially be the result of our misclassification of some C-type stars as M-type, due to the inexact colour boundary between the two spectral types. A comparison with the catalogue of Letarte et al. (2002) provides a means by which to estimate the error in the criteria applied here and ultimately in the C/M ratio that we derived. After cross-matching our AGB catalogue with that of Letarte et al. (2002), we have identified sources in common. Of these sources, we have classified as M-type stars and as C-type stars. This may suggest that our C-type count should be times larger, and our M-type count slightly lower. This would increase the final C/M ratio from to ([Fe/H] dex) in the central kpc.
Of the remaining sources from the catalogue of Letarte et al. (2002) that were not in our AGB catalogue, were identified among the sources that we discarded due to the poorer quality of the photometric data (i.e. sources that were classified as being something other than stellar or probably-stellar in at least one band). Of these sources, have J and K band magnitudes available that allow us to classify as M-type, as C-type stars and one source that falls below the blue limit. From their position on the CMD (Fig. 29), these sources are likely to be real C- or M-type stars, which were discarded from our sample to maintain photometric reliability. If these stars are genuine C-type stars as Letarte et al. (2002) conclude, then our C-star count should be larger than we claim. Taken together with the multiplier above, the criterion we have adopted may misclassify about of C-stars as M-type stars. Making a correction of this magnitude would increase the C/M ratio from to ([Fe/H] dex) in the central kpc. This is based on the crucial assumption that Letarte et al. (2002) have correctly classified all of the sources in their catalogue. In order to verify this assumption spectroscopic data which is not currently available would be needed. On the other hand, the classification by Letarte et al. (2002) is dependent solely on colour and it is possible that there have been a number of misclassifications of objects which are not actually C-type stars.
The final C-type stars found by Letarte et al. (2002), we are unable to account for. As Letarte et al. (2002) studied the central regions where the stellar density is highest, the outstanding stars may have been excluded from our photometric catalogue due to crowding issues.
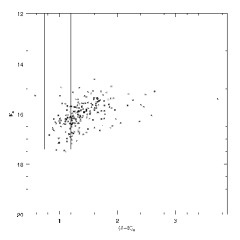
5.4.2 Kang et al. (2006)
Kang et al. (2006) used photometry to identify AGB stars along the bar of NGC 6822. Of these sources, they classified as M-type stars and as C-type stars. They used different criteria for the selection and identification of their AGB population, using the CMD to separate the AGB stars from the MW foreground. Examining our AGB catalogue in the same area we have identified AGB stars: C-type and M-type, i.e. a much lower C/M ratio. The difference of sources detected by ourselves and Kang et al. (2006) is likely due to the stringent conditions we placed on the photometry and selection of our sample.
Cross-matching our AGB catalogue with the catalogue of Kang et al. (2006) we were able to identify stars in common, of which we identified as C-type stars and as M-type, whilst Kang et al. (2006) had identified C-type and M-type stars. Of the remaining sources in the Kang et al. (2006) catalogue that were not identified in our AGB catalogue, were identified among the sources that we discarded as MW foreground, all of which were M-type AGB’s according to Kang et al. (2006). This is not surprising given our findings in Sect. 4.1.2 that the majority of the remaining MW interlopers masquerade as M-type stars not C-type. We suspect therefore that the Kang et al. (2006) M-type AGB stars include many MW interlopers. A further of the sources in the Kang et al. (2006) catalogue were identified among the sources that were discarded from our data set as they were not classified as stellar or probably stellar in all bands. Of these sources there were C-type and M-type stars using our selection criteria ( or magnitudes were not available for of the sources) and C-type and M-type stars using the selection criteria of Kang et al. (2006). The discrepancies in the number of stars of each type found are the result of different colour selection criteria. The CMD of the Kang et al. (2006) sources identified in our discarded sample (Fig. 30) shows that the majority have colours consistent with them being genuine AGB stars or MW interlopers. Forty sources from Kang et al. (2006) were not identified in our data set; of these Kang et al. (2006) identified C-type and M-type stars.
In light of the high number of sources that we have matched with the catalogues of Kang et al. (2006) and Letarte et al. (2002) but that were discarded from our sample due to our strict reliability criteria we have presented Catalogue 3 (Sect. 4.2). Catalogue 3 contains the sources that were identified as stellar or probably-stellar in only two photometric bands, many of these sources are likely to be good AGB candidates as shown in Figures 29 & 30, but were excluded during our initial analysis as we insisted on a stellar or probably-stellar classification in all three photometric bands.
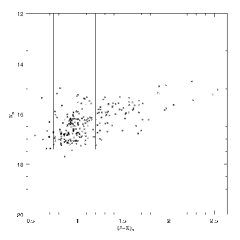
5.4.3 Cioni & Habing (2005)
The catalogue of Cioni & Habing (2005) contains stars detected in the - and -bands in the central of NGC 6822. Without the -band, Cioni & Habing (2005) could not apply the mag foreground rejection method used here. They did attempt to reduce the foreground contamination by selecting only those sources with mag; see Fig. 6 which shows that boundary in the face of our sample, revealing substantial leakage of MW stars into a sample selected in that way. Cioni & Habing (2005) identified C-type and M-type stars. From our AGB catalogue we find AGB stars in the same area: C-type and M-type stars. However, we are unable to make a direct comparison with our AGB catalogue as the poor quality of their astrometry and the high source density in this region prevents a reliable cross-identification between our sources and theirs.
5.5 The future of NIR selection
We have relied on high quality photometry to determine the C/M ratio of NGC 6822. As AGB stars are amongst the coolest and brightest sources in the intermediate age population, the infrared is the most obvious waveband for the selection of these sources. However, this method is at a disadvantage compared to spectroscopic classification methods due to the difficulty of distinguishing between C- and M-type stars less than mag brighter than the TRGB in . Battinelli et al. (2007) comments and we likewise recognise that we are still far from any consistent criteria for the selection of sources. In particular C/M ratios determined from NIR colours will be underestimates due mainly to the contamination of the M-star count from hotter C-type stars and also K-stars if no blue limit is applied. The range in colour limits is often attributed to the metallicity of the different parent galaxies. As discussed above, whilst NIR observations are not greatly affected by reddening they do suffer from uncertainties due to metallicity and age in the population (Salaris & Girardi, 2005).
Both Groenewegen (2006) and Battinelli & Demers (2005) consider selective narrow- and broad-band optical photometry (Cook et al., 1986) to be the best way of selecting C- and M-type stars in large scale surveys in resolved galaxies. In a colour-colour diagram of vs. (or ), carbon- and oxygen-rich stars are clearly separated. However, this technique is also flawed as there is no easy way to eliminate foreground M-dwarfs (Letarte et al., 2002) and it does not identify bluer AGB stars well as they merge with the rest of the stellar population (Battinelli & Demers, 2005). Groenewegen (2006) also notes that a lower limit in (or ) is usually selected to isolate oxygen-rich stars of type M0 or later but that when this same limit is applied to the C-type population it neglects the hotter C-type stars and thereby biases the C/M ratio.
The use of optical bands is also limited by increasing extinction in a way that the infrared is not. However, narrow-band survey data is already available for a number of Local Group galaxies (Groenewegen, 2006). Therefore the most logical course of action would seem to be to use the method of Cook et al. (1986) alongside NIR data in the Local Group to tighten the selection criteria and to gain a better understanding of the effects of age and metallicity on colours. We refer the reader to Groenewegen (2006); Battinelli & Demers (2005); Groenewegen (2006) and references therein for a brief overview of recent surveys of C- and M-type AGB’s in the Local Group and a comparison of selection techniques.
6 Conclusions
High quality photometry of an area of deg2 centred on NGC 6822 has been used to isolate the AGB population and to study the spatial distribution of stars and the C/M ratio as a tracer of metallicity. We have investigated the spread in the TRGB magnitude, the spatial distribution of [Fe/H] as a function of azimuthal angle and radial distance and also the sensitivities of the C/M ratio and abundance to the applied selection criteria.
Our main conclusions are as follows:
-
1.
The colour used for the star-by-star removal of the foreground MW contamination is very valuable but with such heavy foreground contamination as we have in the direction of NGC 6822 further statistical foreground subtraction is required. We have demonstrated the difficulties involved in isolating the M-type AGB population from the MW foreground using only photometric colours and have established the sensitivity of the C/M ratio to the cutoff and a number of other selection criteria.
-
2.
The TRGB magnitude was found at mag. Random statistical scatter in the measurements of the TRGB are to be expected and the range of mag that we detect is within of the mean value. Our measurements suggest that the TRGB magnitude may decline (brighten) as a function of increasing radial distance from the galactic centre, possibly due to the outer population being older.
-
3.
We trace the AGB population out to a radius of kpc from the centre of NGC 6822. Beyond this, genuine NGC 6822 sources cannot be cleanly separated from the heavy MW foreground contamination.
-
4.
The colour boundary between C- and M-type stars has a mean value and standard deviation of mag ( mag), with a spread of mag detected within the AGB population. This is consistent with previous studies of NGC 6822 but we note, in agreement with Battinelli et al. (2007) that this boundary is ill defined and that some misclassification of C- and M-type stars occurs. Due to the sensitivity of the C/M ratio to this criterion, more analysis of spectroscopic data of different metallicity environments is needed to constrain this boundary and gain a better understanding of its dependence on metallicity.
-
5.
The blue limit ( mag) used to isolate M-type AGB stars is also important and can severely affect the determination of the C/M ratio. A clearer, standardised limit for the exclusion of -type contaminants is needed in order to compare C/M ratio determinations from different authors so they can be used to better calibrate the C/M vs. [Fe/H] relation.
-
6.
Within a kpc radius a global [Fe/H] dex was derived from a C/M ratio of , using the relation of Cioni (2009). A spread of dex is found but there is no metallicity gradient present either as a function of radial distance or as a function of angle. The clumpy distribution of the C/M ratio in Fig. 11 is consistent with the findings of other authors (Cioni & Habing, 2005; Kang et al., 2006) and is probably real. Although whether this relates directly to the metallicity of the region is not entirely clear given recent findings concerning the impact of population age of the C/M ratio. A variation in the global [Fe/H] abundance of dex is seen when individual selection parameters are varied, or potential much larger if several are altered at one time (Sect. 5.3.3) and for comparison we note a variation of dex in the global iron abundance when older C/M vs. [Fe/H] relations are used (Sect. 5.3).
-
7.
There is a possible error of in the classification of C-type stars, based on a comparison with the work of Letarte et al. (2002), in the sense that photometrically we misclassify of C-type stars as M-type. Correcting for this would increase our C/M ratio to ([Fe/H] dex). A spectroscopic comparison of the C- and M-type sources identified using optical and NIR photometry, is needed in order to properly constrain the level of error introduced by both methods.
-
8.
The C/M ratio is a useful tool for gaining a broad overview of the metallicity in a distant but resolved galaxy but the correlation between C/M and [Fe/H] is not tight, especially at lower metallicities, as demonstrated by Fig. B.1 of Cioni (2009), Fig. 3 of Battinelli & Demers (2005) and Fig. 4 of Groenewegen (2006). An improved calibration of the C/M vs. [Fe/H] relation is required, as is a better understanding of the other factors that affect the C/M ratio such as the age of the population and the effects of foreground contamination and differential reddening. For instance Feast et al. (2010) conclude that a decline in the C/M ratio at greater radial distances is more likely to be the result of the increasing age of the population, and the resulting decline in the number of C-type stars, rather than an increase in the population metallicity. As mentioned in Sect. 4.4.1, Held et al. (2010) also note the importance of the population age in the interpretation of the C/M ratio. We expect that the age (mass) dependence of C-type star formation will become increasingly important in future endeavors to better constrain the C/M vs. [Fe/H] relation and must therefore be taken into account during the interpretation of any results.
With a better calibration and more uniform treatment of the C/M ratio (in the optical and IR) over a range of metallicities and the use of spectroscopic indicators, the C/M ratio has the potential to be a more powerful tool for the study of metallicity gradients in galaxies that can be resolved into stars.
Acknowledgements.
We would like to thank M. Rejkuba of ESO and many colleagues at the University of Hertfordshire for useful discussions. We would also like to extend our thanks to the referee for providing a helpful and insightful report which has improved this work.References
- Baldacci et al. (2004) Baldacci, L., Rizzi, L., Clementini, G., & Held, E. V. 2004, in Astronomical Society of the Pacific Conference Series, Vol. 310, IAU Colloq. 193: Variable Stars in the Local Group, ed. D. W. Kurtz & K. R. Pollard, 91
- Battinelli & Demers (2005) Battinelli, P. & Demers, S. 2005, A&A, 434, 657
- Battinelli et al. (2006) Battinelli, P., Demers, S., & Kunkel, W. E. 2006, A&A, 451, 99
- Battinelli et al. (2007) Battinelli, P., Demers, S., & Mannucci, F. 2007, A&A, 474, 35
- Bellazzini et al. (2002) Bellazzini, M., Ferraro, F. R., Origlia, L., et al. 2002, AJ, 124, 3222
- Bessell & Brett (1988) Bessell, M. S. & Brett, J. M. 1988, PASP, 100, 1134
- Blanco et al. (1978) Blanco, B. M., Blanco, V. M., & McCarthy, M. F. 1978, Nature, 271, 638
- Bland-Hawthorn et al. (2005) Bland-Hawthorn, J., Vlajić, M., Freeman, K. C., & Draine, B. T. 2005, ApJ, 629, 239
- Casali et al. (2001) Casali, M., Lunney, D., Henry, D., et al. 2001, in Astronomical Society of the Pacific Conference Series, Vol. 232, The New Era of Wide Field Astronomy, ed. R. Clowes, A. Adamson, & G. Bromage, 357
- Cioni (2009) Cioni, M. 2009, A&A, 506, 1137
- Cioni & Habing (2003) Cioni, M. & Habing, H. J. 2003, A&A, 402, 133
- Cioni & Habing (2005) Cioni, M. & Habing, H. J. 2005, A&A, 429, 837
- Cioni et al. (2000a) Cioni, M., van der Marel, R. P., Loup, C., & Habing, H. J. 2000a, A&A, 359, 601
- Cioni et al. (2006) Cioni, M.-R. L., Girardi, L., Marigo, P., & Habing, H. J. 2006, A&A, 448, 77
- Cioni et al. (2000b) Cioni, M.-R. L., Habing, H. J., & Israel, F. P. 2000b, A&A, 358, 9
- Clementini et al. (2003) Clementini, G., Held, E. V., Baldacci, L., & Rizzi, L. 2003, ApJ, 588, 85
- Cook et al. (1986) Cook, K. H., Aaronson, M., & Norris, J. 1986, ApJ, 305, 634
- Davidge (2003) Davidge, T. J. 2003, PASP, 115, 635
- de Blok & Walter (2000a) de Blok, W. J. G. & Walter, F. 2000a, ApJ, 537, 95
- de Blok & Walter (2000b) de Blok, W. J. G. & Walter, F. 2000b, in Astronomical Society of the Pacific Conference Series, Vol. 218, Mapping the Hidden Universe: The Universe behind the Mily Way - The Universe in HI, ed. R. C. Kraan-Korteweg, P. A. Henning, & H. Andernach, 357
- de Blok & Walter (2006) de Blok, W. J. G. & Walter, F. 2006, AJ, 131, 343
- Demers et al. (2006) Demers, S., Battinelli, P., & Artigau, E. 2006, A&A, 456, 905
- Demers et al. (2004) Demers, S., Battinelli, P., & Letarte, B. 2004, A&A, 424, 125
- Feast et al. (2010) Feast, M. W., Abedigamba, O. P., & Whitelock, P. A. 2010, MNRAS, 129
- Gallart et al. (1996) Gallart, C., Aparicio, A., & Vilchez, J. M. 1996, AJ, 112, 1928
- Gieren et al. (2006) Gieren, W., Pietrzyński, G., Nalewajko, K., et al. 2006, ApJ, 647, 1056
- Girardi et al. (2005) Girardi, L., Groenewegen, M. A. T., Hatziminaoglou, E., & da Costa, L. 2005, A&A, 436, 895
- González-Solares et al. (2008) González-Solares, E. A., Walton, N. A., Greimel, R., et al. 2008, MNRAS, 388, 89
- Górski et al. (2011) Górski, M., Pietrzyński, G., & Gieren, W. 2011, AJ, 141, 194
- Groenewegen (2006) Groenewegen, M. A. T. 2006, in Planetary Nebulae Beyond the Milky Way, ed. L. Stanghellini, J. R. Walsh, & N. G. Douglas, 108
- Gullieuszik et al. (2008) Gullieuszik, M., Held, E. V., Rizzi, L., et al. 2008, MNRAS, 388, 1185
- Held et al. (2010) Held, E. V., Gullieuszik, M., Rizzi, L., et al. 2010, MNRAS, 431
- Hernández-Martínez et al. (2009) Hernández-Martínez, L., Peña, M., Carigi, L., & García-Rojas, J. 2009, A&A, 505, 1027
- Hodge et al. (1991) Hodge, P., Smith, T., Eskridge, P., MacGillivray, H., & Beard, S. 1991, ApJ, 379, 621
- Hodge (1977) Hodge, P. W. 1977, ApJS, 33, 69
- Hodgkin et al. (2009) Hodgkin, S. T., Irwin, M. J., Hewett, P. C., & Warren, S. J. 2009, MNRAS, 394, 675
- Hwang et al. (2011) Hwang, N., Lee, M. G., Lee, J. C., et al. 2011, ApJ, 738, 58
- Iben & Renzini (1983) Iben, Jr., I. & Renzini, A. 1983, ARA&A, 21, 271
- Irwin et al. (2005) Irwin, M. J., Ferguson, A. M. N., Ibata, R. A., Lewis, G. F., & Tanvir, N. R. 2005, ApJ, 628, 105
- Irwin et al. (2004) Irwin, M. J., Lewis, J., Hodgkin, S., et al. 2004, in Society of Photo-Optical Instrumentation Engineers (SPIE) Conference Series, ed. P. J. Quinn & A. Bridger, Vol. 5493, 411–422
- Kacharov et al. (2012) Kacharov, N., Rejkuba, M., & Cioni, M.-R. L. 2012, A&A, 537, 108
- Kang et al. (2006) Kang, A., Sohn, Y., Kim, H., et al. 2006, A&A, 454, 717
- Karakas (2003) Karakas, A. I. 2003, PhD thesis, Univ.Aust,(2003)
- Karakas (2011) Karakas, A. I. 2011, in Asymmetric Planetary Nebulae 5 Conference
- Karampelas et al. (2009) Karampelas, A., Dapergolas, A., Kontizas, E., et al. 2009, A&A, 497, 703
- Komiyama et al. (2003) Komiyama, Y., Okamura, S., Yagi, M., et al. 2003, ApJ, 590, 17
- Lee et al. (1993) Lee, M. G., Freedman, W. L., & Madore, B. F. 1993, ApJ, 417, 553
- Lee & Hwang (2005) Lee, M. G. & Hwang, N. 2005, in IAU Colloq. 198: Near-fields cosmology with dwarf elliptical galaxies, ed. H. Jerjen & B. Binggeli, 181–184
- Letarte et al. (2002) Letarte, B., Demers, S., Battinelli, P., & Kunkel, W. E. 2002, AJ, 123, 832
- Madore & Freedman (1995) Madore, B. F. & Freedman, W. L. 1995, AJ, 109, 1645
- Maeder et al. (1999) Maeder, A., Grebel, E. K., & Mermilliod, J.-C. 1999, A&A, 346, 459
- Marigo (2007) Marigo, P. 2007, A&A, 467, 1139
- Marigo et al. (1999) Marigo, P., Girardi, L., & Bressan, A. 1999, A&A, 344, 123
- Marigo et al. (2003) Marigo, P., Girardi, L., & Chiosi, C. 2003, A&A, 403, 225
- Massey et al. (1995) Massey, P., Armandroff, T. E., Pyke, R., Patel, K., & Wilson, C. D. 1995, AJ, 110, 2715
- Mateo (1998) Mateo, M. L. 1998, ARA&A, 36, 435
- Minniti et al. (2003) Minniti, D., Borissova, J., Rejkuba, M., et al. 2003, Science, 301, 1508
- Mouhcine et al. (2005) Mouhcine, M., Ferguson, H. C., Rich, R. M., Brown, T. M., & Smith, T. E. 2005, ApJ, 633, 810
- Mouhcine & Lançon (2003) Mouhcine, M. & Lançon, A. 2003, MNRAS, 338, 572
- Nikolaev & Weinberg (2000) Nikolaev, S. & Weinberg, M. D. 2000, ApJ, 542, 804
- Roberts (1972) Roberts, M. S. 1972, in IAU Symposium, Vol. 44, External Galaxies and Quasi-Stellar Objects, ed. D. S. Evans, D. Wills, & B. J. Wills, 12
- Ryan & Norris (1991) Ryan, S. G. & Norris, J. E. 1991, AJ, 101, 1865
- Sakai et al. (1996) Sakai, S., Madore, B. F., & Freedman, W. L. 1996, ApJ, 461, 713
- Salaris & Girardi (2005) Salaris, M. & Girardi, L. 2005, MNRAS, 357, 669
- Schlegel et al. (1998) Schlegel, D. J., Finkbeiner, D. P., & Davis, M. 1998, ApJ, 500, 525
- Stancliffe et al. (2005) Stancliffe, R. J., Izzard, R. G., & Tout, C. A. 2005, MNRAS, 356, 1
- Stinson et al. (2009) Stinson, G. S., Dalcanton, J. J., Quinn, T., et al. 2009, MNRAS, 395, 1455
- Tolstoy et al. (2001) Tolstoy, E., Irwin, M. J., Cole, A. A., et al. 2001, MNRAS, 327, 918
- Vansevičius et al. (2004) Vansevičius, V., Arimoto, N., Hasegawa, T., et al. 2004, ApJ, 611, 93
- Venn et al. (2001) Venn, K. A., Lennon, D. J., Kaufer, A., et al. 2001, ApJ, 547, 765
- Ventura & Marigo (2010) Ventura, P. & Marigo, P. 2010, MNRAS, 408, 2476
- Weldrake et al. (2003) Weldrake, D. T. F., de Blok, W. J. G., & Walter, F. 2003, MNRAS, 340, 12
- Zijlstra et al. (2006) Zijlstra, A. A., Matsuura, M., Wood, P. R., et al. 2006, MNRAS, 370, 1961