Structural, elastic and thermal properties of cementite (Fe3C) calculated using Modified Embedded Atom Method
Abstract
Structural, elastic and thermal properties of cementite (Fe3C) were studied using a Modified Embedded Atom Method (MEAM) potential for iron-carbon (Fe–C) alloys. Previously developed Fe and C single element potentials were used to develop a Fe–C alloy MEAM potential, using a statistically-based optimization scheme to reproduce structural and elastic properties of cementite, the interstitial energies of C in bcc Fe as well as heat of formation of Fe–C alloys in L12 and B1 structures. The stability of cementite was investigated by molecular dynamics simulations at high temperatures. The nine single crystal elastic constants for cementite were obtained by computing total energies for strained cells. Polycrystalline elastic moduli for cementite were calculated from the single crystal elastic constants of cementite. The formation energies of (001), (010), and (100) surfaces of cementite were also calculated. The melting temperature and the variation of specific heat and volume with respect to temperature were investigated by performing a two-phase (solid/liquid) molecular dynamics simulation of cementite. The predictions of the potential are in good agreement with first-principles calculations and experiments.
pacs:
61.50.Lt, 62.20.de, 61.72.jj, 68.35.Md, 71.15.PdI Introduction
Steel alloys are the most widely used structural materials due to their abundance, all-purpose applicability and low cost. The main carbide in steel alloys is cementite, which forms a precipitate. Cementite has a direct impact on the mechanical, structural, and thermal properties of steel. Therefore the ability to describe and predict properties of cementite at the nanoscale is essential in the study and design of new steels. Atomistic simulation methods, such as molecular dynamics or Monte Carlo simulations, offer an efficient and reliable route to investigate nanoscale mechanics pertaining to cementite in steel alloys. Each of these methods requires accurate interatomic potentials to find the energy of the system under investigation. However, first-principles calculations–albeit rigorous and accurate–are incapable of simulating a large number of atoms required for realistic calculations due to unreasonable memory and processing-time requirements. Therefore, semi-empirical potential methods are being explored as a suitable alternative.
Among the spectrum of semi-empirical formulations, the Modified Embedded Atom Method (MEAM)Baskes (1992), originally proposed by Baskes et al., has been shown to accurately predict properties of most crystal structures, such as bcc, fcc, hcp, and even diatomic gases, in good agreement with experiments or first-principles calculations. MEAM is extended from the Embedded Atom Method (EAM)Daw and Baskes (1984) to include the directionality of bonds. In the original MEAM formalism, only the first-nearest neighbor (1NN) interactions were considered.Baskes (1992) Lee and Baskes later extended the original formalism to include the screened second-nearest neighbor (2NN) interactions.Lee et al. (2001) Further details of the MEAM formalism can be found in Ref. Baskes, 1992; Lee et al., 2001.
One of the commonly used 2NN MEAM potentials for the Fe–C system developed by Byeong-Joo Lee Lee (2006) is designed to predict the interactions of interstitial C atoms with defects, such as vacancies. According to Fang et al.,Fang et al. (2012) Lee’s potential predicts that cementite is only stable up to a temperature of 750 K.Fang et al. (2012) Experimentally, however, cementite is metastable with a positive heat of formation Meschel and Kleppa (1997) and only decomposes between 1100 and 1200 K.Callister and Rethwisch (2007); Henriksson and Nordlund (2009) Among recent interatomic potentials Becquart et al. (2007); Lau et al. (2007); Hepburn and Ackland (2008); Ruda et al. (2009); Henriksson and Nordlund (2009) for the Fe–C system, EAM potentials by Lau et al. Lau et al. (2007) and Ruda et al. Ruda et al. (2009) and the short ranged Tersoff-Brenner type analytical bond order potential (ABOP) by Henriksson et al. Henriksson and Nordlund (2009) all promise to predict properties of cementite reasonably well. In the potentials by Lau et al. Lau et al. (2007) and Ruda et al.,Ruda et al. (2009) however, the single element potential for C does not predict properties of both graphite and diamond well. This is due to the limited ability of EAM to describe the bare C-C interaction correctly.Duff and Sluiter (2010) We note that a successful interatomic potential for an alloy system should not only predict the properties of the alloy correctly, but it should also predict the properties of the individual alloying elements in their natural crystal structures accurately. The ABOP by Henriksson et al. Henriksson and Nordlund (2009) accurately predicts properties of cementite as well as Fe and C; however, ABOPs are not applicable to simulations involving interfaces and surfaces.Erhart et al. (2006) Furthermore ABOPs are restricted to 1NN interactions only.Erhart et al. (2006); Albe et al. (2002) Some of the more recent potentials for the Fe–C system are implemented using in-house developed molecular dynamics codes, which limits the potentials’ usability by a wide scientific community.
In the present work, we developed a 2NN MEAM potential for the Fe–C alloy system that predicts the structure and properties of cementite. Our Fe–C alloy potential is based on previously developed 2NN MEAM potentials for Fe Lee et al. (2012) and C Uddin et al. (2010) in their pure forms. The C MEAM potential predicts both diamond and graphite as stable structures with almost degenerate energies. Using the Fe and C single element potentials, we arrived at the best possible parameterization of the alloy potential of Fe–C for the purposes specified by the objective function which takes into account the various properties of Fe–C alloys.
II Methods
II.1 MEAM Calculations
For all atomistic simulations described in the present work, we used MEAM as implemented in LAMMPS, the classical molecular dynamics simulation code from Sandia National Laboratories.Plimpton (1995); Plimpton et al. To compare the results of the current potential with published potentials of Refs. Ruda et al., 2009 and Henriksson and Nordlund, 2009 we used the published data. For an extensive comparison of all properties of cementite with Lee’s potentialLee (2006) we obtained the LAMMPS version of the potential from the author and conducted our own calculations using LAMMPS.
II.2 DFT calculations
Some of the reference data required for potential construction and validation are not readily available from experiments. With respect to the Fe–C system these include the heat of formation of Fe–C in the structure, the heat of formation of Fe–C in the structure and the interstitial energies of C in the bcc Fe lattice at octahedral and tetrahedral positions. To obtain these properties, we performed first-principles calculations using Density Functional Theory (DFT)Kresse and Hafner (1993); Kresse and Furthmüller (1996) with Projector Augmented Wave (PAW) pseudopotentials.Kresse and Joubert (1999) Electron exchange and correlation were treated with the Generalized Gradient Approximation (GGA) as parameterized by Perdew et al. Perdew et al. (1996) Brillouin zone sampling was performed using the Monkhorst-Pack scheme,Monkhorst and Pack (1976) with a Fermi-level smearing of 0.2 eV applied using the Methfessel-Paxton method.Methfessel and Paxton (1989) Geometric optimizations were carried out using the conjugate gradient minimization method.Kresse and Hafner (1993)
III Single Element Potentials
The single element MEAM potential parameters used in the present work are presented in Table 1. The parameters for Fe are from the MEAM potential developed by Lee et al.,Lee et al. (2012) and the parameters for C are from Uddin et al. Uddin et al. (2010)
| Element | |||||||||||||||||
|---|---|---|---|---|---|---|---|---|---|---|---|---|---|---|---|---|---|
| Fe | 4.28 | 2.469 | 4.5 | 0.585 | 5.027 | 0.3 | 1.0 | 3.8 | 2.0 | 0.9 | 0.0 | 1.0 | 12.3 | 2.0 | 1.9 | 2.8 | |
| C | 7.37 | 1.545 | 4.5 | 1.49 | 4.38 | 0.0 | 1.0 | 4.26 | 5.0 | 3.2 | 3.98 | 1.0 | 7.5 | 1.04 | 0.68 | 2.0 |
III.0.1 Energy vs. volume curves
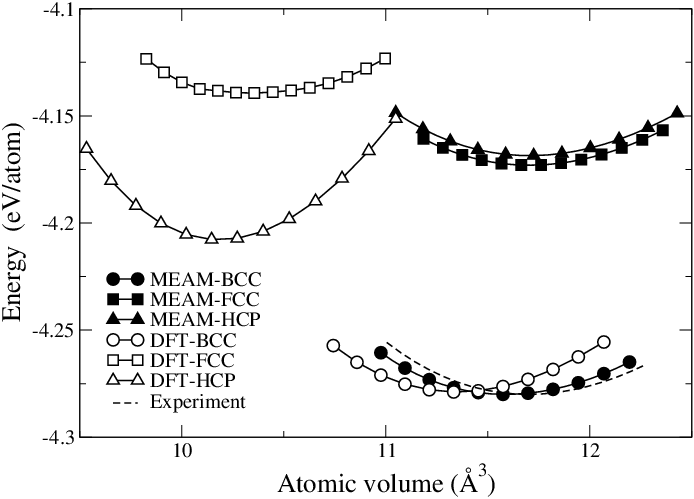
Energy variation with respect to volume or nearest neighbor distance is considered an important test of validity for interatomic potentials. Here we present the energy vs. volume curves generated by the single element potential for Fe and energy vs. nearest neighbor distance curves generated by the single element potential for C. Fig. 1 shows the energy vs. volume curve for bcc Fe in comparison with curves generated by DFT calculations as well as using experimental data. It is well known that DFT overestimates the cohesive energy.Philipsen and Baerends (1996) Therefore, the DFT curve is shifted vertically by a constant amount to the experimental cohesive energy at the equilibrium volume to aid the comparison of the curves. Due to overbinding, the DFT’s prediction for the equilibrium volume is underestimated.Devey and de Leeuw (2010) Therefore, the DFT curve sits to the left of the experimental curve. The experimental curve was generated through Rose’s equation of state Rose et al. (1984) (Eq. (1)) using the experimental bulk modulus, cohesive energy, and atomic volume at equilibrium listed in Table 2. We also tested the stability of Fe in several different crystal structures including body-centered cubic (bcc), face-centered cubic (fcc) and hexagonal closed packed (hcp) structures as shown in Fig. 1. The Fe MEAM potential correctly predicts that bcc is the most stable structure, as observed in experiment and by the first-principles methods. MEAM predicts that fcc and hcp Fe are much closer in energy and have a larger volume than that calculated from DFT.
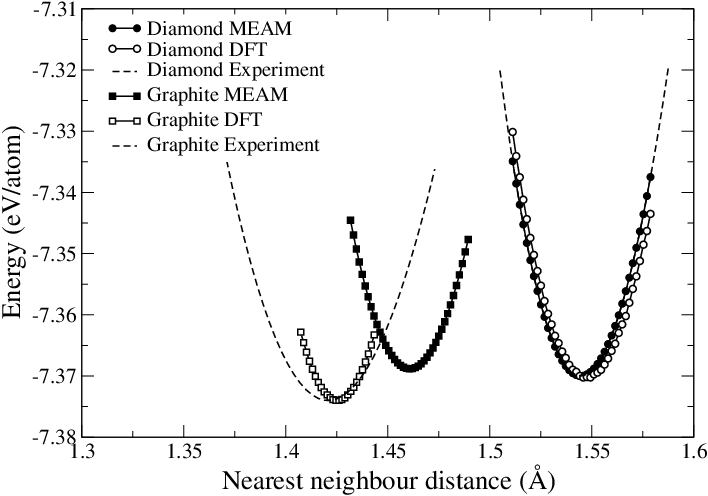
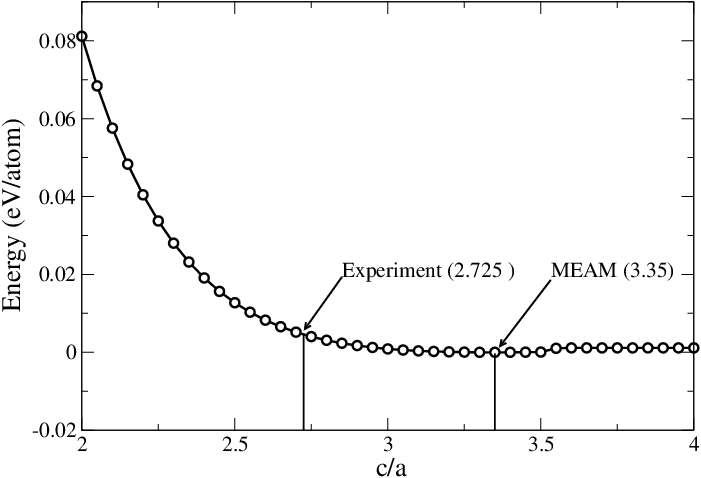
The single-element MEAM potential for C predicts both diamond and graphite to be stable structures. Energy vs. nearest neighbor distance curves for diamond and graphite are shown in Fig. 2. The experimental curves were constructed from Rose’s equation of state Rose et al. (1984) (Eq. (1)) using the experimental bulk modulus, cohesive energy, and nearest neighbor distance at equilibrium, as listed in Table 2. MEAM predictions for diamond are in good agreement with experiment. MEAM predicts almost degenerate cohesive energies for graphite and diamond, while DFT predicts graphite to be 0.1 eV more stable than diamond. For graphite, DFT predicts a first-nearest neighbor (1NN) distance in good agreement with experiment, while MEAM predicts a 1NN distance 3% greater than the experimental value. The experimental ratio between lattice parameters and in graphite (hereafter referred as ratio) is 2.725.Yin and Cohen (1984) MEAM optimized the ratio of the graphite structure to 3.35. The disagreement between experimental and MEAM values for ratio is due to the incorrect prediction of interlayer interaction of graphite, which is dominated by van der Waals forces that are not described by MEAM. However, the dependence of cohesive energy on the ratio is small. Fig. 3 shows the change in energy as is varied while keeping at the MEAM optimized value. According to Fig. 3, the difference in cohesive energy of graphite between the experimental and MEAM ratio is 4 meV/atom. In constructing the energy vs. nearest neighbor distance curves for graphite, the inter-planar distance was scaled with the lattice constant. The experimental ratio was used in the generation of the DFT curve, while the MEAM curve was constructed with the predicted ratio.
III.0.2 Single element material properties
The cohesive energy, equilibrium lattice constants, and bulk moduli for bcc Fe, graphite, and diamond were determined by fitting Rose’s equation of state Rose et al. (1984)
| (1) | ||||
| (2) | ||||
| (3) |
to the energy vs. nearest neighbor distance/volume curves generated by MEAM. is the equilibrium nearest neighbor distance, is the cohesive energy, is the bulk modulus, is the equilibrium atomic volume and is the coefficient of the cubic term. is set to zero when fitting to energy vs. nearest neighbor distance/volume curves generated by MEAM. The single element material properties compared to experimental values are given in Table 2.
| Property | bcc Fe | diamond | graphite |
|---|---|---|---|
| (111Ref. Kittel, 1986 as reported by Lee et al. Lee et al. (2012)) | (333Refs. Donohue, 1982; McSkimin et al., 1972 as reported by Fahy et al. Fahy and Louie (1987)) | (444Refs. Orson and Anderson, 1966; Murnaghan, 1944 as reported by Yin et al. Yin and Cohen (1984)) | |
| 175 (166-173222As reported by Lee et al. Lee et al. (2012)) | 443 (443333Refs. Donohue, 1982; McSkimin et al., 1972 as reported by Fahy et al. Fahy and Louie (1987)) | 176 (286444Refs. Orson and Anderson, 1966; Murnaghan, 1944 as reported by Yin et al. Yin and Cohen (1984)) | |
| 2.86 (2.86222As reported by Lee et al. Lee et al. (2012)) | 3.567 (3.567333Refs. Donohue, 1982; McSkimin et al., 1972 as reported by Fahy et al. Fahy and Louie (1987)) | 2.53 (2.461444Refs. Orson and Anderson, 1966; Murnaghan, 1944 as reported by Yin et al. Yin and Cohen (1984)) | |
| — | — | 8.476 (6.709444Refs. Orson and Anderson, 1966; Murnaghan, 1944 as reported by Yin et al. Yin and Cohen (1984)) | |
| 11.64 (11.70) | 5.67 (5.67) | 11.75 (8.80) |
IV Construction of Fe–C Alloy Potential
Table 3 lists the parameters in the 2NN MEAM potential for Fe–C alloy system optimized by following the general framework developed by Tschopp et al. Tschopp et al. (2012) The framework consists of two stages. The first stage, called the Global Approach (GA), is a coarse refinement of the parameter space of the MEAM potential, which initializes the MEAM potential parameters and performs a sensitivity analysis for the parameters. The second stage, called the Local Approach (LA), evaluates the sensitive parameters sampling the parameter space with a stratified sampling method and generates analytical models for design optimization of the potential.
In the GA stage, a coarse refinement of the parameter space is performed using a partial set of the properties in the objective function including: the heats of formation of cementite, Fe3C in structure and FeC in structure, and the interstitial energies of C in the bcc Fe lattice at octahedral and tetrahedral positions. The potential parameters were initialized as specified by the MEAM formulation.Baskes (1992); Lee et al. (2001) defined by Eq. (3) and (equilibrium nearest neighbor distance) are determined by the reference structure properties. For the present case, FeC in structure is used as the reference structure and the values predicted by DFT are used to set and since experimental values are not available for this hypothetical structure. Parameters and remain unchanged throughout the optimization process since they are defined by the MEAM formulation. Next, a sensitivity analysis was performed to evaluate the influence of each parameter on the properties. This step helps identify parameters with the most significant effect on the selected target properties of the Fe–C system. By identifying the parameters that have the most influence on the properties of the Fe–C system we are able to reduce the number of parameters to be included in the later stages. For the present case, the GA stage identified five parameters—, , (C), (Fe,Fe,C), and (C,C,Fe)—to be sufficiently sensitive to be further explored in the LA stage of the optimization. Parameters that are deemed insensitive are fixed at the default values recommended in the MEAM formulation.
| Parameter | Value |
|---|---|
| 0.002 | |
| 1.92 | |
| 4.5 | |
| 4.75 | |
| 0.125 | |
| (Fe) | 1.0 |
| (C) | 5.49 |
| (Fe,Fe,C) | 2.8 |
| (Fe,C,C) | 2.8 |
| (Fe,C,Fe) | 2.8 |
| (C,C,Fe) | 2.8 |
| (Fe,Fe,C) | 0.06 |
| (Fe,C,C) | 2.0 |
| (Fe,C,Fe) | 2.0 |
| (C,C,Fe) | 0.5 |
The LA stage of the potential optimization procedure involves sampling the bounded potential parameter space, generating analytical models that represent the nonlinear correlations between the potential parameters, and using an objective function to converge on the required parameterization of the potential. A stratified random sampling method known as Latin Hypercube Sampling (LHS) McKay et al. (2000) was used to sample the potential parameter space with 4000 different potential parameter combinations. The set of properties chosen for the Fe–C system are calculated for each parameter combination. This is the most computationally-intensive step of the potential fitting process. Using the data from the parameter space sampling step, analytical models representing the relationship between potential parameters and the selected target properties are generated. This is done by fitting higher-order polynomial regression models to the sampled data. The analytical models represent a response surface for the sensitive potential parameters. At this stage of the optimization an objective function representing all of the interested properties of the Fe–C system is introduced. The objective function is constructed by combining the weighted differences between the MEAM predicted values and the target values of the chosen properties. Target values are set to experimental values when available or DFT values otherwise. Then a constrained nonlinear optimization procedure is used to evaluate the analytical models by minimizing the objective function.
The properties included in the objective function are the properties of cementite (equilibrium lattice parameters and volume, heat of formation, elastic constants, and surface formation energies); properties of Fe3C in structure (heat of formation and equilibrium volume); properties of FeC in structure (heat of formation, equilibrium volume and elastic constants) and interstitial defect energies of C in the bcc Fe lattice at octahedral and tetrahedral positions. The weighting factors of the objective function balance the trade-offs in potential optimization. The purpose of the present work is to model the properties of cementite while reproducing the Fe–C alloy system properties to an acceptable accuracy. This is realized by choosing weighting factors in a way that cementite properties were prioritized first, then the interstitial defect energies, and then the properties of hypothetical structures and . By varying the weights, the objective function is changed and the constrained nonlinear optimization procedure can traverse the response surface represented by the analytical models to obtain a final set of potential parameters. For each set of weighting factors a potential is generated. By using a matrix of weighting factors with the required prioritization of the target properties, we were able to minimize the objective function and arrive at the set of optimal potential parameters in Table 3. The optimized potential is then validated by predicting material properties that were not used in the optimization procedure. We used the melting temperature of cementite to validate the potential and its prediction is explained in Sec. VIII. Table 4 shows the material properties predicted by the present MEAM potential compared with DFT/experimental data and the values from other existing potentials.
| Properties | DFT/Expt. | MEAM | LeeLee (2006) | RudaRuda et al. (2009) | HenrikssonHenriksson and Nordlund (2009) | |
|---|---|---|---|---|---|---|
| Cementite | ||||||
| (eV/atom) | 0.01 (0.05111Meschel et al. Meschel and Kleppa (1997)) | 0.06 | 0.02999B.-J Lee Lee (2006),-0.015101010Fang et al. Fang et al. (2012) | 0.18 | 0.03 | |
| () | 9.56222Shein et al. Shein et al. (2006) (9.67121212Wood et al. Wood et al. (2004) as cited by Shein et al. Shein et al. (2006)) | 9.49 | 9.50 | 9.11 | 9.33 | |
| Lattice parameters () | ||||||
| 5.06222Shein et al. Shein et al. (2006) (5.08121212Wood et al. Wood et al. (2004) as cited by Shein et al. Shein et al. (2006)) | 5.05 | 5.16 | 5.14 | 5.09 | ||
| 6.70222Shein et al. Shein et al. (2006) (6.73121212Wood et al. Wood et al. (2004) as cited by Shein et al. Shein et al. (2006)) | 6.69 | 6.32 | 6.52 | 6.52 | ||
| 4.51222Shein et al. Shein et al. (2006) (4.52121212Wood et al. Wood et al. (2004) as cited by Shein et al. Shein et al. (2006)) | 4.49 | 4.66 | 4.35 | 4.50 | ||
| Elastic constants (GPa) | ||||||
| 388333Data from relaxed calculations done by Jiang et al. Jiang et al. (2008) | 322 | 263 | 363 | |||
| 345333Data from relaxed calculations done by Jiang et al. Jiang et al. (2008) | 232 | 219 | 406 | |||
| 322333Data from relaxed calculations done by Jiang et al. Jiang et al. (2008) | 326 | 247 | 388 | |||
| 156333Data from relaxed calculations done by Jiang et al. Jiang et al. (2008) | 137 | 176 | 181 | |||
| 162333Data from relaxed calculations done by Jiang et al. Jiang et al. (2008) | 118 | 143 | 130 | |||
| 164333Data from relaxed calculations done by Jiang et al. Jiang et al. (2008) | 170 | 146 | 166 | |||
| 15333Data from relaxed calculations done by Jiang et al. Jiang et al. (2008) | 17 | 77 | 91 | |||
| 134333Data from relaxed calculations done by Jiang et al. Jiang et al. (2008) | 103 | 95 | 125 | |||
| 134333Data from relaxed calculations done by Jiang et al. Jiang et al. (2008) | 64 | 123 | 134 | |||
| Polycrystalline moduli | ||||||
| (GPa) | 224 (174444Li et al. Li et al. (2002)) | 188 | 183 | 234 | ||
| (GPa) | 72 (74555Laszlo et al. Laszlo and Nolle (1959)) | 56 | 69 | 114 | ||
| (GPa) | 194 (177666Mizubayashi et al. Mizubayashi et al. (1999), 196777Umemoto et al. Umemoto et al. (2001),200555Laszlo et al. Laszlo and Nolle (1959)) | 153 | 184 | 293 | ||
| 0.36 (0.36555Laszlo et al. Laszlo and Nolle (1959)) | 0.36 | 0.33 | 0.29 | |||
| Surface energies (J/m2) | ||||||
| 2.05888Chiou et al. Chiou (2003) | 2.05 | 1.96 | ||||
| 2.26888Chiou et al. Chiou (2003) | 1.80 | 2.00 | ||||
| 2.47888Chiou et al. Chiou (2003) | 2.01 | 2.34 | ||||
| Interstitial Energies (eV) | ||||||
| 2.14 | 1.76 | 2.08 | 1.50 | |||
| 1.25 | 1.55 | 1.81 | 1.18 | |||
| Hypothetical structures | ||||||
| (eV/atom) | 0.53 | 0.002 | ||||
| () | 7.97 | 7.08 | 8.49 | |||
| (eV/atom) | 0.72 | 0.66 | ||||
| () | 10.27 | 10.05 | ||||
| elastic constants (GPa) | ||||||
| 601 | 566 | 550111111Private communication with B.-J. Lee | ||||
| 589 | 213 | 228111111Private communication with B.-J. Lee | ||||
| 83 | 145 | 33111111Private communication with B.-J. Lee |
V Structural and Elastic Properties of Cementite
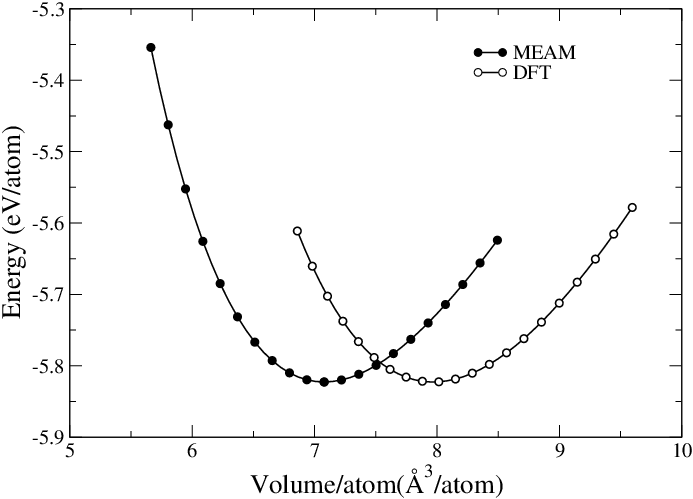
Structural properties of cementite including the equilibrium lattice parameters, the equilibrium volume per atom, and the heat of formation are presented in Table 4 with comparison to DFT/experiment, and other interatomic potentials. Our prediction of the heat of formation of cementite is in good agreement with DFT and experimental data. Lee’s and Henriksson’s potentials also predict values in good agreement with DFT and experiment, while Ruda’s potential predicts a much larger value. Lattice constants of the present MEAM and literature potentials Lee (2006); Ruda et al. (2009); Henriksson and Nordlund (2009) agree well with experiment, while DFT predicts lower values. As a test of validity, the variation of cohesive energy with volume was calculated. Fig. 4 compares the energy vs. volume curves for cementite generated by the present MEAM potential with DFT and experimental curves. During volume variation of cementite, the ratios between , and lattice parameters were held constant. As noted before, DFT overestimates the cohesive energy and underestimates the equilibrium volume. Therefore, the DFT curve sits to the left of the experimental curve, and it is shifted vertically to the experimental cohesive energy at the equilibrium volume to aid the comparison. The experimental curve was generated by Murnaghan’s equation of stateMurnaghan (1944, 1967)
| (4) |
with the experimental bulk modulus Li et al. (2002), it’s derivative Li et al. (2002), volume Umemoto et al. (2001), and cohesive energy .Meschel and Kleppa (1997) The experimental single-crystal bulk modulus of cementite has not yet been determined; therefore, the polycrystalline bulk modulus of cementite was used to generate the experimental curve.
V.1 Single-Crystal Elastic Properties
The elastic moduli of cementite were calculated and compared to DFT and the interatomic potentials by Ruda et al.,Ruda et al. (2009) and Henriksson et al. Henriksson and Nordlund (2009) as presented in Table 4. They were calculated using the deformation matrix presented in Jiang et al. Jiang et al. (2008) In linear elastic theory, deformation energy is a function of strain. Distortion energies () calculated for strains () equal to % were fitted to . DFT calculations were performed for %.Jiang et al. (2008) The single-crystal elastic constants were obtained using the relationships for the quadratic coefficient listed in Jiang et al. Jiang et al. (2008) These results show that the present MEAM potential for Fe–C alloy predicts cementite to be stable (positive elastic constants) and their values are reasonably close to those predicted by DFT. Specifically, the present MEAM potential reproduces the low value of reported by DFT, which none of the other interatomic potentials were able to do (MEAM of 17 GPa vs DFT 15 GPa).
V.2 Polycrystalline Elastic Properties
Theoretical upper and lower bounds for the polycrystalline bulk modulus () and shear modulus () were calculated using the single-crystal elastic constants according to methods by Reuss and Voigt.Panda and Chandran (2006); Jiang et al. (2008) The polycrystalline and were then estimated using Hill’s average.Hill (1952); Jiang et al. (2008) Young’s modulus () and Poisson’s ratio () were calculated by using:Jiang et al. (2008)
| (5) | |||
| (6) |
Polycrystalline elastic moduli predicted by the present MEAM potential are presented in Table 4, in comparison with DFT, experiment, and interatomic potentials by Ruda et al.,Ruda et al. (2009) and Henriksson et al. Henriksson and Nordlund (2009) The elastic constants predicted by DFT are in good agreement with experiment. The present MEAM potential gives the best agreement with experiment among the three interatomic potentials for and ; the present MEAM predicts the value equal to the experimental value. Ruda’s potential predicts the best agreement with experiment for and .
V.3 Surface Energies
Calculations were performed on (001), (010), and (100) surfaces to determine the surface formation energy. Table 4 compares the surface formation energies of the present MEAM to DFT Chiou (2003) and the interatomic potential by Ruda et al. Ruda et al. (2009) The atoms near the surfaces are fully relaxed to allow reconstruction if necessary. The predicted surface energies have the same order of magnitude as DFT results. However, the present MEAM gives a wrong order of stability among the three surfaces.
VI Interstitial Energies
The interstitial point defect formation energy is given by
| (7) |
where the total energy of a system with (Fe or C) atoms is and is the total energy of a system with atoms plus the inserted atom A (Fe or C), and is the total energy per atom of type- in its most stable bulk structure. In this case, we considered interstitial defects of C atoms in a Fe bcc lattice. Interstitial defect formation energies of C at the octahedral and tetrahedral positions of the Fe bcc lattice were calculated. The results are presented in Table 4 with comparison to DFT results, and to other interatomic potentials. The present MEAM potential predicts the octahedral defect to be the most stable in agreement with DFT results. However, the difference between two defect energies is smaller compared to that of DFT.
VII Properties of Hypothetical Crystal Structures
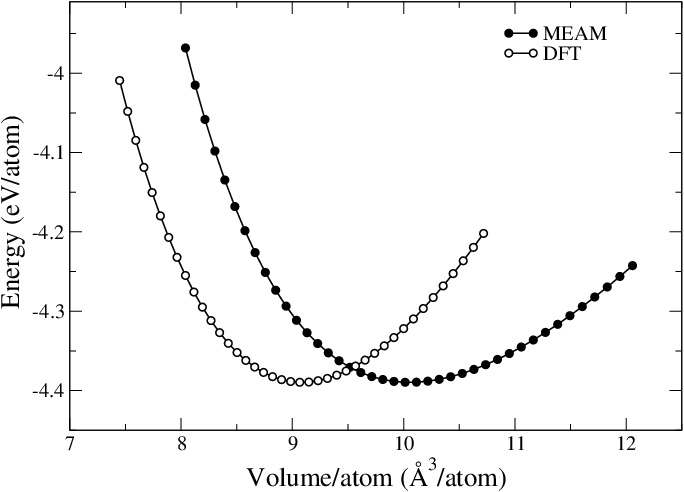
Heat of formation of Fe–C in crystal structure and crystal structure as well as their equilibrium volumes are also presented in Table 4. The heat of formation of is unusually low compared to DFT results. is the reference structure of the Fe–C alloy potential and its heat of formation is defined by the parameter of the potential. The parameter also has a large effect on the heat of formation of cementite and thereby to its structural and elastic properties. Heat of formation of and were used as target properties in the GA stage of the potential construction process. However the heat of formation of these two structures were weighted far less in the construction of the objective function for obtaining the final potential parameters as compared to properties of cementite. This caused the parameter to have a low value to reproduce overall cementite properties with greater accuracy. This should not pose a serious problem since is a hypothetical structure.
VII.0.1 Energy vs. volume curves for and structures
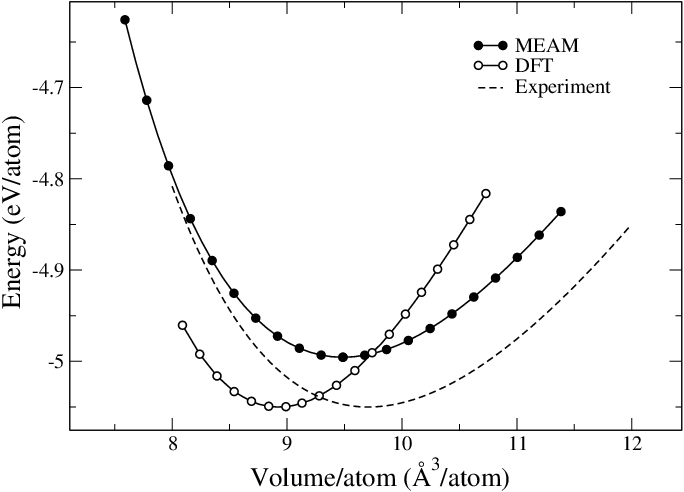
The cohesive energy of Fe–C in the and crystal structures as a function of the atomic volume is shown in Figs. 5 and 6, respectively. For the structure, the present MEAM potential predicts an atomic volume 11% less, and a bulk modulus 0.3% less than DFT. The MEAM prediction for the structure gives an atomic volume 11% greater, and a bulk modulus 35% less than DFT. As mentioned earlier, DFT overestimates the cohesive energy. Therefore, to aid the comparison in these figures, the DFT curves are shifted vertically by constant amounts to the MEAM-predicted cohesive energies at the equilibrium nearest neighbor distances.
VII.0.2 Elastic constants of FeC in the crystal structure
Elastic constants of Fe–C in the crystal structure were calculated using the Fe–C MEAM potential and are listed in Table 4 in comparison with DFT calculations and the interatomic potential by Lee.Lee (2006) They were calculated using the deformation matrix presented by Jiang et al. Jiang et al. (2008) Distortion energies () calculated for strains () equal to % were fitted to . The result from the present work for compares reasonably well with the DFT result. is predicted at a lower value than DFT, but it is in the same order of magnitude. MEAM prediction of is significantly larger than the DFT result.
VIII Thermal properties of cementite
VIII.1 Thermal stability of cementite
The stability of cementite at high temperatures was investigated through molecular dynamics (MD) simulations in a canonical (NVT) ensemble from temperatures ranging from 300 K to 1400 K. At the end of these MD simulations, cementite retained its crystalline structure, affirming its stability at high temperatures. The present Fe–C MEAM potential was also used to predict several thermal properties of cementite. In this section, we present calculations for predicting melting temperature and variation of specific heat and volume of cementite with respect to temperature.
VIII.2 Melting temperature simulation
Cementite does not have a well-defined melting temperature due to its metastable nature.Henriksson and Nordlund (2009) Experimentally, cementite decomposes to ferrite (bcc Fe) and graphite if heated for between 923 K and 973 K for several years.Callister and Rethwisch (2007) The Fe–C phase diagram also has well-defined eutectic point at 1420 K, Callister and Rethwisch (2007); Okamoto (1992) where liquid consisting of Fe and C austenite (fcc Fe) and cementite co-exists in equilibrium. Above 1420 K the phase diagram for cementite is determined through mathematical calculations.Okamoto (1992) For the purpose of this calculation, we considered the melting temperature of cementite to be the temperature when cementite loses its crystal structure and becomes a random collection of Fe and C atoms. The melting temperature calculation can be done using a single-phase simulation box. However, the single phase method generally overestimates the melting temperature due to the lack of the interface effects.Belonoshko (1994) To avoid this superheating problem and predict the melting temperature more accurately, we used a two-phase simulation box that contains both solid and liquid phases.
 |
 |
 |
 |
 |
 |
VIII.2.1 Preparation of two-phase simulation box
We performed two-phase simulations (TPS) in the isothermal-isobaric (NPT) ensemble to determine the melting temperature of cementite. The simulation box contained both solid and liquid phases of cementite. First a supercell containing unit cells of cementite ( atoms) was heated via MD runs in the NPT ensemble with K and . Next, one half of the atoms in the supercell were fixed in their positions and MD runs were carried out for the other half in the NPT ensemble with a sufficiently high temperature (such as K) and to create a liquid phase. The resulting supercell was then subjected to MD runs in the NPT ensemble with K (which is higher than the expected melting temperature) and , still keeping the same half of the atoms fixed. The result of this process was a supercell containing solid cementite at 1200 K in one half, and liquid cementite at 1500 K in the other. This ensures a minimum difference of stress between atoms in liquid and solid phases of the supercell. This supercell was then used in the simulations of solidification and melting of cementite.
VIII.2.2 Two-phase simulation
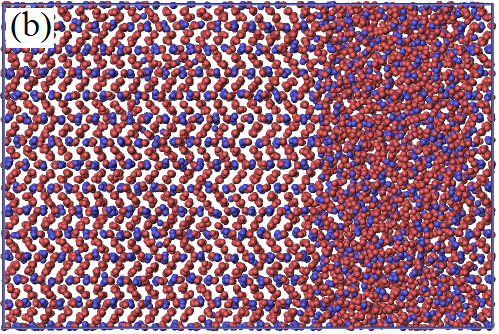
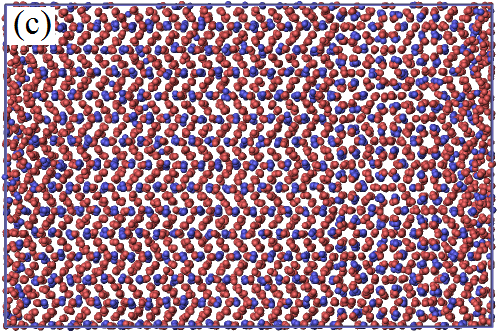
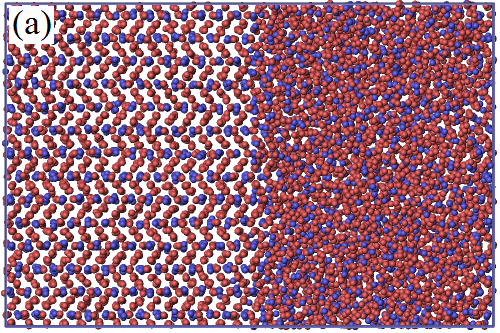
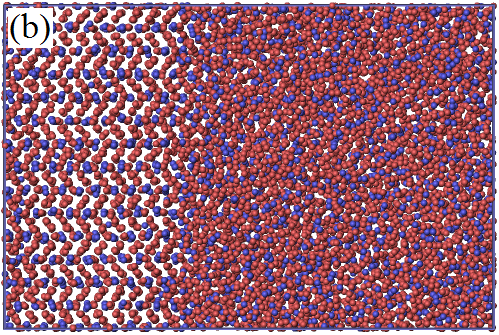
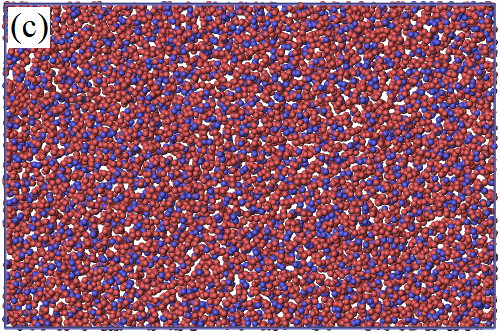
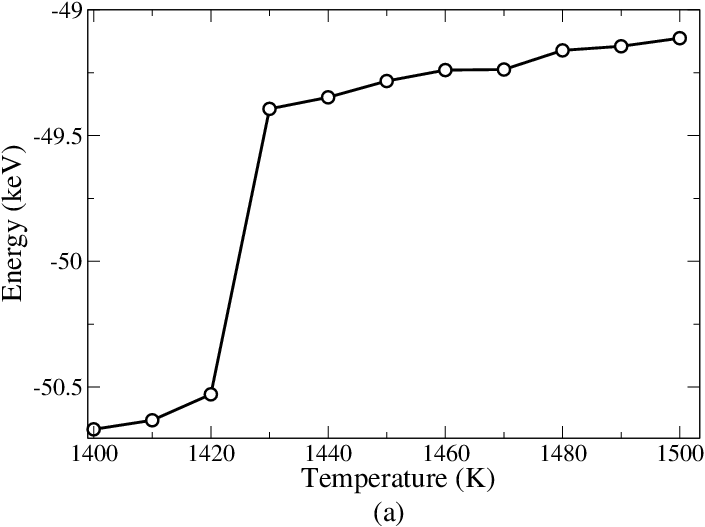
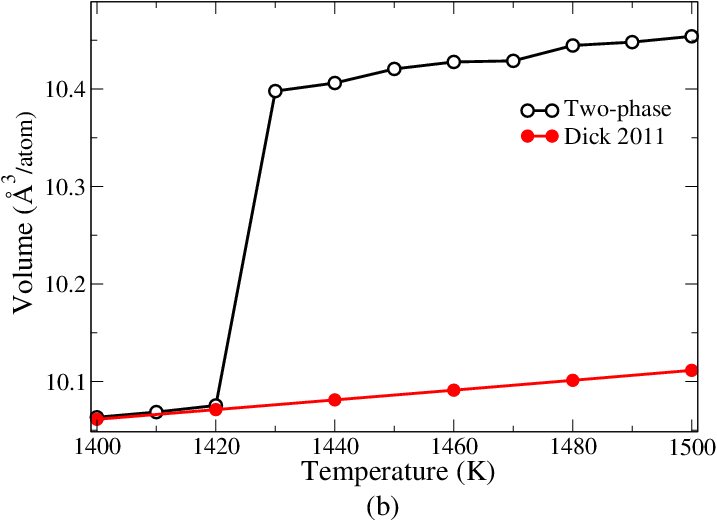
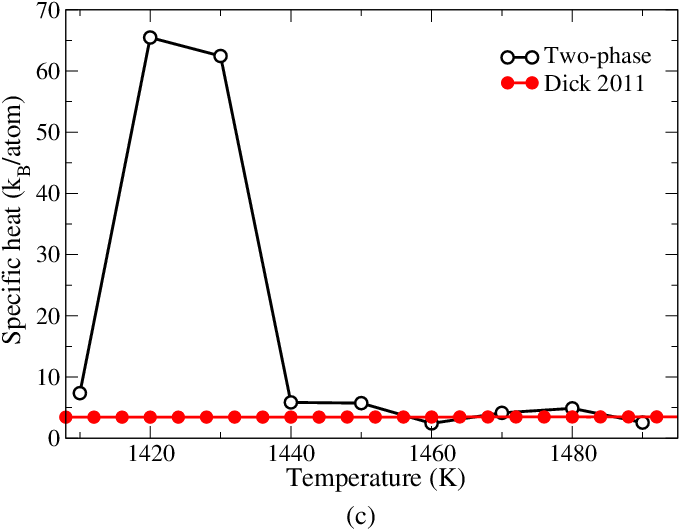
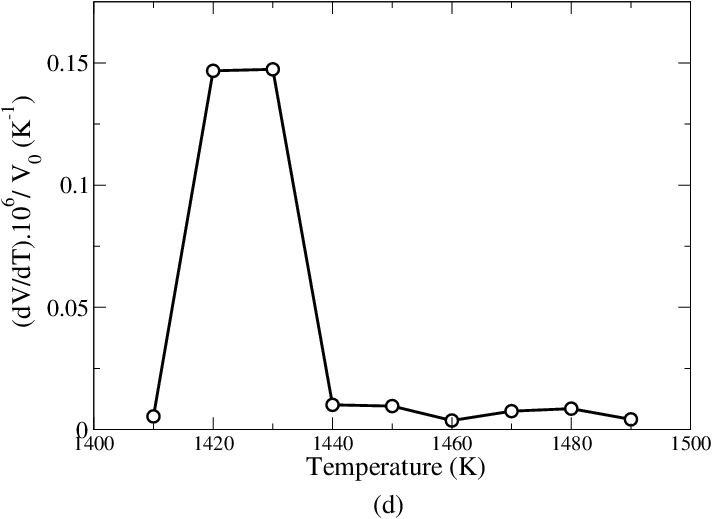
The two-phase supercell prepared in the previous section was heated by MD runs in the NPT ensemble where the temperature was increased from 1000 K to 1500 K in 100 K intervals. Each system ran for 1.6 ns of simulation time at a time step of 2 fs. The phase change of the two-phase simulation box was visually monitored. At 1400 K the solid phase of the simulation box progressed to occupy the entire box. In comparison, at 1500 K the liquid phase of the simulation box progressed to occupy the entire box. Next, the initial two-phase simulation box was heated from 1400 K to 1500 K in 10 K intervals using NPT MD runs. Each system was equilibrated for at least time steps totaling to 10 ns. The final state of the system was visually inspected. If the final state appeared to have both liquid and solid phases, more MD runs were performed until the final state of the supercell contained only one phase. Some systems required as much as 32 ns of MD runs to arrive at a single phase. The transformation of the two-phase simulation box to a one-phase simulation box near the predicted melting temperature is presented in Fig. 8 and Fig. 8. The total energy, volume, and pressure of the systems were determined through averaging the values of the final time steps (80 ps) of each simulation.
In Fig. 9 we plot the total energy, volume, specific heat, and the derivative of volume as functions of temperature. Experimental data for specific heat and volume are not available for the 1400-1500 K temperature range. Available experimental data are the heat capacity of 3.6 at 1023 K,Naeser (1934), and the experimental volume of 10 atom at 1070 K.Reed and Root (1997) Specific heat and volume determined by Dick et al. from the first-principles calculationsDick et al. (2011) done on the solid phase of cementite are included for comparison in Figs. 9(b) and (c). Since Dick and coworkers used a single-phase simulation box, their simulation clearly shows superheating causing the melting temperature to be overestimated. This can be attributed to the absence of the solid-liquid interface in single phase simulations. In Fig. 9(c) the specific heat shows a peak between 1420 K and 1430 K. Therefore we assign K as the melting temperature of cementite. This is a reasonable prediction compared to experimental eutectic point at 1420 K.Callister and Rethwisch (2007); Okamoto (1992)
 |
 |
 |
 |
IX Summary and Conclusion
In this study, we investigated the properties of cementite using an interatomic potential developed within the MEAM formalism. Previously developed single-element interatomic potentials for Fe and C were used to develop the Fe–C alloy MEAM potential. The single-element potential for C predicts graphite and diamond as stable structures with nearly degenerate energies. MEAM potentials for pure elements predict the heat of formation, bulk moduli, and lattice constants of Fe and C in their natural crystal structures in good agreement with experimental data. The alloy potential for the Fe–C system was developed primarily to reproduce structural and elastic properties of cementite. Secondarily, the interstitial energies of C in bcc Fe, as well as heats of formation of Fe–C alloys in and structures were included with less weighting factors. The constructed potential was used to predict structural, elastic, and thermal properties of cementite. Structural properties tested included the heat of formation, the equilibrium lattice constants, the equilibrium volume, and the energy variation with respect to volume. MEAM predictions are in good agreement with DFT and experiment. Nine single-crystal elastic constants were calculated and used to estimate polycrystalline bulk modulus, shear modulus, Young’s modulus, and Poisson’s ratio of cementite. Surface energies for (001), (010), and (100) surfaces were also calculated and compared. The potential was validated by predicting the thermal stability of cementite, its melting temperature and the variation of specific heat and volume of cementite with respect to temperature by two-phase (solid/liquid) MD simulations. The present MEAM potential predicted the melting temperature of cementite to be K.
X Acknowledgments
We are grateful to A.B. Belonoshko for his suggestions in conducting the two-phase melting simulations. This work was supported in part by the Department of Energy, grants DE-EE0002323 and DE-FC26-06NT2755. Computer time allocation has been provided by the High Performance Computing Collaboratory (HPC2) at Mississippi State University.
References
- Baskes (1992) M. I. Baskes, Phys. Rev. B 46, 2727 (1992).
- Daw and Baskes (1984) M. S. Daw and M. I. Baskes, Phys. Rev. B 29, 6443 (1984).
- Lee et al. (2001) B.-J. Lee, M. Baskes, H. Kim, and Y. K. Cho, Phys. Rev. B 64, 184102 (2001).
- Lee (2006) B. Lee, Acta Materialia 54, 701 (2006).
- Fang et al. (2012) C. M. Fang, M. A. van Huis, B. J. Thijsse, and H. W. Zandbergen, Phys. Rev. B 85, 054116 (2012).
- Meschel and Kleppa (1997) S. Meschel and O. Kleppa, Journal of Alloys and Compounds 257, 227 (1997).
- Callister and Rethwisch (2007) W. Callister and D. Rethwisch, Materials science and engineering: an introduction, 7th ed. (Wiley New York, 2007) pp. 290–293.
- Henriksson and Nordlund (2009) K. Henriksson and K. Nordlund, Physical Review B 79, 144107 (2009).
- Becquart et al. (2007) C. Becquart, J. Raulot, G. Bencteux, C. Domain, M. Perez, S. Garruchet, and H. Nguyen, Computational Materials Science 40, 119 (2007).
- Lau et al. (2007) T. T. Lau, C. J. Först, X. Lin, J. D. Gale, S. Yip, and K. J. V. Vliet, Phys. Rev. Lett. 98, 215501 (2007).
- Hepburn and Ackland (2008) D. J. Hepburn and G. J. Ackland, Phys. Rev. B 78, 165115 (2008).
- Ruda et al. (2009) M. Ruda, D. Farkas, and G. Garcia, Computational Materials Science 45, 550 (2009).
- Duff and Sluiter (2010) A. I. Duff and M. H. F. Sluiter, MATERIALS TRANSACTIONS 51, 675 (2010).
- Erhart et al. (2006) P. Erhart, N. Juslin, O. Goy, K. Nordlund, R. Müller, and K. Albe, Journal of Physics: Condensed Matter 18, 6585 (2006).
- Albe et al. (2002) K. Albe, K. Nordlund, and R. S. Averback, Phys. Rev. B 65, 195124 (2002).
- Lee et al. (2012) T. Lee, M. I. Baskes, S. M. Valone, and J. D. Doll, Journal of Physics: Condensed Matter 24, 225404 (2012).
- Uddin et al. (2010) J. Uddin, M. I. Baskes, S. G. Srinivasan, T. R. Cundari, and A. K. Wilson, Phys. Rev. B 81, 104103 (2010).
- Plimpton (1995) S. Plimpton, Journal of Computational Physics 117, 1 (1995).
- (19) S. Plimpton et al., “Lammps-large-scale atomic/molecular massively parallel simulator,” April 2011 version.
- Kresse and Hafner (1993) G. Kresse and J. Hafner, Phys. Rev. B 47, 558 (1993).
- Kresse and Furthmüller (1996) G. Kresse and J. Furthmüller, Phys. Rev. B 54, 11169 (1996).
- Kresse and Joubert (1999) G. Kresse and D. Joubert, Phys. Rev. B 59, 1758 (1999).
- Perdew et al. (1996) J. P. Perdew, K. Burke, and M. Ernzerhof, Phys. Rev. Lett. 77, 3865 (1996).
- Monkhorst and Pack (1976) H. Monkhorst and J. Pack, Phys. Rev. B 13, 5188 (1976).
- Methfessel and Paxton (1989) M. Methfessel and A. T. Paxton, Phys. Rev. B 40, 3616 (1989).
- Philipsen and Baerends (1996) P. H. T. Philipsen and E. J. Baerends, Phys. Rev. B 54, 5326 (1996).
- Devey and de Leeuw (2010) A. Devey and N. H. de Leeuw, Phys. Rev. B 82, 235112 (2010).
- Rose et al. (1984) J. H. Rose, J. R. Smith, F. Guinea, and J. Ferrante, Phys. Rev. B 29, 2963 (1984).
- Yin and Cohen (1984) M. T. Yin and M. L. Cohen, Phys. Rev. B 29, 6996 (1984).
- Kittel (1986) C. Kittel, Introduction to Solid State Physics, 6th ed. (John Wiley & Sons, Inc., New York, 1986).
- Donohue (1982) J. Donohue, The structures of the elements (R.E. Krieger Pub. Co., Malabar, Fla., 1982) p. 256.
- McSkimin et al. (1972) H. J. McSkimin, J. P. Andreatch, and P. Glynn, Journal of Applied Physics 43, 985 (1972).
- Fahy and Louie (1987) S. Fahy and S. G. Louie, Phys. Rev. B 36, 3373 (1987).
- Orson and Anderson (1966) L. Orson and Anderson, Journal of Physics and Chemistry of Solids 27, 547 (1966).
- Murnaghan (1944) F. D. Murnaghan, Proceedings of the National Academy of Science 30, 244 (1944).
- Tschopp et al. (2012) M. Tschopp, K. Solanki, M. Baskes, F. Gao, X. Sun, and M. Horstemeyer, Journal of Nuclear Materials 425, 22 (2012).
- McKay et al. (2000) M. McKay, R. Beckman, and W. Conover, Technometrics 42, 55 (2000).
- Shein et al. (2006) I. Shein, N. Medvedeva, and A. Ivanovskii, Physica B: Condensed Matter 371, 126 (2006).
- Jiang et al. (2008) C. Jiang, S. G. Srinivasan, A. Caro, and S. A. Maloy, Journal of Applied Physics 103, 043502 (2008).
- Li et al. (2002) J. Li, H. K. Mao, Y. Fei, E. Gregoryanz, M. Eremets, and C. S. Zha, Physics and Chemistry of Minerals 29, 166 (2002), 10.1007/s00269-001-0224-4.
- Laszlo and Nolle (1959) F. Laszlo and H. Nolle, Journal of the Mechanics and Physics of Solids 7, 193 (1959).
- Mizubayashi et al. (1999) H. Mizubayashi, S. Li, H. Yumoto, and M. Shimotomai, Scripta Materialia 40, 773 (1999).
- Umemoto et al. (2001) M. Umemoto, Z. Liu, K. Masuyama, and K. Tsuchiya, Scripta Materialia 45, 391 (2001).
- Chiou (2003) W. Chiou, Surface Science 530, 87 (2003).
- Wood et al. (2004) I. G. Wood, L. Vočadlo, K. S. Knight, D. P. Dobson, W. G. Marshall, G. D. Price, and J. Brodholt, Journal of Applied Crystallography 37, 82 (2004).
- Murnaghan (1967) F. Murnaghan, Finite deformation of an elastic solid (Dover New York, 1967).
- Panda and Chandran (2006) K. Panda and K. R. Chandran, Acta Materialia 54, 1641 (2006).
- Hill (1952) R. Hill, Proceedings of the Physical Society. Section A 65, 349 (1952).
- Okamoto (1992) H. Okamoto, Journal of Phase Equilibria 13, 543 (1992), 10.1007/BF02665767.
- Belonoshko (1994) A. B. Belonoshko, Geochimica et Cosmochimica Acta 58, 4039 (1994).
- Naeser (1934) G. Naeser, Mitt. Kais.-Wilh.-Inst. Eisenforschg 16, 207 (1934), as reported in Dick et al. Dick et al. (2011).
- Reed and Root (1997) R. C. Reed and J. H. Root, Scripta Materialia 38, 95 (1997), as reported by Dick et al. Dick et al. (2011).
- Dick et al. (2011) A. Dick, F. Körmann, T. Hickel, and J. Neugebauer, Phys. Rev. B 84, 125101 (2011).