Relaxation dynamics of a protein solution investigated by dielectric spectroscopy
Abstract
In the present work, we provide a dielectric study on two differently concentrated aqueous lysozyme solutions in the frequency range from 1 MHz to 40 GHz and for temperatures from 275 to 330 K. We analyze the three dispersion regions, commonly found in protein solutions, usually termed -, -, and -relaxation. The -relaxation, occurring in the frequency range around 10 MHz and the -relaxation around 20 GHz (at room temperature) can be attributed to the rotation of the polar protein molecules in their aqueous medium and the reorientational motion of the free water molecules, respectively. The nature of the -relaxation, which often is ascribed to the motion of bound water molecules, is not yet fully understood. Here we provide data on the temperature dependence of the relaxation times and relaxation strengths of all three detected processes and on the dc conductivity arising from ionic charge transport. The temperature dependences of the - and -relaxations are closely correlated. We found a significant temperature dependence of the dipole moment of the protein, indicating conformational changes. Moreover we find a breakdown of the Debye-Stokes-Einstein relation in this protein solution, i.e., the dc conductivity is not completely governed by the mobility of the solvent molecules. Instead it seems that the dc conductivity is closely connected to the hydration shell dynamics.
keywords:
protein dynamics, protein solutions, dielectric spectroscopy, lysozyme, hydration shell, Debye-Stokes-Einstein relation1 Introduction
Proteins are essential for life. They are the building blocks of cells and they are part of virtually every biological process [1, 2]. As enzymes they catalyze chemical reactions and in cell membranes they build ion channels and pumps; they are responsible for signal generation and transmission and they also act as antibodies, hormones, toxins, anti-freezer, elastic fibers or source of luminescence. This ubiquity of proteins since long has triggered scientists’ demand for a deeper understanding of their structure and functionality. In organisms, proteins with biological functions usually exist in solution and many of their physical and functional properties are strongly influenced by the solvent [3]. Therefore it is vital to examine proteins within their common environment. Due to its importance for obtaining a deeper understanding of biological processes, the dynamics of proteins in general is a very active field of research [4, 5, 6, 7, 8], which is often focused on the protein-water interaction [9, 10, 11, 12, 13]. Here a suitable and commonly employed experimental method is dielectric spectroscopy [4, 9, 14, 15, 16, 17, 18, 19, 20, 21, 22, 23, 24].
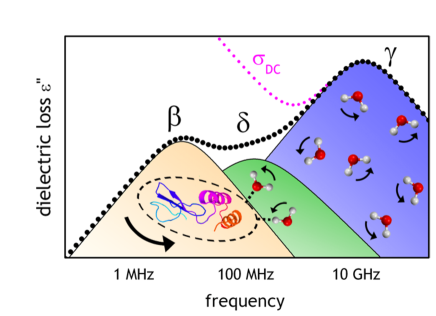
Dielectric spectra of aqueous protein solutions show at least three dispersion regions [2, 25, 26, 27], revealing the typical signatures of relaxation processes, namely a step in the dielectric constant, , and a peak in the dielectric loss, (Fig. 1). In the biophysics community, they are often termed -, -, and - relaxation. This nomenclature should not be confused with that used in the investigation of glassy matter, where the terms -, -relaxation, etc. are commonly applied to completely different phenomena than those considered here (see, e.g., refs. 28 and 29). In the present work we follow the biophysical nomenclature.
The -relaxation in the low frequency range and the -relaxation at around 18 GHz (at room temperature) can unambiguously be assigned to the rotation of the polar protein molecule in its aqueous medium and the reorientational motion of the free water molecules (similar to the main relaxation process in pure water), respectively [26, 27]. (The -relaxation corresponds to the -relaxation of bulk water within the glass-physics nomenclature. Within this nomenclature, the -relaxation may be regarded as -relaxation of the protein molecules, governed by the solvent dynamics.) The third dispersion, located between - and -relaxation is still a subject of discussion. After the pioneering works of Oncley revealed the presence of - and -relaxations in the late 1930’s and 1940’s [14, 15, 30], first indications for this -dispersion where found by Haggis and Buchanan about one decade later [31, 32]. It is quite generally accepted nowadays that this dispersion, which was detected in different protein solutions, is due to bound water relaxation [16, 17, 33, 34, 35]. It is well known that proteins possess a hydration shell of bound water molecules and it is reasonable that these water molecules should have slower dynamics than free molecules. However, the complexity of proteins makes it difficult to decide if the -dispersion can solely [36] be explained by a bound water relaxation (which could also be bimodal [18, 2, 4, 37]) or if additional effects like intra-protein motions have to be included [18, 38, 2, 24, 26]. The bound water relaxation has also been discussed in the context of the glass transition in proteins [39].
At low frequencies ( kHz), the spectra of aqueous protein solutions are dominated by electrode polarization (EP) [14, 23, 40] giving rise to giant values of the dielectric constant and a strong drop of conductivity towards low frequencies. EP arises when the conducting ions in the sample arrive at the metallic electrodes and accumulate in thin layers immediately beneath the sample surface forming a so-called space-charge region. However, this effect is not a special feature of protein solutions, but affects dielectric spectra of any material containing free ions [40, 41, 42]. For this reason, here we will not present the low frequency region of our broadband spectra, dominated by EP contributions (see ref. [40] for a detailed treatment of EP, including a lysozyme solution) .
In the present work, we provide a thorough dielectric characterization of the relaxational processes in lysozyme solutions. Lysozyme, a representative of globular water-soluble proteins, is an enzyme and part of the innate immune system with a molar weight of 14.3 kDa [43, 44]. The obtained spectra in the frequency range from 1 MHz - 40 GHz allow for the detection of -, -, and -relaxation. For the first time, we investigate the temperature dependence of spectra covering all these intrinsic relaxations. This allows gathering valuable information including, e.g., the hindering barriers for the involved molecular motions. Further parameters as the dipolar moment and the radius of the protein are deduced from the dielectric results and the validity of the Debye-Stokes-Einstein formula in this protein solution is checked.
2 Materials and methods
The complex dielectric permittivity and conductivity were determined using two different coaxial reflection techniques [45, 46]. In the frequency range 1 MHz - 3 GHz, an Agilent Impedance/Material Analyzer E4991A, was employed. The ac voltage is applied to a platinum parallel-plate capacitor containing the sample material (diameter 4.8 mm, plate distance 0.1 - 0.85 mm). The capacitor is connected to the end of a coaxial line, thereby bridging inner and outer conductor. Contributions of the coaxial line and connectors were corrected by a calibration with three standard impedances. For temperature-dependent measurements the capacitor is mounted into a N2-gas cryostat (Novocontrol Quatro). The sample holder and coaxial line, which connects the sample within the cryostat to the measuring device, were designed in our laboratory [45]. The high-frequency range (100 MHz - 40 GHz) was covered by the Agilent ”Dielectric Probe Kit” using an open-ended coaxial line, the so-called ”Performance Probe”, in combination with a Agilent E8363B Network Analyzer. Here, the line is immersed into the sample liquid, which is kept in 50 ml plastic tubes. The temperature was controlled by means of an Eppendorf ”Thermomixer Comfort” in combination with a 50 ml ”Thermoblock” that is mounted on the heating plate of the Thermomixer to heat the sample tube.
Dialyzed and lyophilized Lysozyme powder from chicken egg white was purchased from Sigma-Aldrich (Fluka 62970) and used without further purification. Aqueous protein solutions were prepared by dissolving weighed amounts of protein powder in deionized H2O (Merck ”Ultrapur”). The investigated concentrations correspond to 3 mmol and 5 mmol of Lysozyme powder added to one liter of water (equal to 42.9 mg and 71.5 mg per 1 ml of water). The pH values of these solutions are around 3.8 (measured with a pH tester from Hanna-Instruments).
3 Results and discussion
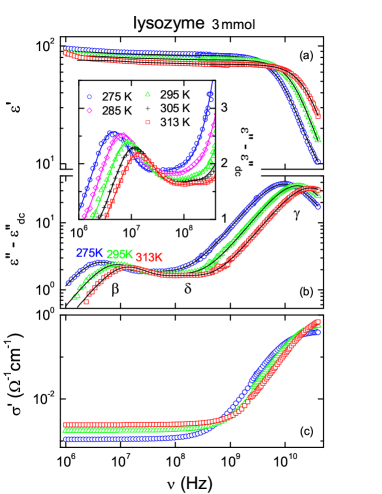
Figure 2 shows the spectra of dielectric constant (a), dielectric loss (b), and real part of conductivity (c) of a 3 mmol lysozyme solution covering the frequency range from 1 MHz - 40 GHz for three selected temperatures. The inset shows a magnified view of the loss in the region of the - and -relaxations for five temperatures in a semilogarithmic plot.
In the real part of the conductivity, a strong dc-contribution is found showing up as frequency-independent plateau from 1 kHz (not shown) to 100 MHz (Fig. 2(c)). This is due to ionic charge transport with the ions arising from the residual salt content in the protein sample (mainly chloride ions, left over from production process). Dielectric loss (b) and conductivity (c) are directly correlated via ( is the circular frequency and is the permittivity of vacuum). Thus, the dc conductivity gives rise to a contribution , i.e. a divergence in the loss, which obscures the detection of possible relaxation processes at low frequencies (cf. dotted line in Fig. 1). Therefore it is common practice to subtract the dc contribution [8, 22, 24, 36, 47]. This is a critical task as the amplitude of the resulting relaxation peaks can strongly depend on the value of the subtracted dc conductivity. In the present case, the correctness of the subtracted values, which were determined from the measured conductivity, is confirmed by the high quality of simultaneous fits of the step in (unaffected by the dc conductivity) and of the peak in revealed after subtraction (see below). This leads to the corrected loss spectra shown in Fig. 2(b). In this figure, clear signatures for the - and -relaxation are found. They show up as peaks close to 10 MHz or 20 GHz, respectively, shifting to lower frequencies with decreasing temperature. This temperature dependence directly mirrors the reduction of reorientational mobility of the protein and free water molecules when temperature is lowered. However, a closer inspection of Fig. 2(b) provides clear indications for a third relaxation process (-relaxation) in the frequency range around 100 MHz. There is significant excess intensity, not explainable by a simple superposition of - and -peaks. At the highest temperature shown (313 K), there is even the indication of a separate weak peak (see also inset of Fig. 2). However, clearly the -relaxation is the dominating process and thus the - and -relaxations are hardly discernible in the real part of the dielectric constant (Fig. 2(a)). For low frequencies, approaches a plateau whose absolute value of about 80-90 is of the same order of magnitude as the static dielectric constant of pure water ( = 80.3 at 293 K [48]). The -relaxation is sufficiently strong to be detected also in (Fig. 2(c)), despite the significant dc contribution: It leads to a strong increase at MHz, followed by the approach of a plateau close to the upper boundary of the investigated frequency range.
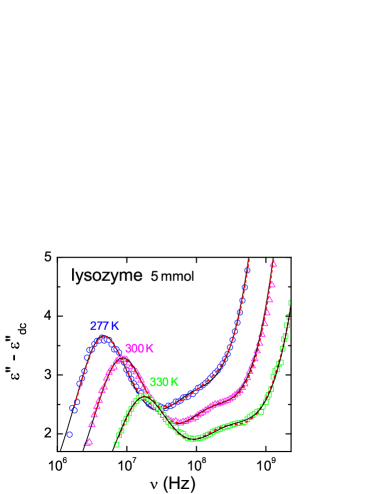
Qualitatively similar results as shown in Fig. 2 were also obtained for a 5 mmol lysozyme solution. In Fig. 3 we show within the frequency region of the - and -relaxations. Obviously, in this solution with higher protein concentration, the -relaxation is even more pronounced with the loss showing clear shoulders close to about 200 MHz for the two higher temperatures shown.
For a meaningful analysis of relaxational processes in dielectric spectra, suitable fits, simultaneously performed for real and imaginary part of the dielectric permittivity, are essential. In the simplest case, the contributions of relaxation processes in dielectric spectra can be fitted by the Debye equation [49]:
| (1) |
is the dielectric strength with and the limiting values of the real part of the dielectric constant for frequencies well below and above the relaxation frequency , respectively. At a peak shows up in the dielectric loss and an inflection point in the frequency dependence of the dielectric constant. The dc-conductivity was subtracted before the fitting procedure. The Debye theory assumes that all dipolar entities relax with the same relaxation time . In reality, however, a disorder-induced distribution of relaxation times often leads to a considerable smearing out of the spectral features [50, 51]. An appropriate phenomenological description is given by the Havriliak-Negami formula, which is an empirical extension of the Debye formula by the additional parameters and [52, 53]:
| (2) |
Special cases of this formula are the Cole-Cole formula [54] with and and the Cole-Davidson formula [55, 56] with and . While the Havriliak-Negami and the Cole-Davidson functions are purely empirical, the Cole-Cole distribution of can be approximately derived by the microscopic model of a Gaussian distribution of energy barriers, leading to a symmetric broadening (compared to the Debye case) of the relaxation peak in [57].
The - and -relaxations in protein solutions are commonly found to be well describable by Eq. (1) or to show at least a behavior very close to monodispersive [4, 22, 24, 37] and only few authors apply the Cole-Cole function to describe the -process [21]. For the -relaxation, this is reasonable as the corresponding relaxation of pure water is also of Debye type [48, 58, 59] or only slightly broadened [25, 60, 61]. Also for the -relaxation Debye behavior can be expected as any interaction between the protein molecules is unlikely and each molecule ”sees” essentially the same environment, dominated by the (on the timescale of the -relaxation) quickly fluctuating water molecules. However, for the -relaxation the situation is far from being clarified, especially as the unequivocal detection of its spectral shape is hampered by the superposition from the adjacent - and -relaxations (Figs. 2 and 3). As mentioned above, until now it is even not clear if there is only a single -relaxation or if several relaxation processes contribute in this region. In ref. [4], where lysozyme solutions of various concentrations were investigated at room temperature, sophisticated arguments favoring the use of two Debye functions to describe the -relaxation at high concentrations were provided. In the present work, we fit the experimental data assuming a single peak only, which, however, is broadened according to the Cole-Cole equation (cf. Eq. (2) with ). When adopting the bound-water explanation of the -relaxation, a distribution of relaxation times (and thus of energy barriers) seems reasonable as there should be a variation in the strength of bonding of the water molecules of the protein surface. This may depend on the polar residue of the macromolecules, to which the water molecule is bound, and it may also arise from the presence of several hydration shells, the molecules in the outer ones being more loosely bound than those in the innermost one [4]. Bound-water relaxations have also been previously described by the Cole-Cole function [39, 62].
The lines in Figs. 2 and 3 are fits with the sum of one Debye function for the - and two Cole-Cole functions for the - and -relaxations. Reasonable fits of the experimental spectra could be achieved in this way. The width parameter of the -relaxation was found to vary only weakly around 0.1 and thus was constrained to the range 0.09-0.11 for the final fits. For the -relaxation, the deviation from the Debye case was even smaller, the maximum value of being . According to Grant et al. [37], the -relaxation of myoglobin solutions is bimodal (due to loosely and strongly bound water), but the dispersion due to the loosely bound water with a peak frequency of a few GHz can be incorporated into the -relaxation by using a Cole-Cole function with distribution parameters up to . In our case, having even smaller values of , the use of an additional relaxation process () seems not justified, particularly as an alternative description with a Debye function () for the -relaxation does not visibly worsen the fits. Nevertheless, for comparison, Fig. 3 also shows fits with the sum of four separate Debye functions (, , , ) as proposed in [4, 37]. An inspection of Fig. 3 by eye does not reveal any significant differences in the quality of these fits and, based on our data base, we believe it is not possible to make a final decision. At least, from the viewpoint of Occam’s razor, using one relaxation process less for the description of the data seems preferable.
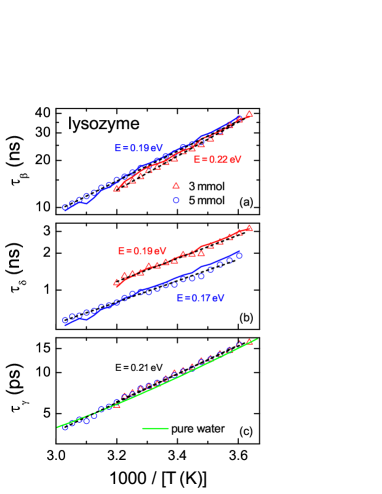
The most significant parameter obtained from an analysis of relaxational processes is the characteristic time of the involved dynamics of the relaxing entities. Figure 4 provides the temperature dependence of the relaxation times of all three detected processes for both investigated protein concentrations. All relaxation times reveal straight-line behavior in the Arrhenius representation of Fig. 4 (dashed lines), indicating thermally activated behavior:
| (3) |
Here, is an inverse attempt frequency, often assumed to be of the order of a typical phonon frequency and denotes the hindering barriers for the relaxational process. However, it should be noted that for all relaxation times shown in Fig. 4, deviations from Arrhenius behavior may well be possible when taking into account the scatter of the data and the rather small temperature range that can be investigated in aqueous solutions, which naturally is limited by the freezing and boiling points of water. For pure water, such small deviations are well documented [48, 63]. In glass forming liquids, an often used explanation for non-Arrhenius behavior is the cooperativity of the molecular motions [64, 65]. In contrast, for water also a critical power-law of arising from a first-order phase transition was considered [66]. For comparison, in Fig. 4(c), of pure water from the literature [48] is included. The absolute values of the relaxation times of water are close to those of the present -relaxation times corroborating the assignment of this relaxation to bulk water molecules. The two protein solutions have identical -relaxation times, in accord with the findings in [4]. Except for the highest temperatures, the relaxation times of pure water seem to be slightly lower than those of the protein solutions. Slower dynamics of the -relaxation (i.e. higher values of ) than for pure water was also found in other protein solutions [22, 37, 67].
Whereas the -relaxation times do not depend on the protein concentration, the -relaxation times are slightly lower for the solution with lower protein concentration (Fig. 4(a)). This finding is consistent with the experimental results of ref. [22] for ubiquitin and of [24] for ribonuclease A. It evidences faster reorientational motions of the protein molecules in the lower concentrated sample, which may be ascribed to weaker hindering of this motion by the neighboring molecules.
Interestingly, irrespective of the absolute values, the -relaxations of both lysozyme samples show nearly the same temperature dependence as the -relaxation. This is visualized in Fig. 4(a) by showing (solid lines), scaled to match [68, 69]. Thus, the -relaxation seems to be strongly coupled to the structural fluctuations of the solvent (represented by the -relaxation). This is confirmed by the fact that the energy barriers, determined from the Arrhenius fits of and , Eq. (3), are nearly identical (see Fig. 4). This coupling of - and -relaxation simply mirrors the fact that the rotation dynamics of a molecule in a solution is essentially proportional to the solution’s viscosity, which is expressed by the Debye relation [27]
| (4) |
where is the solvent viscosity and is the radius of the solute molecule. (As the factor in Eq. (4) can be largely neglected, compared to the exponential or even stronger-than-exponential temperature dependence usually found for (T), in fact Eq. (4) implies .) Just as for pure water [70], the viscosity (translational motion) and the -relaxation (reorientational motion of the free water molecules) can be assumed to be strongly correlated in aqueous solutions and, thus, the finding of (Fig. 4(a)) seems reasonable. Equation (4) in principle allows for the determination of the hydrodynamic radius of the protein molecules, but as they are not exactly spherical, this can be a rough approximation only. As the addition of such small amounts of lysozyme does not significantly change the viscosity of water (which is proofed by the fact that the -relaxation times, which are related to the sample viscosity, are identical for the solutions and pure water), we can use the values for pure water from [71] to calculate the hydrodynamic radius. We arrive at values of nm for the 5 mmol solution and nm for the 3 mmol sample, largely independent of temperature. This is of same order as the results by Bonincontro et al. from dielectric spectroscopy (1.8-1.9 nm) [21], Parmar et al. and Chirico et al. from light scattering experiments [72, 73] (1.890.025 nm) and Wilkins et al. from Pulse Field Gradient NMR [74] (2.05 nm). In the work from Bonincontro et al. [21], a peak in was found. Interestingly, in the present data for the 5 mmol solution the faint indication of a peak is found too, where varies between 1.93 nm and 1.99 nm. In ref. [21] the peak was ascribed to the temperature dependence of hydrophobic interactions within the protein molecules. Also reversible denaturation effects may be considered [75].
As revealed by Fig. 4(b), the -relaxation of the 5 mmol solution is clearly faster than that of the 3 mmol solution. Interestingly, in [4] only a single Debye function was used for the -relaxation at low concentrations, while for the higher ones two were necessary, the second one being located at higher frequencies. Thus, the results in [4] may be consistent with the present ones, namely the shift of spectral weight to higher frequencies for higher concentrations, which in our case is directly mirrored by the variation of . A less significant decrease of -relaxation times was also observed by Oleinikova et al. for Ribonuclease A [24]. To explain this behavior, one could speculate that the structure of the water shell around the lysozyme molecule changes in dependence of concentration. However, our finding that the calculated radius of the lysozyme molecule (including hydration shell) is nearly the same for both concentrations (1.96 vs. 1.91) speaks against such a scenario. Thus, the microscopic origin of the observed decrease of the -relaxation time with increasing concentration remains unclear.
The solid lines in Fig. 4(b) again show the -relaxation times, scaled to match . At least for the 5 mmol solution, the slope of seems to be somewhat smaller than for . This is also mirrored by the energy barriers obtained from the fits with Eq. (3) (dashed lines; 0.17eV for vs. 0.21 eV for ). It seems reasonable that the dynamics of the bound water molecules is to some extent determined by the interactions with the polar residues on the protein molecules and thus the -relaxation is less coupled to the structural fluctuations of the solvent, i.e. the -relaxation.
The relaxation-time ratio of free and protein-bound water dynamics, found in the present work ( for the 3 mmol solution and for 5 mmol), is much higher than the factor of about 6-7, reported in a recent depolarized light-scattering study of lysozyme solutions [76]. Moreover, the susceptibility spectra of that work, extending from 1 GHz well into the THz range, reveal significantly faster water dynamics than commonly detected by dielectric spectroscopy, leading to susceptibility peak-frequencies beyond the highest frequencies covered in the present work. As noted in ref. [76], these light scattering experiments seem to probe mechanisms of different physical origin than the molecular reorientations detected by dielectric spectroscopy, which points to even more complex water dynamics, a fact that certainly warrants further investigation.

Fig. 5 provides information on the temperature dependence of the relaxation strengths of the three observed relaxation processes. We plot the inverse , which should result in linear behavior for Curie behavior,
| (5) |
The latter is expected for dipolar relaxations if the Kirkwood factor, taking into account correlation effects between dipoles, is temperature independent [77]. Indeed the relaxation strengths of the - and -relaxations of both concentrations can be fitted to Curie-laws (lines in Figs. 5(b) and (c)). The relaxation strength of the -relaxation (Fig. 5(b)) strongly depends on the concentration. Assuming bound water as its origin, this is a reasonable finding because the number of bound-water molecules should increase with the number of proteins. of the 5 mmol solution is a factor of 1.57 (0.07) higher than for 3 mmol, which is of similar magnitude as the 5/3 ratio of the concentrations. This proportionality is confirmed by the results of ref. [4] (up to a concentration of 110 mg/ml, i.e. mmol/l), if summing up the relaxation strengths of the two -relaxations assumed in this work.
The absolute values of the strength of the -relaxation (Fig. 5(c)) are somewhat smaller than for pure water (see dashed line in Fig. 5(c) [48]) and decrease with increasing concentration. This can be primarily ascribed to the trivial substitution effect of water by protein molecules in the solution, i.e. the concentration of water diminishes with increasing protein concentration. As treated in detail in [4], a further reduction of is caused by a certain amount of water molecules being bound to the protein surface, which thus no longer contribute to the -relaxation.
For the -relaxation (Fig. 5(a)) the (T) data are consistent with Curie behavior at the lower temperatures, at best. The deviation from Curie behavior may be ascribed to a temperature variation of the dipole moment of the protein molecules as discussed below. Alternatively, a temperature-dependent Kirkwood factor may explain the observed deviations. The -relaxation strength of the 5 mmol solution is by a factor of 1.46() larger than for 3 mmol, which only roughly scales with the expected increase due to the larger number density of protein molecules. A similar deviation from a purely linear increase of with concentration was also found in [4] for the same concentrations. It can be explained by a decrease of the effective dipole moment of the protein molecules [4, 24].
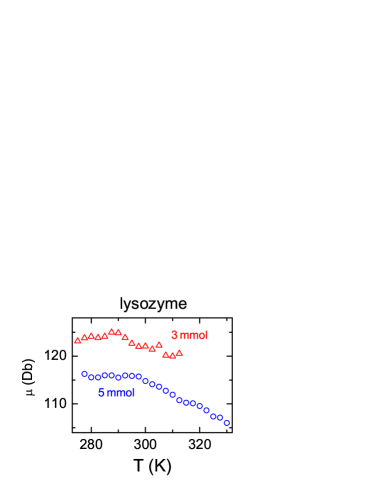
In principle, can be calculated from . There are a variety of time-honored models enabling such a calculation, but as a lot of assumptions have to be made for these models to be valid, the significance of the obtained values of should not be overrated. Nevertheless we used the same approach as in ref. [4] to calculate by employing the formula predicted by the Onsager-Oncley model [27, 30]:
| (6) |
Here is the protein molecular mass, is the vacuum permittivity, is the protein concentration in kg/m3 and and are the Boltzmann and Avogadro constants, respectively. denotes the Kirkwood correlation parameter, often assumed to be one in diluted protein solutions [19]. The obtained results are shown in Fig. 6. As expected from the previous paragraph, we obtain a lower effective dipole moment for the solution with higher protein concentration. In refs. [4] and [24] this was ascribed to antiparallel correlations between different protein molecules, implying . The absolute values of determined from our measurements differ from the room-temperature results reported in ref. [4] (our values are about 1.4 times smaller). This discrepancy remains unexplained, especially as our findings for , used for the calculation of , reasonably agree with those reported in [4]. Takashima et al. have reported a room-temperature value (extrapolated to zero concentration) of 122 Db [44], which is of similar magnitude as our results. An interesting finding revealed by Fig. 6 is the decrease of the dipole moment with temperature: While is nearly constant for the lower temperatures for both concentrations, close to room temperature it starts to decrease with increasing , which becomes especially obvious for the 5 mmol solution, for which could be determined up to higher temperatures. This directly mirrors the onset of deviations from Curie temperature dependence of at high temperatures, documented in Fig. 5(a). Proteins are able to assume many nearly isoenergetic substates [7, 78, 79]. Thus, the observed variation of dipole moment may well reflect gradual conformational changes of the molecular structure at elevated temperatures. A similar decrease of the dipole moment above about 300 K was reported for lysozyme solutions (5 mg/ml) of two different pH values by Bonincontro et al. [21] and attributed to a redistribution of microscopic state populations of the protein. In that work, a correlation of the temperature dependences of and the radius is assumed, while in the present study is nearly temperature independent as mentioned above.
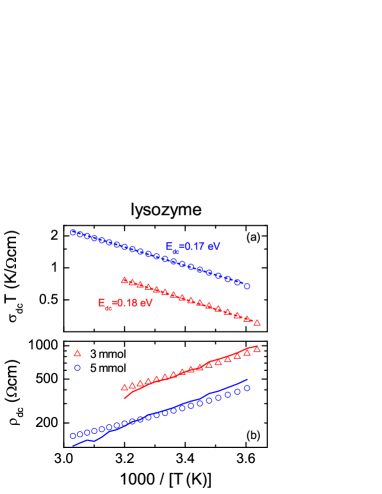
Fig. 7(a) shows the temperature dependence of the dc-conductivity of the two solutions, plotted in a way to linearize the Arrhenius behavior predicted for ionic conductors, namely
| (7) |
Here, is a prefactor and denotes the hindering barrier for the diffusion of the charge carriers. Indeed the ionic conductivity closely follows the expected thermally activated behavior (dashed lines). The fits lead to energy barriers of 0.18 and 0.17 eV for 3 and 5 mmol, respectively. The conductivity is higher by about a factor of two (2.090.02) for the 5 mmol solution. An increase of the conductivity is reasonable because the ions carrying the dc current can be assumed to mainly arise from the protein molecules releasing ions when dissolved in water. However, it is unclear why the observed conductivity increase is higher than the concentration ratio of 5/3.
In Fig. 7(b) the dc resistivity is shown and compared to the scaled -relaxation times. Especially for the 5 mmol sample, clearly different slopes of the two curves are revealed; indications for similar behavior is also found for 3 mmol. This finding implies a breakdown of the Debye-Stokes-Einstein relation, which can be expressed as and is an often discussed phenomenon in supercooled liquids [80, 81]. Interestingly this decoupling of charge transport and -relaxation closely resembles the one between the - and -relaxation documented in Fig. 4(b). Moreover, the energy barriers for dc transport (Fig. 7(a)) and for the -relaxation (Fig. 3(b)) are nearly identical. This surprising finding is difficult to rationalize and may be accidental. However, one should be aware that the conductivity is proportional to both, the mobility and the number of charge-carrier. If one assumes that the temperature dependence of in the present case is dominated by the number of ions released from the protein molecules rather than the mobility, a close connection of both processes seems possible: For the -relaxation, i.e. the reorientational motions of bound water molecules, the bonds to the protein molecules have to be (temporarily) broken, which may be determined by similar energy barriers as those necessary for the release of ions into the solution. Further work is necessary to corroborate this speculation, e.g., by investigating the relation of conductivity and -relaxation for other protein species.
4 Conclusions
In the present work, we have provided a thorough characterization of two protein solutions with different concentrations using high-frequency dielectric spectroscopy from 1 MHz to 40 GHz. A variety of information on the - and -relaxations arising from the protein tumbling and reorientation of the free water molecules has been collected. Most importantly we have detected a well-pronounced -dispersion, attributed to bound water dynamics, and have obtained detailed information on its temperature dependence. Using a Debye function for the process, a Cole-Cole function for the -relaxation, and a single Cole-Cole function for the description of the -dispersion, the complete broadband spectra can be well fitted.
Temperature-dependent data on the relaxation time and strength have been obtained for all three main dispersion regions of lysozyme solutions enabling the determination of hindering barriers for the relaxational processes and for the diffusion of ionic charge carriers. Obviously all energy barriers in these protein solutions are of similar order of magnitude, varying between 0.17 and 0.22 eV. While we find the expected strong correlation of the - and -relaxation, the -relaxation seems to be less strongly influenced by the fluctuations of the solvent and, instead, is governed by interactions with the protein molecules. We have found a significant concentration dependence of the -relaxation dynamics, whose origin is unclear until now. From our results we have deduced the hydrodynamic radius and the temperature dependence of the dipole moment. A noticeable result is the decrease of the latter with increasing temperatures, which also leads to deviations of the relaxation strength of the -relaxation from Curie behavior. We attribute this finding to gradual conformational changes of the protein structure.
The analysis of the temperature-dependent dc conductivity and its comparison with the -relaxation time reveals a breakdown of the Debye-Stokes-Einstein relation, i.e. the ionic charge transport is governed by different energy barriers than the motions of the solution molecules. Interestingly, we find that instead the charge transport and the -relaxation, i.e. the reorientation of bound water molecules, are determined by identical energy barriers, an unexpected and so far unexplained behavior.
Overall, our high-frequency dielectric measurements demonstrate the rich dynamics of protein solutions, which shows many properties about whose microscopic origins currently only speculations are possible. It is clear that further work is needed, especially covering a broad frequency range and involving temperature-dependent measurements.
References
- Alberts et al. [2005] B. Alberts, D. Bray, K. Hopkin, A. Johnson, J. Lewis, M. Raff, K. Roberts, P. Walter, Lehrbuch der molekularen Zellbiologie, Wiley VCH, 4 edition, 2005.
- Bone and Bogumil [1992] S. Bone, Z. Bogumil, Bioelectronics, Wiley, 1992.
- Gregory [1994] R. B. Gregory, Preface, in: R. Gregory (Ed.), Protein-Solvent interactions, Marcell Dekker, 1994.
- Cametti et al. [2011] C. Cametti, S. Marchetti, C. M. C. Gambi, G. Onori, Dielectric relaxation spectroscopy of lysozyme aqueous solutions: Analysis of the delta-dispersion and the contribution of the hydration water, J. Phys. Chem. B 115 (2011) 7144–7153.
- Doster et al. [1989] W. Doster, S. Cusack, W. Petry, Dynamical Transition of Myoglobin Revealed By Inelastic Neutron-scattering, Nature 337 (1989) 754–756.
- Kay et al. [1989] L. E. Kay, D. A. Torchia, A. Bax, Backbone dynamics of proteins as studied by n inverse detected heteronuclear NMR-spectroscopy - application to staphylococcal nuclease, Biochemistry 28 (1989) 8972–8979.
- Frauenfelder et al. [1991] H. Frauenfelder, S. G. Sligar, P. G. Wolynes, The energy landscapes and motions of proteins, Science 254 (1991) 1598–1603.
- Ban et al. [2011] D. Ban, M. Funk, R. Gulich, D. Egger, T. M. Sabo, K. F. A. Walter, R. B. Fenwick, K. Giller, F. Pichierri, B. L. de Groot, O. F. Lange, H. Grubmüller, X. Salvatella, M. Wolf, A. Loidl, R. Kree, S. Becker, N.-A. Lakomek, D. Lee, P. Lunkenheimer, C. Griesinger, Kinetics of conformational sampling in ubiquitin, Angewandte Chemie (2011) doi: 10.1002/ange.201105086.
- Pethig [1992] R. Pethig, Protein-Water interactions determined by dielectric methods, Annu. Rev. Phys. Chem. 43 (1992) 177–205.
- Chen et al. [2006] S. H. Chen, L. Liu, E. Fratini, P. Baglioni, A. Faraone, E. Mamontov, Observation of fragile-to-strong dynamic crossover in protein hydration water, Proc. Natl. Acad. Sci. U.S.A. 103 (2006) 9012–9016.
- Frauenfelder et al. [2009] H. Frauenfelder, G. Chen, J. Berendzen, P. W. Fenimore, H. Jansson, B. H. McMahon, I. R. Stroe, J. Swenson, R. D. Young, A unified model of protein dynamics, Proc. Natl. Acad. Sci. U.S.A. 106 (2009) 5129–5134.
- Doster et al. [2010] W. Doster, S. Busch, A. M. Gaspar, M. S. Appavou, J. Wuttke, H. Scheer, Dynamical transition of protein-hydration water, Phys. Rev. Lett. 104 (2010) 098101 1–4.
- Jansson et al. [2011] H. Jansson, R. Bergman, J. Swenson, Role of solvent for the dynamics and the glass transition of proteins, J. Phys. Chem. B 115 (2011) 4099–4109.
- Oncley [1938] J. L. Oncley, Studies of the dielectric properties of protein solutions. i. Carboxyhemoglobin, J. Am. Chem. Soc. 60 (1938) 1115–1123.
- Oncley [1942] J. L. Oncley, The Investigation Of Proteins By Dielectric Measurements, Chem. Rev. 30 (1942) 433–450.
- Grant [1962] E. H. Grant, Electrical behaviour of egg albumen solutions at ultra-high frequencies, Nature 196 (1962) 1194–1195.
- Grant [1966] E. H. Grant, Dielectric dispersion in bovine serum albumen, J. Mol. Biol. 19 (1966) 133–139.
- Essex et al. [1977] C. G. Essex, M. S. Symonds, R. J. Sheppard, E. H. Grant, R. Lamote, F. Soetewey, M. Y. Rosseneu, H. Peeters, Five-component dielectric dispersion in bovine serum albumin solution, Phys. Med. Biol. 22 (1977) 1160–1167.
- Pethig and Kell [1987] R. Pethig, D. B. Kell, The passive electrical properties of biological systems - Their significance in physiology, biophysics and biotechnology, Phys. Med. Biol. 32 (1987) 933–970.
- Nandi and Bagchi [1998] N. Nandi, B. Bagchi, Anomalous dielectric relaxation of aqueous protein solutions, J. Phys. Chem. A 102 (1998) 8217–8221.
- Bonincontro et al. [1999] A. Bonincontro, A. De Francesco, G. Onori, Temperature-induced conformational changes of native lysozyme in aqueous solution studied by dielectric spectroscopy, Chem. Phys. Lett. 301 (1999) 189–192.
- Knocks and Weingärtner [2001] A. Knocks, H. Weingärtner, The dielectric spectrum of ubiquitin in aqueous solution, J. Phys. Chem. B 105 (2001) 3635–3638.
- Feldman et al. [2003] Y. Feldman, I. Ermolina, Y. Hayashi, Time domain dielectric spectroscopy study of biological systems, IEEE Trans. Dielectr. Electr. Insul. 10 (2003) 728–753.
- Oleinikova et al. [2004] A. Oleinikova, P. Sasisanker, H. Weingartner, What can really be learned from dielectric spectroscopy of protein solutions? A case study of ribonuclease A, J. Phys. Chem. B 108 (2004) 8467–8474.
- Hasted [1973] J. B. Hasted, Aqueous Dielectrics, Chapman Hall, London, 1973.
- Grant et al. [1978] E. H. Grant, R. J. Sheppard, G. P. South, Dielectric Behaviour of Biological Molecules in Solution, Clarendon Press, Oxford, 1978.
- Pethig [1979] R. Pethig, Dielectric and Electronic Properties of Biological Materials, John Wiley & Sons, Chichester, 1979.
- Lunkenheimer et al. [2000] P. Lunkenheimer, U. Schneider, R. Brand, A. Loidl, Glassy dynamics, Contemp. Phys. 41 (2000) 15–36.
- Lunkenheimer and Loidl [2002] P. Lunkenheimer, A. Loidl, Glassy dynamics beyond the -relaxation, in: F. Kremer, A. Schönhals (Eds.), Broadband dielectric spectroscopy, Springer, Berlin, 2002, pp. 131–169.
- Oncley [1943] J. L. Oncley, The electric moments and relaxation times of proteins as measured from their influence upon the dielectric constants of solutions, in: Proteins, Amino Acids and Peptides, Reinhold Publishing Corporation, New York, 4. edition, 1943.
- Haggis et al. [1951] G. H. Haggis, T. J. Buchanan, J. B. Hasted, Estimation of protein hydration by dielectric measurements at microwave frequencies, Nature 167 (1951) 607–608.
- Buchanan et al. [1952] T. J. Buchanan, G. H. Haggis, J. B. Hasted, B. G. Robinson, The dielectric estimation of protein hydration, Proc. R. Soc. London, Ser. A: Math. Phys. Eng. Sci. 213 (1952) 379–391.
- Schwan [1957] H. P. Schwan, Electrical properties of tissue and cell suspensions, Adv. Biol. Med. Phys. 5 (1957) 147–209.
- Schwan [1965] H. P. Schwan, Electrical properties of bound water, Ann. N.Y. Acad. Sci. 125 (1965) 344–354.
- Grant et al. [1974] E. H. Grant, B. G. R. Mitton, G. P. South, R. J. Sheppard, Investigation by dielectric methods of hydration in myoglobin solutions, Biochem. J. 139 (1974) 375–380.
- Sun et al. [2004] Y. X. Sun, T. Ishida, S. Hayakawa, Dielectric study of heat-denatured ovalbumin in aqueous solution by time domain reflectometry method, J. Agric. Food. Chem. 52 (2004) 2351–2357.
- Grant et al. [1986] E. H. Grant, V. E. R. McClean, N. R. V. Nightingale, R. J. Sheppard, M. J. Chapman, Dielectric behavior of water in biological solutions - studies on myoglobin, human low-density lipoprotein, and polyvinylpyrrolidone, Bioelectromagnetics 7 (1986) 151–162.
- Pennock and Schwan [1969] B. E. Pennock, H. P. Schwan, Further observations on electrical properties of hemoglobin-bound water, J. Phys. Chem. 73 (1969) 2600–2610.
- Shinyashiki et al. [2009] N. Shinyashiki, W. Yamamoto, A. Yokoyama, T. Yoshinari, S. Yagihara, R. Kita, K. L. Ngai, S. Capaccioli, Glass transitions in aqueous solutions of protein (bovine serum albumin), J. Phys. Chem. B 113 (2009) 14448–14456.
- Emmert et al. [2011] S. Emmert, M. Wolf, R. Gulich, S. Krohns, S. Kastner, P. Lunkenheimer, A. Loidl, Electrode polarization effects in broadband dielectric spectroscopy, Eur. Phys. J. B (2011) 157–165.
- Wolf et al. [2011] M. Wolf, R. Gulich, P. Lunkenheimer, A. Loidl, Broadband dielectric spectroscopy on human blood, Biochim. Biophys. Acta. 1810 (2011) 727–740.
- Macdonald et al. [1987] J. R. Macdonald, I. D. Raistrick, D. R. Franceschetti, The Electrical Analogs of Physical and Chemical Processes, in: J. R. Macdonald (Ed.), Impedance Spectroscopy, John Wiley & Sons, New York, 1. edition, 1987, p. 27.
- Canfield [1963] R. E. Canfield, Amino acid sequence of egg white lysozyme, J. Biol. Chem. 238 (1963) 2698–2707.
- Takashima and Asami [1993] S. Takashima, K. Asami, Calculation and measurement of the dipole-moment of small proteins - Use of protein data-base, Biopolymers 33 (1993) 59–68.
- Böhmer et al. [1989] R. Böhmer, M. Maglione, P. Lunkenheimer, A. Loidl, Radio-frequency dielectric measurements at temperatures from 10 K to 450 K, J. Appl. Phys. 65 (1989) 901–904.
- Schneider et al. [2001] U. Schneider, P. Lunkenheimer, A. Pimenov, R. Brand, A. Loidl, Wide range dielectric spectroscopy on glass-forming materials: an experimental overview, Ferroelectrics 249 (2001) 89–98.
- Miura et al. [1994] N. Miura, N. Asaka, N. Shinyashiki, S. Mashimo, Microwave dielectric study on bound water of globule proteins in aqueous solution, Biopolymers 34 (1994) 357–364.
- Kaatze [1989] U. Kaatze, Complex permittivity of water as a function of frequency and temperature, J. Chem. Eng. Data 34 (1989) 371–374.
- Debye [1929] P. Debye, Polar molecules, Dover Publications, Inc., New York, 1929.
- Sillescu [1999] H. Sillescu, Heterogeneity at the glass transition: a review, J. Non-Cryst. Solids 243 (1999) 81–108.
- Ediger [2000] M. D. Ediger, Spatially heterogeneous dynamics in supercooled liquids, Annu. Rev. Phys. Chem. 51 (2000) 99–128.
- Havriliak and Negami [1966] S. Havriliak, S. Negami, A complex plane analysis of alpha-dispersions in some polymers, J. Polym. Sci. C: Polym. Symp 14 (1966) 99–117.
- Havriliak and Negami [1967] S. Havriliak, S. Negami, A complex plane analysis of dielectric and mechanical relaxation process in some polymers, Polymer 8 (1967) 161–210.
- Cole and Cole [1941] K. S. Cole, R. H. Cole, Dispersion and absorption in dielectrics, J. Chem. Phys. 9 (1941) 341–351.
- Davidson and Cole [1950] D. W. Davidson, R. H. Cole, Dielectric relaxation in glycerine, J. Chem. Phys. 18 (1950) 1417–1417.
- Cole and Davidson [1952] R. H. Cole, D. W. Davidson, High frequency dispersion in n - propanol, J. Chem. Phys. 20 (1952) 1389 –1391.
- Höchli et al. [1990] U. T. Höchli, K. Knorr, A. Loidl, Orientational glasses, Adv. Phys. 39 (1990) 405–615.
- Collie et al. [1948] C. H. Collie, J. B. Hasted, D. M. Ritson, The dielectric properties of water and heavy water, Proc. Phys. Soc. London 60 (1948) 145–160.
- Mattar and Buckmaster [1990] K. E. Mattar, H. A. Buckmaster, 25∘C complex permittivity of water from 65 to 75 GHz, J. Phys. D: Appl. Phys. 23 (1990) 1464–1467.
- Grant and Sheppard [1974] E. H. Grant, R. J. Sheppard, Dielectric-Relaxation In Water In Neighborhood Of 4∘C, J. Chem. Phys. 60 (1974) 1792–1796.
- Schwan et al. [1976] H. P. Schwan, R. J. Sheppard, E. H. Grant, Complex permittivity of water at 25∘C, J. Chem. Phys. 64 (1976) 2257–2258.
- Khodadadi et al. [2008] S. Khodadadi, S. Pawlus, A. P. Sokolov, Influence of Hydration on Protein Dynamics: Combining Dielectric and Neutron Scattering Spectroscopy Data, Journal of Physical Chemistry B 112 (2008) 14273–14280.
- Ellison et al. [1996] W. J. Ellison, K. Lamkaouchi, J. M. Moreau, Water: A dielectric reference, J. Mol. Liq. 68 (1996) 171–279.
- Ediger et al. [1996] M. D. Ediger, C. A. Angell, S. R. Nagel, Supercooled liquids and glasses, J. Phys. Chem. 100 (1996) 13200–13212.
- Ngai [2000] K. L. Ngai, Dynamic and thermodynamic properties of glass-forming substances, J. Non-Cryst. Solids 275 (2000) 7–51.
- Angell [2008] C. A. Angell, Insights into phases of liquid water from study of its unusual glass-forming properties, Science 319 (2008) 582–587.
- Mashimo et al. [1987] S. Mashimo, S. Kuwabara, S. Yagihara, K. Higasi, Dielectric relaxation time and structure of bound water in biological materials, J. Phys. Chem. 91 (1987) 6337–6338.
- Frauenfelder [2010] H. Frauenfelder, Proteins, supercooled liquids, and glasses: A micro-review, Physica E: Low-dim. Sys. Nanostruc. 42 (2010) 662–665.
- Young and Fenimore [2011] R. D. Young, P. W. Fenimore, Coupling of protein and environment fluctuations, Biochim. Biophys. Acta, Proteins & Proteomics 1814 (2011) 916–921.
- Angell [1983] C. A. Angell, Supercooled water, Annual Review of Physical Chemistry 34 (1983) 593–630.
- Korson et al. [1969] L. Korson, Drosthan.W, F. J. Millero, Viscosity of water at various temperatures, J. Phys. Chem. 73 (1969) 34–39.
- Chirico et al. [1999] G. Chirico, S. Beretta, G. Baldini, Conformation of interacting lysozyme by polarized and depolarized light scattering, J. Chem. Phys. 110 (1999) 2297–2304.
- Parmar and Muschol [2009] A. S. Parmar, M. Muschol, Hydration and hydrodynamic interactions of lysozyme: Effects of chaotropic versus kosmotropic ions, Biophysical Journal 97 (2009) 590–598.
- Wilkins et al. [1999] D. K. Wilkins, S. B. Grimshaw, V. Receveur, C. M. Dobson, J. A. Jones, L. J. Smith, Hydrodynamic radii of native and denatured proteins measured by pulse field gradient NMR techniques, Biochemistry 38 (1999) 16424–16431.
- Sassi et al. [2011] P. Sassi, S. Perticaroli, L. Comez, L. Lupi, M. Paolantoni, D. Fioretto, A. Morresi, Reversible and irreversible denaturation processes in globular proteins: from collective to molecular spectroscopic analysis, Journal of Raman Spectroscopy (2011) DOI: 10.1002/jrs.3013.
- Perticaroli et al. [2010] S. Perticaroli, L. Comez, M. Paolantoni, P. Sassi, L. Lupi, D. Fioretto, A. Paciaroni, A. Morresi, Broadband depolarized light scattering study of diluted protein aqueous solutions, Journal of Physical Chemistry B 114 (2010) 8262–8269.
- Böttcher and Bordevijk [1980] C. J. F. Böttcher, P. Bordevijk, Theory of Electric Polarization, volume 2, Elsevier, Amsterdam, 1 edition, 1980.
- Frauenfelder et al. [1979] H. Frauenfelder, G. A. Petsko, D. Tsernoglou, Temperature-dependent x-ray-diffraction as a probe of protein structural dynamics, Nature 280 (1979) 558–563.
- Elber and Karplus [1987] R. Elber, M. Karplus, Multiple conformational states of proteins - a molecular-dynamics analysis of myoglobin, Science 235 (1987) 318–321.
- Stickel et al. [1996] F. Stickel, E. W. Fischer, R. Richert, Dynamics of glass-forming liquids. 2. Detailed comparison of dielectric relaxation, dc-conductivity, and viscosity data, J. Chem. Phys. 104 (1996) 2043–2055.
- Johari and Andersson [2006] G. P. Johari, O. Andersson, On the nonlinear variation of dc conductivity with dielectric relaxation time, J. Chem. Phys. 125 (2006) 124501.