Electronic address: ]okamura@kobe-u.ac.jp Present address: ] UVSOR Facility, Institute for Molecular Science, Okazaki 444-8585, Japan
Pressure suppression of unconventional charge-density-wave
state in PrRu4P12
studied by optical conductivity
Abstract
Optical conductivity [] of PrRu4P12 has been studied under high pressure to 14 GPa, at low temperatures to 8 K, and at photon energies 12 meV-1.1 eV. The energy gap in at ambient pressure, caused by a metal-insulator transition due to an unconventional charge-density-wave formation at 63 K, is gradually filled in with increasing pressure to 10 GPa. At 14 GPa and below 30 K, exhibits a pronounced Drude-type component due to free carriers. This indicates that the initial insulating ground state at zero pressure has been turned into a metallic one at 14 GPa. This is consistent with a previous resistivity study under pressure, where the resistivity rapidly decreased with cooling below 30 K at 14 GPa. The evolution of electronic structure with pressure is discussed in terms of the hybridization between the 4 and conduction electrons.
pacs:
I Introduction
The metal-insulator (MI) transition in PrRu4P12 has attracted a great amount of attention since its discovery.sekine PrRu4P12 has the filled skutterudite structure, where a Pr atom is contained in a cage-shaped P12 molecule. Due to the large coordination number, the hybridization between the Pr 4 electrons and the conduction electrons, the latter of which are mainly P 3 electrons, is expected to be stronger than in many other Pr compounds. This property has made PrRu4P12 an attractive stage to study the interaction between 4 configuration with the conduction electrons. The MI transition is observed at =63 K, below which the electrical resistivity () shows a sharp upturn.sekine ; saha With a single crystal sample, increased by a factor of 400 from to 2 K.saha From the analysis of data, the magnitude of the energy gap was estimated to be 7 meV.sekine In addition, the development of an energy gap was clearly observed in the measured optical conductivity [] spectrum.matunami
In discussing the mechanism for this transition, it was pointed out from band calculations that the Fermi surface (FS) of PrRu4P12 should have a cube-like shape, with a strong tendency for three dimensional (3D) nesting.harima1 ; harima2 In fact, superlattice formation below was observed by diffraction experiments.lee However, the non-magnetic reference LaRu4P12 did not show a similar transition, although a very similar FS was expected.harima1 ; harima2 This fact, together with the neutroniwasa1 ; iwasa2 and Ramanogita experiments, strongly suggested the importance of conduction ()- electron hybridization in the MI transition. With theoretical considerations,takimoto ; shiina1 ; shiina2 it is currently believed that a novel charge density wave (CDW) formation is responsible for the MI transition. Unlike the conventional CDW where the spatial modulation is provided by strong electron-lattice coupling, in the CDW of PrRu4P12 the modulation is provided by the formation of two Pr sublattices, where the crystal field-split 4 level scheme in one sublattice is different from that in the other.iwasa1 ; iwasa2 ; ogita The microscopic nature of the - hybridized electronic structure deserves further studies.
The MI transition in PrRu4P12 has been found to be sensitive to external pressure ().shirotani ; miyake1 ; miyake2 With increasing up to 8 GPa, the increase of below becomes gradually smaller.shirotani At 12 GPa, a small upturn of is still seen below 60 K, but a rapid decrease of follows with further cooling below 30 K.miyake2 An external pressure is expected to reduce both the Pr-P and Pr-Pr distances, and is hence expected to affect the - hybridization and the CDW state. It is therefore quite interesting to probe the evolution of with .
In this work, we have studied of PrRu4P12 under high pressure to 14 GPa and at low temperatures () to 8 K. The obtained spectra show that the well developed energy gap at ambient pressure and at low is gradually filled in with increasing pressure up to 10 GPa. At 14 GPa and at 8 K, the energy gap is almost absent and shows a pronounced Drude-type spectral shape due to free carriers. This result indicates that the electronic structure of PrRu4P12 at this and range is indeed metallic.
II Experimental
of a sample at high pressure was obtained from the analysis of a reflectance spectrum, , measured with a diamond anvil cell (DAC).ybs ; airapt ; CeRu4Sb12 ; heavy ; Yb-metal A pair of diamond anvils with 0.6 mm culet diameter and a metal gasket (stainless steel 301) were used to seal the sample, pressure transmitting medium, and small ruby pieces used to monitor the pressure via its fluorescence.airapt A flat, as-grown surface of a single crystal samplesaha was closely attached on the culet surface of the anvil, which was of type IIa with low density of impurities. The pressure-transmitting medium used was glycerin.medium A gold film was also placed between the gasket and anvil as a reference of reflectance. Due to the small size of the sample and the restricted sample space in a DAC, synchrotron radiation was used as a highly oriented and bright infrared (IR) source. The high pressure studies were made mainly at the beam line BL43IR of SPring-8micro1 ; micro2 at photon energies between 20 meV and 1.1 eV. Above 1.1 eV, the reflectance at ambient temperature and pressurematunami was used. Additional measurements at lower photon energies to 12 meV were also made at the beam line U2A of National Synchrotron Light Source.u2a In the experiments, the pressure was increased at room to a desired value, and then was lowered while keeping the desired pressure. A liquid He continuous-flow cryostat was used to cool the DAC. More details of the high pressure IR experiments can be found elsewhere.ybs ; airapt ; CeRu4Sb12 The measurement without using a DAC was previously described.my_review ; ybb12 ; ybal3
III Results and Discussion
III.1 data at high pressure
Figure 1 summarizes data measured at =0, 8, 10, and 14 GPa.
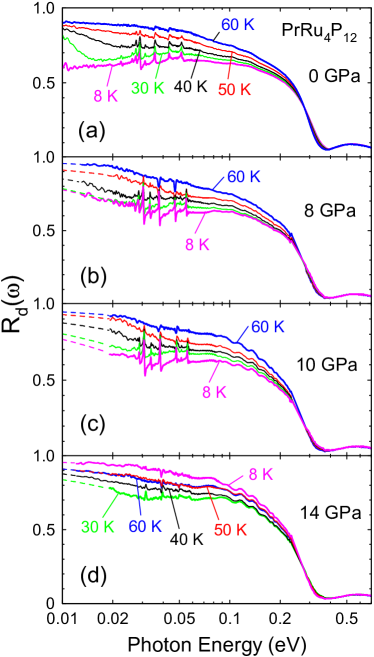
These spectra were obtained with the following procedures. The reflectance in vacuum, , were first measured without using a DAC over a wide photon energy range between 6 meV and 30 eV.matunami The usual Kramers-Kronig (KK) transformdressel ; wooten was applied to the to obtain the complex refractive index . was then used to derive the reflectance spectrum, , that was expected in a DAC, taking into account the refractive index of diamond (2.4) as previously discussed.ybs ; airapt ; CeRu4Sb12 ; heavy The data at =0 in Fig. 1(a) are the results of this analysis. In the high pressure studies, the relative changes of with varying and were measured with DAC, and were then multiplied by the expected at =0 discussed above, to obtain the spectra at high pressure. This procedure was taken since it was technically difficult to accurately determine the absolute value of in a DAC, due to strong diffraction of the long wavelength IR radiation off the small sample.footnote3 For technical reason, lower-energy measurements to 12 meV were made only at =8, 40, and 60 K and at = 8 and 14 GPa. For other values of and , the measurements were made to 20 meV only. In the =0 data of Fig. 1(a), progressively decreases with cooling below 60 K. This is due to the development of energy gap upon the MI transition.matunami At = 8 GPa, a decrease of with cooling is still observed, but is much less pronounced below 40 K and 20 meV. At 10 GPa, the data are very similar to those at 8 GPa. At 14 GPa, however, the decrease of with cooling from 60 to 30 K is much smaller than those seen at lower , and then considerably increases with cooling from 30 to 8 K.irizawa It is quite clear that the dependence at 14 GPa is qualitatively very different from those at lower .
III.2 data at high pressure
To derive from the data at high pressure measured with DAC, a modified KK analysis was performed on taking into account the effects of sample/diamond interface as previously described in detail.KK-dia To extrapolate the measured spectra at the lower energy end, a Hagen-Rubens functiondressel ; wooten was used. At the higher energy side, spectra were cut off at 2.2 eV, above which they were extrapolated with a function of the form . The cutoff energy of 2.2 eV was chosen so that the obtained from the modified KK analysis of the expected at ambient [Fig. 1(a)] agreed with that obtained from the usual KK analysis of up to 30 eV measured without DAC.KK-dia
Figure 2 summarizes the obtained spectra at high pressure.
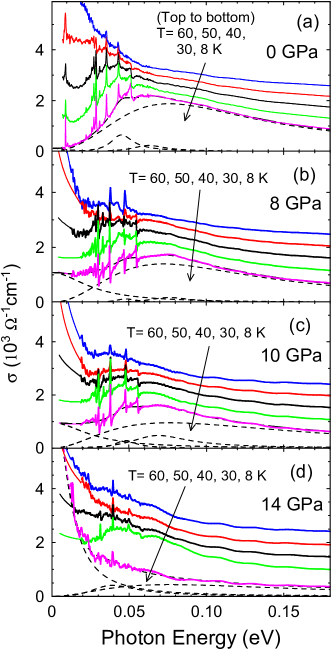
(The =0 data were obtained from with the usual KK analysis.) At =0, shows a rapid decrease and depletion of spectral weight below 40 meV with cooling, and at 8 K, it shows a well developed energy gap as described previously.matunami (Note that each spectrum in Fig. 2 is vertically offset for clarity.) The onset of suggests a gap magnitude of about 10 meV, which is close to the transport gap of 7 meV given by .sekine In addition to the gap, a broad peak centered around 50 meV is observed, where sharp optical phonon peaks are superimposed. This broad peak should result from optical excitation of electrons across the energy gap, and will be referred to as the “gap excitation peak”. At 8 GPa, below 50 meV still shows spectral depletion with cooling, similar to that at =0. However, the depletion is now smaller than at =0 and does not approach zero at the low-energy side. Namely, at 8 GPa has only an incomplete, partially filled energy gap even at low . at 10 GPa shows similar evolutions to those at 8 GPa. at 14 GPa, however, shows very different evolutions. Namely, at 14 GPa shows only small spectral depletion with cooling at =30-50 K. At 8 K, then, shows a marked increase toward zero energy, which is clearly a free carrier component due to Drude-type response, and it does not show a clear energy gap any more. Furthermore, the phonon peaks in have become much weaker, which should result from an increased Coulomb screening of polarization due to a larger number of free carriers. Clearly, the electronic structure of PrRu4P12 at 14 GPa and 8 K is metallic.
The observed and evolutions of show good correspondence with those of .shirotani ; miyake1 Namely, the steep rise of below at =0 is progressively suppressed with increasing .shirotani This is most likely due to the filling of energy gap with observed in . On the other hand, the upturn of is still observed near 60 K even at 8 GPa,shirotani which is consistent with the result that spectral depletion in is still clearly observed at 8 GPa. At 14 GPa, still shows small increase with cooling at 30-60 K range, but it then rapidly decreases with further cooling. These behaviors of again correspond well to the variation of . Namely, still shows a small depletion below 40 meV with cooling from 50 to 30 K, but then shows a strong Drude-type component at 8 K. Namely, both and at 14 GPa still seem to show a tendency toward gap formation at 30-60 K range, but then they show very metallic characteristics at 8 K.
Figure 3 shows the dependence of at 8 K.
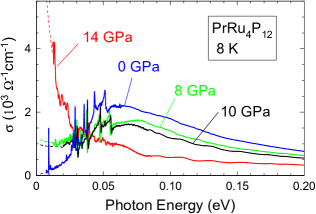
With increasing , the filling of energy gap and the transfer of spectral weight are evident. To analyze these evolutions more quantitatively, we have performed a Drude-Lorentz spectral fitting.dressel ; wooten The fitting model for a Lorentz oscillator is expressed as
| (1) |
where is the plasma frequency and is the damping (scattering) frequency. The Drude oscillator is given by setting =0. In the fitting, a linear combination of several oscillators was used, and the sharp phonon peaks were not taken into account. The results of the fitting are indicated by the broken curves in Fig. 2. The peak position () and the spectral weight [, which is the area of ] of the oscillators resulting from the fitting are plotted in Fig. 4.
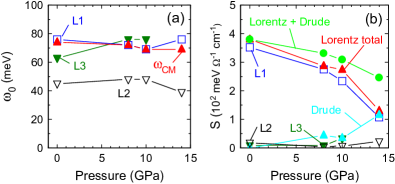
As indicated in Fig. 2, three Lorentz oscillators (denoted as L1, L2, and L3 in Fig. 4) were necessary to systematically fit the gap excitation peak at different . Lorentz oscillators were necessary even for the 14 GPa data, where the Drude component was dominant. To determine the position of the gap excitation peak and its shifts with , we adapted a previously reported method used to analyze a CDW gap.RTe1 ; RTe2 ; RTe3 ; RTe4 Namely, the center-of-mass energy () of the three Lorentz oscillators used in the fitting, defined as where denotes L1, L2, and L3, was regarded as the peak position. As shown in Fig. 4, the obtained decreases only slightly with even at 14 GPa. In contrast, (Lorentz total) decreases much more strongly with . In addition, the combined (Drude + Lorentz) also decreases with , which suggests a spectral weight transfer to above the mid-infrared range.
The transfer of spectral weight in can also be discussed using the effective carrier density , where and are the density and effective mass of the electrons. contributing to below is given by . Figure 5 plots at various values of and .
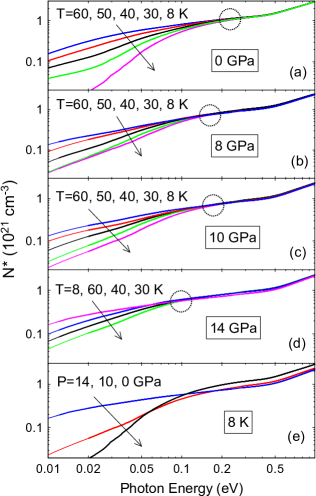
At =0 [Fig. 5(a)], the depletion of spectral weight with gap opening at low significantly decreases . In addition, the spectra at different temperatures almost merge at 0.2-0.3 eV range. The energy range indicated by the circle in Fig. 5(a) shows such a merging. Note that the merging energy is a few times larger than , and that the lost by the gap formation does not recover until such high energies. This unusual result may also indicate an unconventional nature of this transition. With increasing , the merging energy is seen to shift to lower energy, as indicated in Figs. 5(b)-5(d). This shift shows that the energy range of spectral weight redistribution is also decreased as the energy gap is filled in with . Note that, at 14 GPa, still decreases from 50 K to 30 K, which corresponds to the above-mentioned, remaining tendency toward gap formation. Note also that the value above the merging energy decreases at high , which corresponds to the result in Fig. 4 that the total (Drude+Lorentz) decreases with .
III.3 Microscopic consideration on the energy gap and CDW state
As already mentioned, the magnitude of transport gap at =0 given by data is =7 meV,sekine and the onset of is at 10 meV. and the onset energy are close to each other, and they should correspond to a gap in the total density of states (DOS). In contrast, 70 meV of the gap excitation peak is much larger. Since the relationship between and is unclear from the data only, we shall compare them with the results of microscopic theories.takimoto ; shiina1 ; shiina2 In the theory of Ref. shiina2, , the Hamiltonian for PrRu4P12 contains the - hybridization energy (), the bare crystal field (CF) at the Pr site (), and the intersite - coupling energy () as the relevant parameters. For simplicity, only two levels among the CF-split multiplets of Pr 4, namely the singlet () and triplet () levels, are assumed as the electron states.shiina2 This choice is made since they are the two lowest-lying CF levels observed experimentally.iwasa1 ; iwasa2 ; ogita Above , all the Pr atoms are equivalent with singlet ground state. At =0, due to the 3D nesting of FS and the - hybridization, the ground state of this Hamiltonian is a CDW with two inequivalent Pr sublattices having triplet and singlet ground states.footnote4
The phase diagram derived from the above modelshiina2 is schematically shown in Fig. 6(a). It is obtained from the mean-field (MF) solution to the Hamiltonian, and is expressed in terms of and the effective CF, .
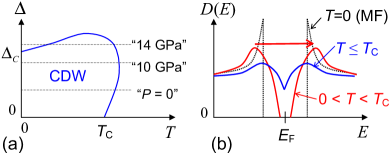
Note that, for a range of , there is a possibility of successive, reentrant phase transitions with cooling. The DOS as a function of energy, , at finite is calculated with the coherent potential approximation, taking into account the thermal fluctuation of electron between the two CF levels.shiina2 The predicted is schematically shown in Fig. 6(b). It is seen that, with increasing , the sharp DOS peaks associated with the =0 (MF) gap are broadened, and the gap magnitude becomes much smaller, due to the thermal fluctuations. Clearly, the smaller gap in the total DOS should correspond to the transport gap and the onset of . The optical transition between the remaining peaks in the DOS, indicated by the horizontal (red) arrow in Fig. 6(b), corresponds well to the observed gap excitation peak in . In fact, the calculated shows a broad peak and an onset,shiina2 where the peak energy of the former is several times larger than the latter in good agreement with the measured . The magnitude of CDW gap given by the MF theory is 3.5 ,gruner which is 19 meV from =63 K. Hence, the observed onset of 10 meV is about twice smaller, and about three times larger, than the MF gap.
Note that the wide MF gap with the function-like peaks in DOS, predicted at =0 as shown in Fig. 6(b), is never realized experimentally with real materials, even if is measured at much lower than 8 K. This is due to broadening casued by various extrinsic factors, such as crystal imperfection, present in real materials. Hence, the observed smaller transport gap than should be a result of a combination of such broadenings and the thermal fluctuation of the electrons discussed above. In any case, the model clearly shows that the evolution of the transport gap is not necessarily synchronous with that of the peak in . In particular, even when the transport gap is already suppressed, a peak in may still remain, if the peak in DOS still exists. Such a situation may correspond to the observed at 14 GPa and 8 K: namely, although the Drude component is dominant and there is no clear energy gap, a Lorentz component is still present, as already discussed. The presence of a peak in does not necessarily indicates the presence of a gap in the total DOS.
External pressure decreases the Pr-P distance, which should apparently increase , and should also increase since the electrons are from the P 3 state.harima1 ; harima2 In addition, the pressure also decreases the Pr-Pr distance, which should increase the intersite coupling . Therefore, external pressure should affect all of , and , so it is not obvious how the effective CF, , changes with pressure. However, it has been suggested that the pressure should in fact increase ,shiina2 based on comparison between the predicted phase diagram [Fig. 6(a)] and the data under pressure. This also applies well to data, since the and variations of show very good correspondence with those of , as already discussed. Note that the phase boundary near the vertical axis in Fig. 6(a) is predicted to be of first order.shiina2 This seems consistent with the and data at 14 GPa since the changes (increases) in and from 30 to 8 K are much larger than the gradual changes from 60 to 30 K. Based on these considerations, suggested lines corresponding to =0, 10, and 14 GPa are schematically indicated in Fig. 6(a). From the theory, it is expected that the gap excitation peak should shift to lower energy with increasing , and hence with increasing .shiina2 This is in contrast to the observed, only slight decrease of with . This will be discussed again later.
III.4 Comparison with other CDW systems
Optical responses of more conventional CDW states driven by electron-lattice coupling have been studied extensively.gruner For example, of a series of compounds Te3 (: rare earths) have been studied recently.RTe2 ; RTe3 ; RTe4 A peak was commonly observed in their spectra, whose energy was identified as the CDW gap magnitude. The peak shifted to lower energy, and hence the CDW gap decreased, with lattice contraction given by different elementsRTe1 ; RTe2 and also by external pressure.RTe2 ; RTe3 ; RTe4 In contrast, as already mentioned, the gap excitation peak of PrRu4P12 decreases only slightly with . The reason for this behavior is unclear at the present, and it may point to the unconventional nature of CDW state in this compound. The almost unshifted gap excitation peak and the progressive decrease of its spectral weight with may suggest a possibility that, while the gap magnitude remains unchanged, the fraction of FS that is gapped may decrease with . Such a concept has been applied to analyze the optical data of the Te3 compounds.RTe1 ; RTe2 ; RTe3 ; RTe4 In the case of Te3 with layered crystal structure, the CDW had a strong 2D character, driven by a 2D nesting of FS. As a result, the FS nesting was not complete and only a part of FS was gapped. In contrast, the nesting in PrRu4P12 is of 3D characterharima1 ; harima2 as already mentioned, and the energy gap at =0 is a full gap over the entire FS. Therefore, the above mentioned situation, namely the gap survives at some portion of the FS while it closes at other portion, seems unlikely for PrRu4P12.
Finally, it is also unlikely that the suppression of CDW state in PrRu4P12 is driven by a change of FS topology by pressure. In the pressure range of this work, PrRu4P12 does not undergo a structural phase transition and its crystal symmetry is unchanged with pressure. Although other parameters such as , and may change with pressure, the FS topology itself and the tendency for nesting should basically remain unchanged.harima3 This may be also different from the cases of 1D and 2D CDW compounds, where the low dimensionality may play an additional role for the external pressure to affect the FS topology.
IV Conclusion
The spectrum of PrRu4P12 has been measured under high pressure to 14 GPa and at low temperatures to 8 K, over a photon energy range of 12 meV-1.1 eV. The energy gap in associated with the insulating, unconventional CDW state at ambient pressure is progressively filled in with increasing pressure. At 14 GPa and 8 K, exhibits a strong Drude component due to free carriers, and the energy gap is almost absent. Our finding confirms the appearance of metallic state that had been suggested by data under pressure. Effects of pressure on the - hybridization and the unconventional CDW state has been discussed based on our data as well as microscopic theories for PrRu4P12.
Acknowledgements.
The experiments at SPring-8 have been made under the approval by JASRI (2009A0089 through 2011B0089). Financial support from MEXT (“Heavy Electron” 21102512-A01) is acknowledged. U2A beamline is supported by NSF (EAR 10-43050, COMPRES), and DOE/NNSA (DE-FC03-03N00144,CDAC). NSLS is supported by the DOE/BES (DE-AC02-98CH10886). H. O. would like to thank R. Shiina, H. Harima, and Y. Aoki for useful discussions.References
- (1) C. Sekine, T. Uchiumi, I. Shirotani, and T. Yagi, Phys. Rev. Lett. 79, 3218 (1997).
- (2) S. R. Saha, H. Sugawara, T. Namiki, Y. Aoki, and H. Sato, Phys. Rev. B 80, 014433 (2009).
- (3) M. Matsunami, L. Chen, M. Takimoto, H. Okamura, T. Nanba, C. Sekine, and I. Shirotani, Phys. Rev. B 72, 073105 (2005).
- (4) H. Harima and K. Takegahara, Physica B 312-313, 843 (2002).
- (5) H. Harima, J. Phys. Soc. Jpn. 77 Suppl. A, p114 (2008).
- (6) C. H. Lee, H. Matsuhata, H. Yamaguchi, C. Sekine, K. Kihou, T. Suzuki, T. Noro, and I. Shirotani, Phys. Rev. B 70, 153105 (2004).
- (7) K. Iwasa, L. Hao, K. Kuwahara, M. Kohgi, S. R. Saha, H. Sugawara, Y. Aoki, H. Sato, T. Tayama, and T. Sakakibara, Phys. Rev. B 72, 024414 (2005).
- (8) K. Iwasa, L. Hao, T. Hasegawa, T. Takagi, K. Horiuchi, Y. Mori, Y. Murakami, K. Kuwahara, M. Kohgi, H. Sugawara, S. R. Saha, Y. Aoki, and H. Sato, J. Phys. Soc. Jpn. 74, 1930 (2005).
- (9) N. Ogita, M. Udagawa, S. R. Saha, H. Sato, and H. Sugawara, Physica B 378-380, 206 (2006).
- (10) T. Takimoto, J. Phys. Soc. Jpn. 75, 034714 (2006).
- (11) R. Shiina, J. Phys. Soc. Jpn. 77, 083705 (2008).
- (12) R. Shiina, J. Phys. Soc. Jpn. 78, 104722 (2009).
- (13) I. Shirotani, J. Hayashi, T. Adachi, A. Matsushita, and T. Matsumoto, Physica B 322, 408 (2002).
- (14) A. Miyake, K. Shimizu, C. Sekine, K. Kihou, and I. Shirotani, J. Phys. Soc. Jpn. 73, 2370 (2004).
- (15) A. Miyake, A. T. Homes, T. Kagayama, K. Shimizu, C. Sekine, I. Shirotani, D. Kikuchi, H. Sugawara, and H. Sato, Physica B 403, 1298 (2008).
- (16) M. Matsunami, H. Okamura, A. Ochiai, and T. Nanba, Phys. Rev. Lett. 103, 237202 (2009).
- (17) H. Okamura, M. Matsunami, R. Kitamura, S. Ishida, A. Ochiai, and T. Nanba, J. Phys. Conf. Ser. 125, 012051 (2010).
- (18) H. Okamura, K. Senoo, M. Matsunami, and T. Nanba, J. Phys. Soc. Jpn. 76 Suppl. A, pp9 (2007).
- (19) H. Okamura, I. Matsutori, A. Takigawa, K. Shoji, M. Kiyata, M. Matsunami, H. Sugawara, H. Sato, C. Sekine, I. Shirotani, T. Moriwaki, Y. Ikemoto, and T. Nanba, J. Phys. Soc. Jpn. 80, SA092 (2011).
- (20) H. Okamura, R. Kitamura, M. Matsunami, H. Sugawara, H. Harima, H. Sato, T. Moriwaki, Y. Ikemoto, and T. Nanba, J. Phys. Soc. Jpn. 80, 084718 (2011).
- (21) T. Tateiwa and Y. Haga, Rev. Sci. Instr. 80, 123901 (2009).
- (22) Y. Ikemoto, T. Moriwaki, T. Hirono, S. Kimura, K. Shinoda, M. Matsunami, N. Nagai, T. Nanba, K. Kobayashi, and H. Kimura, Infrared Phys. Tech. 45, 369 (2004).
- (23) T. Moriwaki and Y. Ikemoto, Infrared Phys. Tech. 51, 400 (2008).
- (24) Z. Liu, J. Hu, H. Yang, H. Mao, and R. Hemley, J. Phys.: Condens. Matter 14, 10641 (2002).
- (25) H. Okamura, Chapter 4 in Optical Techniques for Solid-State Materials Characterization, edited by R. P. Prasankumar and A. J. Taylor (CRC Press, Boca Raton, 2011).
- (26) H. Okamura, S. Kimura, H. Shinozaki, T. Nanba, F. Iga, N. Shimizu, and T. Takabatake, Phys. Rev. B 58, R7496 (1998).
- (27) H. Okamura, T. Michizawa, T. Nanba, and T. Ebihara, J. Phys. Soc. Jpn. 73, 2045 (2004).
- (28) M. Dressel and G. Grüner, Electrodynamics of Solids (Cambridge University Press, Cambridge, 2002).
- (29) F. Wooten, Optical Properties of Solids (Academic Press, New York, 1972).
- (30) An increase of reflectance at high pressure was previously reported by A. Irizawa, K. Shimai, K. Sato, M. Kobayashi, T. Murakami, H. Okamura, T. Nanba, M. Matsunami, C. Sekine, and I. Shirotani, J. Phys. Soc. Jpn. 77 Suppl. A, pp. 214 (2008). The reported magnitudes of and at high pressure in that work are inaccurate since the effects of diamond refractive index were not considered in deriving them.
- (31) The deviation between the actually measured in DAC and that calculated from the was within 20 % in the spectral range above 50 meV. Below 50 meV, in contrast, the former decreased with decreasing photon energy due to diffraction, to about 60 % magnitude of the latter at 20 meV. Nevertheless, the relative variation actually measured in DAC agreed reasonably well with the calculated ones from the variations of , as previously demonstrated.CeRu4Sb12
- (32) H. Okamura, arXiv:1201.2730 (2012).
- (33) G. Grüner, Rev. Mod. Phys. 60, 1129 (1988).
- (34) A. Sacchetti, L. Degiorgi, T. Giamarchi, N. Ru, and I. R. Fisher, Phys. Rev. 74, 125115 (2006).
- (35) A. Sacchetti, E. Arcangeletti, A. Perucchi, L. Baldassarre, P. Postorino, S. Lupi, N. Ru and I. R. Fisher, and L. Degiorgi, Phys. Rev. Lett. 98, 026401 (2007).
- (36) M. Lavagnini, A. Sacchetti, L. Degiorgi, E. Arcangeletti, L. Baldassarre, P. Postorino, S. Lupi, A. Perucchi, K. Y. Shen, and I. R. Fisher, Phys. Rev. 77, 165132 (2008).
- (37) M. Lavagnini, A. Sacchetti, C. Marini, M. Valentini, R. Sopracase, A. Perucchi, P. Postorino, S. Lupi, J.-H. Chu, I. R. Fisher, and L. Degiorgi, Phys. Rev. 79, 075117 (2009).
- (38) The experimentally observed singlet-triplet splitting is 8 meV above , and 3 meV and 10 meV for the triplet and singlet ground states at 5 K, respectively.iwasa1 ; iwasa2 ; ogita
- (39) H. Harima, private communication.