Report on strangeness photoproduction experiments performed with the Neutral Kaon Spectrometer 2.
Abstract
An experiment designed to investigate the strangeness photoproduction process using a tagged photon beam in the energy range of 0.90 -1.08 GeV incident on a liquid deuterium target was successfully performed. The purpose of the experiment was to measure the production of neutral kaons and the lambda particles on a deuteron. The generation of photo produced particles was verified by the measurement of their decayed charged particles in the Neutral Kaon Spectrometer 2. The reconstructed invariant mass distributions were achieved by selecting events where two or more particles tracks were identified. Preliminary results are presented here.
pacs:
2633, 2638, 26581 Introduction
The reaction of interest discussed in this report is the photoproduction of neutrally charged strange particles, and , from a deuteron target. The strangeness production processes by the electromagnetic interaction can be used as a probe to bestow indispensable information on the strengths of meson-baryon coupling and internal structure of hadrons with the strangeness as a degree of freedom[1] . The exploration into the strangeness production mechanism in the threshold region allows for the frontier of physics to be explored particularly concerning the experimental measurement of the photo-produced particle’s momentum and angular distribution.
As a result of the series of the NKS experiments [2] [3], the re-envisioned Neutral Kaon Spectrometer, NKS2, was newly designed and constructed at the Laboratory of Nuclear Science of Tohoku University (LNS) in 2004, replacing an original version, NKS. Its main purpose is to investigate the photo-production process, particularly the production of neutral strange particles via single and measurement with acceptance less biased at the forward region compared with that of the NKS spectrometer. It was further renovated in 2008 with the addition of a new inner detectors and hence forth is referred to as the NKS2+.
2 The NKS2+ Spectrometer System
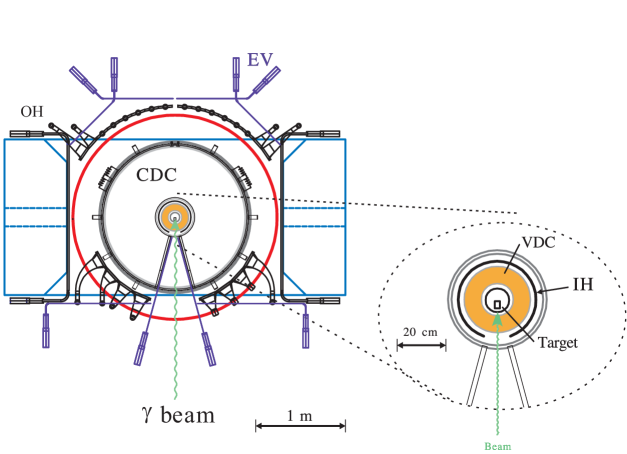
The NKS2+ is composed of a cryogenic target system located in the center of various detector systems that works in tandem with a photon tagging array. It is positioned along the fourth bending magnet (BM4) in the second experimental hall at the ELPH facility. Using a carbon wire as a target, a photon beam is produced via the electromagnetic interaction with the electrons orbiting in the Stretcher Booster Ring (STB) in the form of the bremsstrahlung radiation. The STB ring is capable of accelerating electrons injected from a 0.15 GeV Linac injector up to 1.2 GeV. The photon beam is guided through a collimator in order to reduce the beam halo, a sweep magnet, and into the NKS2+ and is bombarded on the target located in the spectrometer. Moving from the inner most position outwards, is the target which is surrounded by a Vertex Drift Chamber (VDC) and a Inner Hodoscope comprised of twenty plastic scintillator segments (IH), which acts as the initiation time trigger for time of flight measurements. These pair of detectors are then surrounded and fully enclosed in a Cylindrical Drift Chamber (CDC). All detectors are themselves located in between the poles of a dipole magnet with 680 mm aperture.
3 Data summary and analysis procedure
3.1 Trigger
Our data acquisition utilized the UNIDAQ on Linux as a core system . The main trigger utilized for physics production experiments was defined as equation 1: In the equation, nTagSum is used to denote a photon being generated and tagged with an over a range of 0.81.1 GeV, the energy of the photon is known by tagging the the recoil electron. The trigger required that a minimum of a two particle event be detected in by the inner hodoscope(nIH) and the outer hodoscope(nOH). For the OH, a mixture of hits between the horizontal and vertical groups would be valid. Lastly, the EV is included into the trigger logic as a veto. A summary of the data analyzed for the results discussed in this report are listed in table 1.
| (1) |
| Experiment Period | Flat Top | Number of | Number of | Beam Rate |
|---|---|---|---|---|
| 2010 | [s] | Accepted Events | Photons [] | [MHz] |
| September | 21 | 0.64 x 10⁹ | 0.89 x 10¹² | 1.5 - 2.5 MHz |
3.2 Time of flight
Time of flight measurements (TOF) allow for a particle s mass to be determined by knowledge of flight time, the momentum, and the path length L [4]. The time of flight for a particle exiting the inner hodoscopes and passing through the outer is found by the difference of the mean time of the outer with that of the inner. The time-of-flight (TOF) particle identification method in combination with a momentum measurement was used for determination of the particle species. The technique was to not select the particles only by their mass but instead by two dimensional histograms of the momentum versus inverse velocity () was considered. From the energy-momentum relation the velocity can be calculated as,
| (2) |
| (3) |
Therefore the square of the particle’s mass is found by,
| (4) |
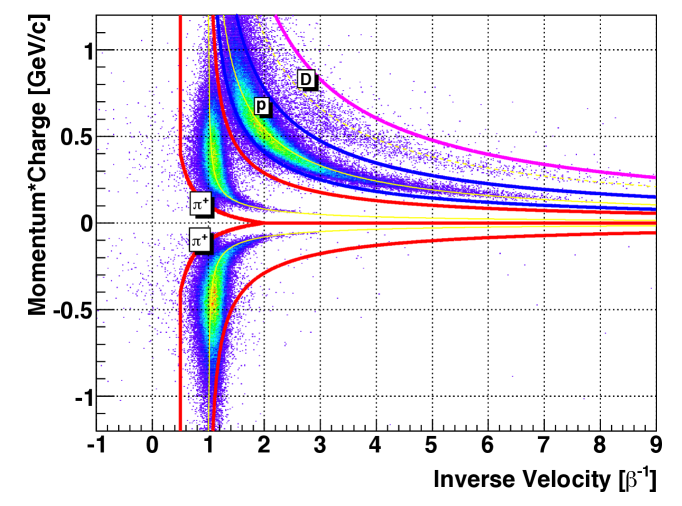
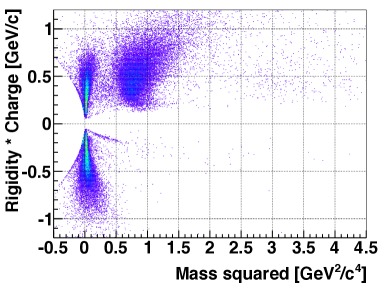
Figure. 2 displays the two dimensional plot of the charge of the particle multiplied by momentum versus inverse beta. The colored locus plot was produced with an additional limitation on the opening angle between particles; The requirement of -0.9 cos 0.9 was applied for the purpose of rejecting the abundant amount of electron positron pairs. The bands around 1/ = 1 are the distributions that correspond to charged pions, indicated in the red lined regions, and the band is for protons which lie within the blue lined region. The time of flight resolution between the vertical segments of the OH and IH was found to be 326 () 2 ps. For the the left and right second segments of the inner hodoscopes (IH2), which are used in the trigger logic for data acquisition, the relative time resolution was 170 () 1 ps.
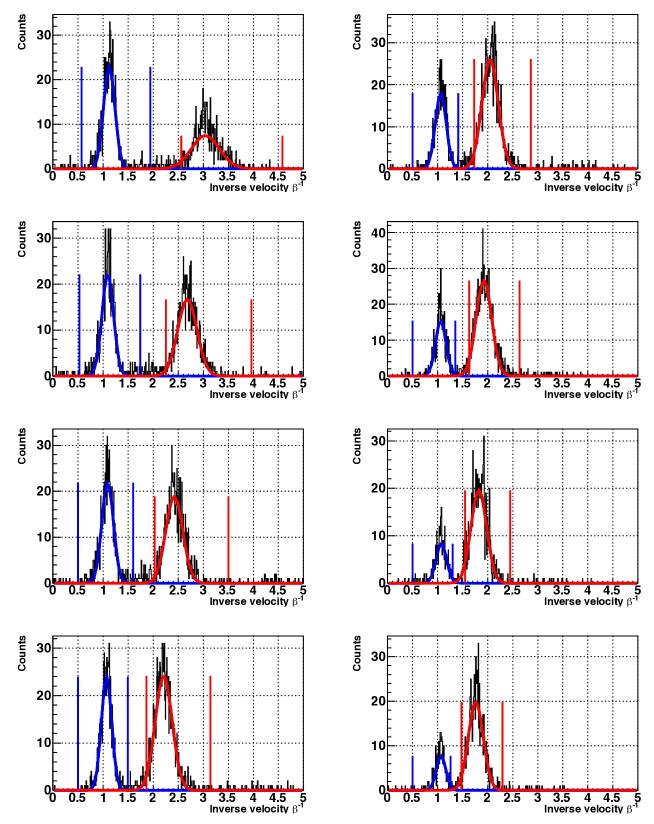
A study into the separation power of time of flight measurements between and protons was conducted to quantitatively ascertain the performance of the NKS2 spectrometer with the inclusion of the new inner hodoscope (IH). The separation power of the particle species is evident when a projection of the inverse velocity distribution is produced for a specified momentum region as presented in figure. 3, where the pion and proton inverse beta distributions are seen left to right respectively. The regions of momenta selection are 0.02-0.25, 0.3-0.35, 0.4-0.4.5,0.5-0.55 ,0.60-0.65, and 0.7-0.75 GeV/. This plot includes an additional requirement for the opening angle such that . The opening angle for electron positron pairs is much smaller than that of charged pions from the kaon decay in the energy region of this experiment. The results of the study of the separation power between pions and protons with respect to momentum was performed and the extracted results are shown in figure 4. The separation power was defined by the following equations 5, 6 , 7, where the distributions in figure 3 were fitted to a Gaussian function. , , and are the mean values and the standard deviations of the gaussian fits of the pion and proton distributions. The calculation of the separation power is,
| (5) |
| (6) |
| (7) |
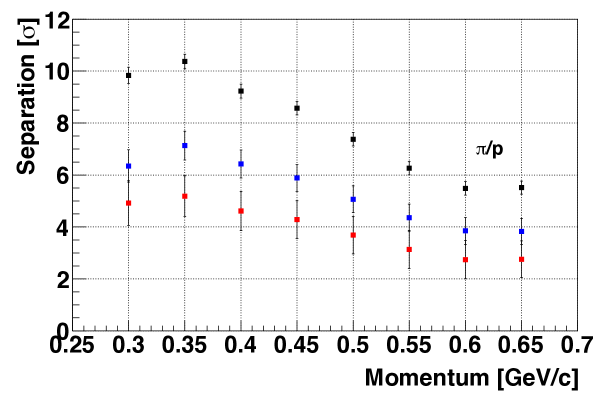
As can be understood from the equations the particles species separation power was defined as being proportional to the mean of the sigmas, equation 5, the square root of the sum of the squares of the sigmas, equation 6, and the sum of the sigmas, equation7. Therefore, we define the potential upper bound and lower bound separation between protons and pions as equations 5 and 7.
From equation 4 the region selection of the identification of charged pions is specified as,
| (8) |
and for the protons,
| (9) |
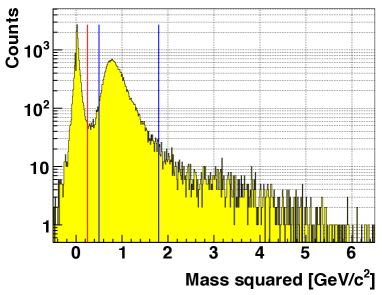
The mass squared distributions of the detected particles versus the momentum that has been multiplied by the charge is shown in figure 5.
4 Invariant Mass
For the identification of the lambda particle it was necessary to reconstruct its invariant mass from two particle combinations of a negatively charged pion and a proton. The invariant mass is calculated by the following equation,
| (10) |
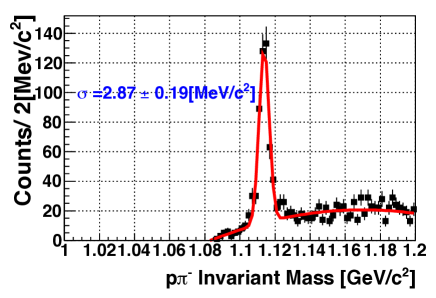
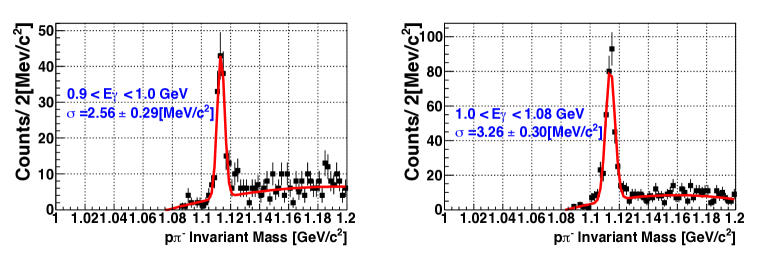
The pinvariant mass distribution in the inclusive N pX measurement is shown figure 6 for the energy bin of 0.9 -1.08 GeV. The distributions associated with the energy bins of 0.9-1.0 and 1.0 - 1.08 GeV are can be seen in figure 6. However, there lies the chance of a fallaciously identified decay vertex point such that the combination of a pion from the kaon decay and a proton from a lambda decay. The background present in the invariant mass spectrum after the application of kinematical and various cuts is attributed mainly to this mis-combination. The photon induced production of a particle and it’s subsequent decay can also contribute to the background. The distributions were fitted by the combination of a gaussian and third degree polynomial function. The resolution of the distribution generated for the energy bin of 0.9 -1.08 GeV was determined to be 2.87 0.19 MeV/c2 in RMS. In the two smaller energy bins, 0.9-1.0 and 1.0-1.1 GeV, the resolutions were 2.56 0.2 and 3.26 0.30 GeV respectively. Full details are listed in table 2.
| Inclusive measurement | |||||
|---|---|---|---|---|---|
| Selection | Region [ GeV] | Resolution [MeV/c2] | Yield (S) | Noise(N) | S/N |
| E | 0.90 Eγ 1.1 | 2.87 0.19 | 349 25.49 | 16612.88 | 2.1 |
| E | 0.90 Eγ 1.0 | 2.56 0.20 | 102 14.42 | 497.00 | 2.1 |
| E | 1.0 Eγ 1.1 | 3.26 0.30 | 247 20.59 | 7210.24 | 3.4 |
5 Summary
The experiment in the photoproduction of strangeness on a deuteron target was accomplished using a tagged photon beam at the ELPH research facility. The time of flight particle identification (PID) capability of the upgraded NKS2+ spectrometer was evaluated. The separation power between protons and pions was examined and reported. The invariant mass spectrum of p was obtained and the resolution of the spectrums have been detailed. We are placing immense effort in the proper calibration of the data and in furthering the status of data analysis, which is still underway.
Acknowledgment
This research endeavor was partially supported by the Creative Research Program funded by the Japan Promotion of Science and also by the JSPS Core to Core program.
References
- [1] T. Mart et al.: Nucl. Phys. A684 (2001) 502.
- [2] K. Tsukada et al.: Phys. Rev. C78 (2008) 14001.
- [3] T. Watanabe et al.: Phys.. Rev. Lett. B651 (2007) 269.
- [4] E.Nappi et al.: Instrumentation in elementary particle physics 674 (2003) 18-35.