Probing the X-Ray Binary Populations of the Ring Galaxy NGC 1291
Abstract
We present Chandra studies of the X-ray binary (XRB) populations in the bulge and ring regions of the ring galaxy NGC 1291. We detect 169 X-ray point sources in the galaxy, 75 in the bulge and 71 in the ring, utilizing the four available Chandra observations totaling an effective exposure of 179 ks. We report photometric properties of these sources in a point-source catalog. There are of the bulge sources and of the ring sources showing long-term variability in their X-ray count rate. The X-ray colors suggest that a significant fraction of the bulge () and ring () sources are likely low-mass X-ray binaries (LMXBs). The spectra of the nuclear source indicate that it is a low-luminosity AGN with moderate obscuration; spectral variability is observed between individual observations. We construct 0.3–8.0 keV X-ray luminosity functions (XLFs) for the bulge and ring XRB populations, taking into account the detection incompleteness and background AGN contamination. We reach 90% completeness limits of and erg s-1 for the bulge and ring populations, respectively. Both XLFs can be fit with a broken power-law model, and the shapes are consistent with those expected for populations dominated by LMXBs. We perform detailed population synthesis modeling of the XRB populations in NGC 1291, which suggests that the observed combined XLF is dominated by an old LMXB population. We compare the bulge and ring XRB populations, and argue that the ring XRBs are associated with a younger stellar population than the bulge sources, based on the relative overdensity of X-ray sources in the ring, the generally harder X-ray color of the ring sources, the overabundance of luminous sources in the combined XLF, and the flatter shape of the ring XLF.
Subject headings:
galaxies: individual (NGC 1291) — galaxies: luminosity function — X-rays: binaries — X-rays: galaxies1. INTRODUCTION
Galactic rings are a peculiar phenomenon among galaxies. A prototype ring galaxy is the famous Cartwheel galaxy, with a spectacular ring luminous in the infrared (IR), optical, UV, and X-ray bands. The formation of ring-like structures in galaxies is not fully understood. The two most common theories are the collisional origin and the resonance origin. A collisional ring could be created by a head-on collision between a compact companion galaxy and a larger disk system; a collisional ring galaxy usually contains an off-centered nucleus and an asymmetric ring structure, and there is a significant chance of finding a companion galaxy close to the ring galaxy (see Appleton & Struck-Marcell 1996 for a review). A resonance ring could be produced by the outer Lindblad resonance of spiral bars; such a system is preferentially observed in barred galaxies, and the resulting ring is generally symmetric (see Buta & Combes 1996 for a review). There are a few systems that are difficult to explain with these two theories, such as the Hoag’s Object (Hoag, 1950), for which alternative formation scenarios have been proposed (e.g., Finkelman et al., 2011).
Galactic rings are expected to exhibit significant star formation compared to their progenitor galaxies mainly due to the enhanced gas densities in the rings, regardless of the formation mechanism. Surveys of ring galaxies in optical, H, IR, and radio have revealed that the rings are generally rich in Hi gas and Hii regions (e.g., van Driel et al., 1988; Marston & Appleton, 1995; Phillips, 1996; Ryder et al., 1996; Grouchy et al., 2010). With Chandra’s subarcsecond angular resolution, it is now possible to study in detail the X-ray binary (XRB) populations in nearby galaxies, e.g., low-mass X-ray binaries (LMXBs) that are associated with old stellar populations and high-mass X-ray binaries (HMXBs) that are associated with young stellar populations (see e.g., Fabbiano 2006 for a review). Therefore, X-ray observations have become an independent approach for constraining the nature of the underlying stellar populations by means of X-ray luminosity functions (XLFs) and X-ray colors of the XRBs. However, little is known regarding the X-ray properties of galactic rings, except for the Cartwheel galaxy, which has an exceptionally large number of young ( yr) ultraluminous X-ray sources (ULXs; erg s-1; e.g., Swartz et al. 2004) in the star-forming ring (e.g., Gao et al. 2003; King 2004; Wolter & Trinchieri 2004).
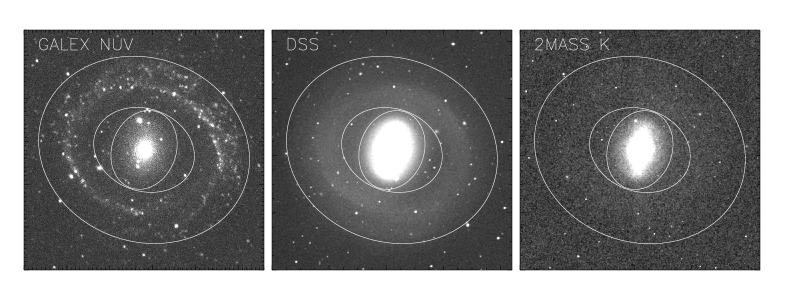
NGC 1291 is a remarkable ring galaxy, first noted by Perrine (1922). It was classified as (R)SB(s)0/a (RC3; de Vaucouleurs et al. 1991), and is virtually face-on (Mebold et al., 1979). The images of NGC 1291 in the UV, optical, and near-IR (NIR) are shown in Figure 1. The galaxy includes a fainter outer ring and a prominent bulge, which was considered as a prototypical pseudobulge (e.g., Kormendy & Kennicutt, 2004). At a distance of 8.9 Mpc, NGC 1291 has = (de Vaucouleurs, 1975). The D25 ellipse of NGC 1291 has a size of (Kennicutt et al., 2003), and the nuclear position of the galaxy is , (Evans et al., 2010). The Galactic column density along the line of sight to NGC 1291 is cm-2 (Dickey & Lockman, 1990).111See http://heasarc.nasa.gov/cgi-bin/Tools/w3nh/w3nh.pl.
The ring of NGC 1291 does not appear as energetic as that of the Cartwheel galaxy. There were only two ULXs reported in the ring based on the first Chandra observation in 2000 (Swartz et al., 2004). The total star formation rate (SFR) of NGC 1291 is only 0.4 yr-1 (Kennicutt et al., 2003), compared to that of 67.5 yr-1 for the Cartwheel galaxy (Higdon, 1993). Given its barred spiral nature, the relatively symmetric structure of the ring, and the absence of any apparent companion, NGC 1291 is likely a resonance ring system, while the Cartwheel galaxy is most likely a collisional ring system (e.g., Appleton & Struck-Marcell, 1996). Intense star formation still appears present in the ring of NGC 1291, which is obvious from the UV image (Figure 1). On the contrary, the bulge is much redder than the ring, and dominates in the NIR image (Figure 1). van Driel et al. (1988) mapped the Hi distribution in NGC 1291, and revealed that Hi gas is concentrated in the ring region. The ring also contains discrete Hii regions, while the bulge has filaments of ionized gas (Crocker et al., 1996). Given the UV/optical/radio data, the ring appears to host a younger stellar population than the bulge. Noll et al. (2009) studied the star-formation history of many galaxies including NGC 1291, using spectral energy distribution fitting techniques. The best-fit model for NGC 1291 (Noll, private communication) includes two exponential starburst events: one happened 10 Gyr ago with an e-folding timescale of 0.25 Gyr and the other happened 200 Myr ago with an e-folding timescale of 50 Myr. The stellar mass of the old population is times higher than that of the younger one. Although the fitting results were derived for the entire galaxy and may have large uncertainties, they are consistent with the UV/optical/radio data if the ring hosts the younger stellar population.
NGC 1291 had been observed with Chandra twice in June and November 2000, with a total exposure of ks. A first study by Irwin et al. (2002) was limited to the bulge region. Kilgard et al. (2005) presented a point-source catalog based on these observations, and found that the XLF and X-ray colors suggest old XRB populations in the galaxy. This study however, did not discriminate between bulge and ring XRBs.
We obtained two additional Chandra observations of NGC 1291 in May 2010, with a total exposure of ks. The new observations cover the majority of the ring region, allowing us to investigate the XRB populations in the bulge and ring respectively. NGC 1291 is much closer than the Cartwheel galaxy ( Mpc compared to Mpc), and thus we are able to probe the ring XRB population down to an unprecedented luminosity limit ( erg s-1). We compare the ring XRB population to the bulge population and test whether the galactic ring hosts a younger stellar population from an X-ray point of view. The deep observations on the bulge also allow us to compare its LMXB population to those of the recently acquired deep exposures of elliptical galaxies, and establish if all LMXB populations are indeed compatible.
This paper is organized as follows. We describe the Chandra observations of NGC 1291 and the data reduction procedure in Section 2. In Section 3 we construct an X-ray point-source catalog. X-ray source properties are presented in Section 4, including X-ray source radial profile, source variability, and X-ray colors. The nuclear source and ULX candidates are also discussed. In Section 5, we calculate and parameterize the XLFs for the bulge and ring regions, respectively, taking into account the detection incompleteness and background AGN contamination. We model the observed XLF using population synthesis (PS) models in Section 6. In Section 7, we discuss implications of the X-ray properties and we argue that the ring hosts a younger stellar population than the bulge. We summarize our results in Section 8.
2. OBSERVATIONS AND DATA REDUCTION
NGC 1291 has been observed with the S3 chip of Chandra Advanced CCD Imaging Spectrometer (ACIS; Garmire et al. 2003) at four epochs. The four observations are listed in Table 1 along with their exposure times, ranging from 37 ks to 70 ks. The focal-plane temperature was C for all the observations. We reduced and analyzed the observational data using mainly the Chandra Interactive Analysis of Observations (CIAO) tools. 222See http://cxc.harvard.edu/ciao/ for details on CIAO. We used the chandra_repro script to reprocess the data with the latest calibration. The background light curve of each observation was then inspected and background flares were removed using the deflare CIAO script. The flare-cleaned exposure times are also listed in Table 1; there was a significant flare in observation 2059 that reduces its usable exposure by . The total usable exposure for NGC 1291 is 178.6 ks.
We registered the astrometry of the observations using the CIAO tool reproject_aspect. We created a 0.3–8.0 keV image for each observation and searched for sources using wavdetect (Freeman et al., 2002) at a false-positive probability threshold of 10-6. These source lists were used to register the observations to the astrometric frame of observation 11272 with the CIAO script reproject_aspect, adopting a 3 matching radius and a residual rejection limit of 0.6. We reprojected the registered event lists to observation 11272 using reproject_events, and then merged all the observations to create a master event file using dmmerge. The ACIS-S3 chip has different pointings for the four observations, and the average aim point (weighted by exposure time) is , .
We constructed images from the merged event file using the standard ASCA grade set (ASCA grades 0, 2, 3, 4, 6) for six bands: 0.3–8.0 keV (full band), 0.3–2.0 keV (soft band), 0.5–2.0 keV (conventional soft band), 2.0–8.0 keV (hard band), 0.3–1.0 keV (soft band 1), and 1.0–2.0 keV (soft band 2). For each observation, we created exposure maps in these bands following the basic procedure outlined in Section 3.2 of Hornschemeier et al. (2001), which takes into account the effects of vignetting, gaps between the CCDs, bad-column filtering, bad-pixel filtering, and the spatially dependent degradation in quantum efficiency due to contamination on the ACIS optical-blocking filters. A photon index of was assumed in creating the exposure map, which is a typical value for photon indices of X-ray binaries (e.g., Irwin et al., 2003; Brassington et al., 2010). Merged exposure maps were then created from the exposure maps of the individual observations.
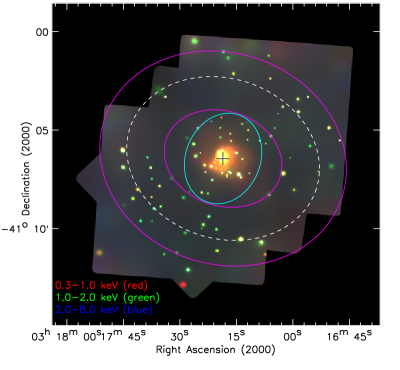
We created adaptively smoothed images from the raw images using the CIAO tool csmooth. Exposure-corrected smoothed images were then constructed following Section 3.3 of Baganoff et al. (2003). We show in Figure 2 a color composite of the exposure-corrected smoothed images in the 0.3–1.0, 1.0–2.0, and 2.0–8.0 keV bands.
3. POINT-SOURCE CATALOG
We ran wavdetect on the full-band image 333Source searching was performed only in the full band as we focused on the study of the full-band XLFs. to search for X-ray point sources, with a “ sequence” of wavelet scales (i.e., 1, , 2, , 4, , 8, , and 16 pixels) and a false-positive probability threshold of 10-6. At this threshold, we expect approximately two false detections given the size of the image (e.g., Kim et al., 2004).
There are 169 X-ray sources detected in the full band. We utilized the acis extract (AE; Broos et al. 2010) program to derive the source photometry. The main advantage of AE compared to a simple circular-aperture extraction approach is that AE uses a polygonal extraction region to represent the point spread function (PSF) for each observation of each source individually, which is more suitable for multiple observations with different aim points and roll angles. Briefly, AE constructs source extraction regions that approximate encircled-energy fraction (EEF) contours of the PSFs at 1.50 keV for each exposure. Smaller extraction regions (as low as ) were used for sources in crowded regions. Background counts were extracted in an annular region around each source excluding any pixels that belong to detected sources; the number of extracted background counts was required to be at least 100 to reduce the uncertainty from the background estimation. Encircled-energy fractions at several energies (ranging from 0.28 to 8.60 keV) were provided by AE, and thus we derived aperture corrections for all the six X-ray bands listed in Section 2 via interpolation. Aperture-corrected net (background-subtracted) source counts and the corresponding 1 errors (Gehrels, 1986) for these bands were then computed; the errors were propagated through the errors of the extracted sources and background counts following the numerical method described in §1.7.3 of Lyons (1991). As the source detection was performed only in the full band, we consider a source as undetected in a given band (other than the full band) if it is less significant than 3, when calculated using the net counts and 1 error in that band. An upper limit on the source counts was derived for an undetected source, using the Bayesian approach of Kraft et al. (1991) for the 99% confidence level if the extracted number of counts is less than 10 in the given band; otherwise, we calculated a 3 upper limit following the Poisson statistic (Gehrels, 1986).
An X-ray spectrum for each source was extracted by AE along with the spectrum of its local background. We performed spectral fitting of each source using XSPEC (Version 12.6.0; Arnaud 1996) with the Cash fitting statistic (CSTAT; Cash 1979). An absorbed power-law model (tbabs*pow) was employed for sources with more than 30 full-band counts; for the other sources, the spectra were modeled with a simple power law with the photon index fixed at . The observed full-band fluxes were derived from the best-fit spectra, which were then converted to full-band luminosities. We applied a smaller correction factor (1.05) to the observed full-band luminosities to account for the Galactic absorption.
Of the 169 point sources, 75 are in the bulge region and 71 in the ring area. We defined the bulge and ring regions based on the UV and NIR images shown in Figure 1. We examined the surface brightness contours of the -band image and selected a contour that encloses of the light within the D25 ellipse. This contour can be well approximated by an ellipse centered on the galactic nucleus, which was used to defined the bulge boundary. The ring region is defined by two ellipses centered on the galactic nucleus. We fixed the position angle (70°) and axis ratio (1.15) of the ellipses according to the morphology information given in de Vaucouleurs (1975) and only allowed the sizes of the ellipses to vary so that the ring region includes the majority of the prominent UV ring features. We note that of ring region is covered by the Chandra exposure (see Figure 2).
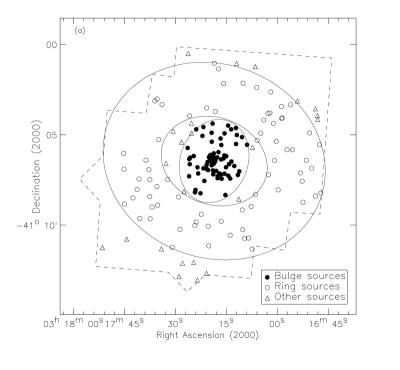
The spatial distribution of the X-ray sources is displayed in Figure 3a, and their luminosity distribution is show in Figure 3b. The full-band luminosities range from to erg s-1. We listed basic photometric properties for the 169 sources in Table 2, with details of the columns given below.
-
1.
Column 1: the source number, listed in order of increasing right ascension.
-
2.
Columns 2 and 3: the right ascension and declination of the X-ray source, respectively.
-
3.
Column 4: the off-axis angle of the X-ray source in arcminutes. This is the distance between the source position given in columns 2 and 3 and the average aim point (see Section 2).
-
4.
Column 5: the radial distance of the X-ray source to the nucleus of the galaxy in arcminutes.
-
5.
Columns 6–23: the source counts and the corresponding statistical errors or the upper limits on source counts for the six bands, 0.3–8.0 keV, 0.3–2.0 keV, 0.5–2.0 keV, 2.0–8.0 keV, 0.3–1.0 keV, and 1.0–2.0 keV, respectively. Upper limits are indicated as a “” in the error columns.
-
6.
Column 24: the full-band effective exposure time determined from the exposure map, which has been corrected for vignetting and quantum-efficiency degradation.
-
7.
Columns 25–30: the soft and hard X-ray colors and the corresponding statistical errors; see Section 4.4 below for details.
-
8.
Column 31: the photon index derived from spectral fitting, or set to if the number of full-band counts is smaller than 30.
-
9.
Column 32: observed full-band X-ray luminosity, in units of erg s-1.
-
10.
Column 33: the statistical significance of the full-band flux variability; see Section 4.3 below for details. It is set to “” if the flux variability is not available.
-
11.
Column 34: region flag for the source. The flag is “Bulge” if the source is located in the bulge, “Ring” if the source is in the ring, or “Other” if the source is neither in the bulge nor in the ring.

4. POINT-SOURCE PROPERTIES
4.1. Radial Profile
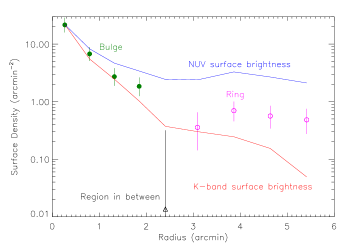
We constructed a radial profile of the X-ray source surface density. Given the non-circular shapes of the ring and bulge, we calculated X-ray source densities in four elliptical annular regions in the bulge, four elliptical annular regions in the ring, and one region in between the bulge and the ring. The elliptical annular regions in the ring/bulge have the same position angle and axis ratio as the ring/bulge and are evenly spaced in their distances to the galactic nucleus. We corrected the number of X-ray sources in each region for the detection incompleteness and background AGN contamination (see Section 5.1 below; the incompleteness correction was derived in the corresponding region). For this purpose, we only included sources that are outside the central 10″-radius region and have full-band luminosity erg s-1. The corrected number of sources was then divided by the region area to obtain the surface density. The X-ray source radial profile is presented in Figure 4. There appears to be an overdensity of X-ray sources in the ring of the galaxy compared to the region in between the bulge and the ring. We also included in this plot surface brightness radial profiles for the GALEX NUV and 2MASS -band data, calculated in the same regions as above. The surface brightness profiles are arbitrarily normalized so that the highest brightness has the same value as the highest source density. The NUV surface brightness is expected to trace the young stellar populations, while the -band emission is sensitive to the old stellar populations. In the ring region, the NUV and -band surface brightness profiles differ significantly. The X-ray source radial profile in the ring does not continue with the trend shown in the bulge and the region in between, and it mainly follows the NUV surface brightness distribution, suggesting that the X-ray sources in the bulge and ring regions are associated with different stellar populations and the ring stellar population is likely younger.
4.2. Central Point Source and Ultraluminous X-Ray Sources
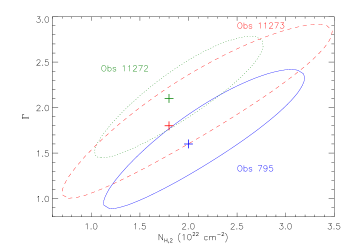
The nuclear point source (XID 84) of NGC 1291 has a position of , , and an observed full-band luminosity of erg s-1. It has been classified as a low-ionization nuclear emission-line region (LINER; e.g., Smith et al. 2007), and Irwin et al. (2002) suggested that it is an obscured low-luminosity active galactic nucleus (AGN) based on the X-ray spectral analysis of the first two Chandra observations. We show the X-ray spectra of the source for the four individual observations in Figure 5, which were extracted by AE with polygonal regions that approximate the EEF PSFs in the 0.3–8.0 keV band. Local background spectra were also extracted by AE in the same annular regions as those used in the photometry extraction. There are clearly strong soft X-ray excesses in the spectra of all the observations, which are typical among low-luminosity AGNs and are considered to originate from hot gas in the galactic center (e.g., Ptak et al., 1999). We thus fit the spectra using XSPEC with an absorbed power-law (AGN) plus thermal plasma (hot gas) model (wabs1*apec+wabs2*pow). Note that there could be multiple temperatures present in the gas, however, the limited signal-to-noise ratio (S/N) of the data cannot place strong constraints on a multi-temperature plasma. The spectral slope and column density for the power-law component were free to vary during the fitting. For the thermal component, we set the abundance to be Solar, and then we determined its temperature ( keV) and absorption column density ( cm-2) by fitting the stacked spectrum of the four observations. In the spectral fitting of the individual observations, the temperature and column density parameters were fixed, and only the normalization was allowed to vary.444The extraction regions are different between observations, corresponding to the EEF PSFs of the nuclear point source in individual observations. Therefore, the amount of diffused gas within the extraction region varies. The best-fit parameters are listed in Table 3; also shown are the observed luminosities of the AGN component. The 1 errors were derived by varying one interesting parameter. The intrinsic 2.0–8.0 keV X-ray luminosity is erg s-1 after absorption and aperture corrections, indicating its low-luminosity nature. The nuclear AGN has an intrinsic power-law photon index of and an absorption column density of cm-2, which are typical for an obscured AGN (e.g., Turner et al., 1997). The 3 confidence contours for the photon index and column density parameters are shown in Figure 6; there is a spectral variation between observations 795 and 11272. The X-ray luminosities of these two observations also differ at the significance level (Table 1). It has been noted that long-term variability in luminosity and spectral parameters is common among obscured AGNs (e.g., Risaliti et al., 2002).
Besides the nuclear source, there are two more sources (XIDs 55 and 57) with observed full-band luminosity in excess of erg s-1, in the regime of ULXs. Their intrinsic full-band luminosities after absorption corrections are erg s-1 and erg s-1, respectively. One other source (XID 26), after being corrected for intrinsic absorption ( cm-2), has an intrinsic full-band luminosity of erg s-1, which should also be considered as a ULX candidate. XIDs 26 and 55 are ring sources, whereas XID 57 is a bulge source. The two ring ULX candidates have been reported in the ULX catalog of Swartz et al. (2004) based on the data of the first observation (observation 795). The bulge ULX candidate is a transient source, not detected in the first two observations. These ULX candidates were not detected in the study of Irwin et al. (2002), which utilized only the first observation and focused on the bulge region. There is also a non-negligible possibility that these sources are background AGNs. The expected numbers of background AGNs with ULX luminosities if placed at the distance of NGC 1291 are and for the bulge and ring regions, respectively (see Section 5.1 below for details of the AGN surface density). The numbers of ULXs in NGC 1291 and the Cartwheel galaxy ( and ) do not appear to be linearly correlated with their SFRs (0.4 yr-1 and 67.5 yr-1). Previous ULX surveys have found that the numbers of ULXs at low SFRs ( yr-1) are significantly higher than those extrapolated linearly from the high SFR end, suggestive of an additional population of ULXs associated with LMXBs (e.g., Liu et al., 2006).

4.3. Source Variability
X-ray flux/spectral variability is a common feature among point sources in galaxies, which is generally attributed to the change of physical properties of the accretion disks (e.g., Remillard & McClintock, 2006; Done et al., 2007; Brassington et al., 2010; Fabbiano et al., 2010). The four Chandra observations of NGC 1291 span years, allowing us to study the long-term flux variability of the point sources.
For each source in each observation, we calculated its aperture-corrected full-band count rate () based on the photometry provided by AE; an upper limit on the count rate was calculated if the source was not detected in the observation (see Section 3). For a source that was detected in at least one individual observation and was covered by at least two observations, we computed the maximum statistical significance of its flux variation between any two observations, defined as (e.g., Brassington et al., 2009; Sell et al., 2011):
| (1) |
where the subscripts and run over different observations, and and are the 1 errors of the count rates. We consider a source to be variable if its parameter is greater than three (i.e., variation). The flux variability for the point sources in NGC 1291 are shown in Figure 7. In the bulge and ring regions, and of the sources are variable, respectively; the errors are the 1 Poisson uncertainties on the numbers of sources that are considered variable. We note that the central point source and the three ULX candidates are variable. There is no significant difference between the fraction of variable sources in the bulge and ring regions given the data available. Kilgard et al. (2005) reported that 29% of the sources show long-term variability based on the first two Chandra observations, consistent with our findings here. The fraction of variable sources in NGC 1291 is in general agreement with those in some typical early-type galaxies, e.g., NGC 3379 and NGC 4278 (Brassington et al., 2008, 2009).
For the luminous nuclear point source and the three ULX candidates, we also examined their spectral variability by fitting the spectra in individual observations. The spectral variability of the nuclear source is discussed in Section 4.2. For the ULX candidates, their spectra were well fit by an absorbed power-law model. Although all these ULX candidates are variable in flux, none of them shows significant () variability in its spectral parameters. The two non-transient ULX candidates (XIDS 26 and 55) still have ULX luminosities in individual observations.

4.4. X-Ray Colors
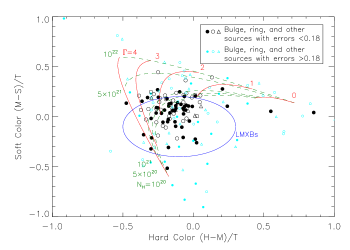
It is difficult to classify individual X-ray sources into different XRB types (e.g., LMXBs and HMXBs) given the limited X-ray data alone (e.g., Fabbiano, 2006). However, we can use X-ray colors to separate the points sources into groups that are likely dominated by certain source types (e.g., Colbert et al., 2004; Prestwich et al., 2003, 2009). We constructed an X-ray color-color plot following Prestwich et al. (2003). The X-ray colors are defined as (hard color) and (soft color), where , , , and are the count rates in the 0.3–1.0 keV, 1.0–2.0 keV, 2.0–8.0 keV, and 0.3–8.0 keV bands, respectively. A Bayesian approach was adopted to calculate the colors and the associated errors following the method developed by Park et al. (2006). This approach provides a rigorous statistical treatment of the Poisson nature of the detected photons as well as the non-Gaussian nature of the error propagation. The color-color plot is shown in Figure 8. We consider a source to be significant in the plot (a black data point) if its average error of the soft and hard colors is smaller than the -clipped mean (0.18) of the errors for all the sources. The other sources (cyan data points) have relatively large color errors and are not included in the following analysis. A significant fraction (75% of the bulge sources and 65% of the ring sources) of the X-ray sources are located in the region that is likely dominated by LMXBs (Prestwich et al., 2003). The dominance of LMXBs is also suggested by the low SFR of NGC 1291. The SFR of NGC 1291 is of that of the Milky Way (e.g., Chomiuk & Povich, 2011), and the Milky Way only hosts a few HMXBs with luminosities above our detection completeness limit ( erg s-1; see Section 5.1) given its population studies (e.g., Grimm et al., 2002; Voss & Ajello, 2010). Therefore, HMXBs should have a small contribution to the observed XRB population in NGC 1291.
The bulge and ring sources appear to have different distributions in the X-ray color-color space. A two-dimensional Kolmogorov-Smirnov test555We used IDL routine ks2d for this test; see http://www.astro.washington.edu/users/yoachim/idl/py_idl.html. indicates that the probability of the two distributions being drawn from the same parent population is 0.08. The -clipped mean soft and hard colors for the bulge population are and , and the mean values are and for the ring population. On average, the ring population appears to have a significantly harder soft X-ray color than the bulge population. The color-color plot is overlaid with a grid showing the expected locations of sources with different power-law spectra and absorption column densities, derived using the CXC’s Portable, Interactive, Multi-Mission Simulator (PIMMS). A generally harder soft color suggests that the ring sources are more obscured (larger ) than the bulge sources, as would be expected in regions with ongoing/recent star formation.
5. X-RAY LUMINOSITY FUNCTIONS
We construct full-band XLFs for the bulge and ring regions using the merged Chandra observation. Although –40% of the point sources are variable between the individual observations, the XLFs derived from the merged observation should be stable against source variability based on previous studies of the XLFs for various systems (e.g., Grimm et al., 2005; Zezas et al., 2007; Sell et al., 2011).
5.1. Incompleteness Corrections and Background AGN Subtraction
To derive the XLFs correctly, it is essential to make proper corrections for the detection incompleteness and background AGN contamination. We performed simulations following Kim & Fabbiano (2004) to correct for the effects of incompleteness, including source detection limit and source confusion. Briefly, in each simulation we added a mock source at a random location of the event file of every observation using the MARX ray-tracing simulator,666http://space.mit.edu/CXC/MARX/index.html created a merged event file and a merged full-band image, and then ran wavdetect to test if this additional source is detectable. The input X-ray luminosity of the source was randomly drawn from a power-law XLF with in a cumulative form, . We assumed a power-law spectrum for the source with . The position of the source was randomly determined following the law (de Vaucouleurs, 1948). We note that the adopted luminosity and position distributions here do not affect the incompleteness corrections significantly, as we only aimed to derive the positional-dependent detection fractions at a given luminosity. We performed 60,000 simulations in total, and the incompleteness corrections were calculated as a function of X-ray luminosity for the bulge and ring regions, respectively, utilizing all the simulated sources in each region. We also excluded the central 10″-radius area from the bulge region when computing XLFs as the incompleteness corrections are not reliable in this crowded region. The resulting 90% (50%) completeness limits are () and () erg s-1 for the bulge and ring populations, respectively. The completeness limits in the bulge are lower because of the longer effective exposure time in the bulge and the smaller background within the extraction regions of bulge sources. The XLFs were only calculated down to the completeness limits, below which the Eddington bias (Eddington, 1913) could have affected the measured X-ray luminosities. There are 64 and 61 sources with luminosities above these completeness limits in the bulge and ring regions, respectively; of the sources have more than 10 full-band counts and thus the Eddington bias should have minimal effect (e.g., Bauer et al., 2004). Compared to the XLFs presented in Irwin et al. (2002) and Kilgard et al. (2005), which were based on the first two Chandra observations, we are probing the XLFs about twice as deep.
To correct for background AGN contamination, we did not attempt to classify AGNs from the detected sources. Instead, we calculated the expected AGN luminosity function, which was then deducted from the observed XLFs. We computed the AGNs flux distribution using the Gilli et al. (2007) AGN PS model, and we normalized the AGN surface density to the observed value in the Ms Chandra Deep Field-South, which is deg-2 at a flux limit of erg cm-2 s-1 (Xue et al., 2011). A 20% uncertainty was included for this estimation that was attributed to cosmic variance (e.g., Luo et al., 2008). There are and AGNs expected in the bulge and ring regions, respectively. The ring XRB population is heavily contaminated () by background AGNs. To derive the differential XLFs of the point sources in NGC 1291, we calculated the expected number of background AGNs in a given luminosity bin and then subtracted it from the incompleteness-corrected number of X-ray sources in this bin. The cumulative XLFs were constructed by integrating the differential XLFs.
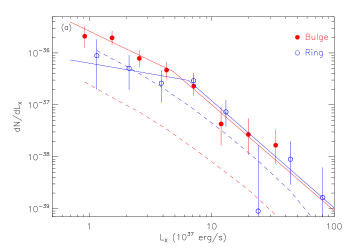
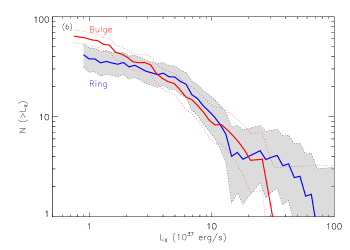
The incompleteness-corrected and background subtracted XLFs for the bulge and ring populations are displayed in Figure 9. The 1 errors were determined by combining the Poisson errors of the number of sources in each luminosity bin and the 20% uncertainty of the AGN surface density.
5.2. Parameterization of the X-Ray Luminosity Functions
The shapes of XLFs for different XRB populations (mainly LMXBs and HMXBs) have been studied extensively in the literature (see e.g., Fabbiano 2006 for a review). For LMXBs, the XLF in the bright end ( a few erg s-1) can usually be parameterized with broken power laws. The break luminosity is erg s-1, which may be related to the Eddington luminosity of neutron star binaries (e.g., Sarazin et al., 2000; Finoguenov & Jones, 2002; Kim & Fabbiano, 2004). Below the break luminosity, the XLFs have differential power-law slopes of 1.8–2.2 (e.g., Kim & Fabbiano, 2004); above the break, the XLFs cut off sharply, with differential slopes of . Note that the XLFs for young ( Gyr) LMXBs samples may not present this high-luminosity break (Kim & Fabbiano, 2010). In the faint end ( a few erg s-1), there are limited data available for the XLFs of LMXBs. The XLFs of nearby early-type galaxies and the bulges of nearby spirals (including the Milky Way) suggest that there is a second break at erg s-1, below which the XLFs appear flatter with differential slopes of –1 (e.g., Gilfanov, 2004; Voss & Gilfanov, 2007; Kim et al., 2009; Zhang et al., 2011).777 It has been suggested that LMXBs in different environments (e.g., in the field or globular clusters) probably exhibit notable difference in their XLFs (e.g., Kim et al., 2009). Such detailed discussion is beyond the scope of the current paper. The origin of this low-luminosity break is not clear, which could be related to magnetic braking during binary stellar evolution (e.g., Postnov & Kuranov, 2005; Fragos et al., 2008) or different types of donor stars in high- and low-luminosity LMXBs (Revnivtsev et al., 2011). For HMXBs, the XLFs can be described with a simple power law with a differential slope of over a large luminosity range ( erg s-1; Grimm et al. 2003).
We fit the XLFs of NGC 1291 to parameterize their shapes. A single power law of the form
| (2) |
and a broken power law of the form
| (3) |
were used, where and are the numbers of sources at the reference luminosites. We used the sherpa spectral fitting tool in the CIAO package to fit the XLFs in their differential forms. It has been shown in previous studies that this is an efficient method to derive the characteristics of XLFs and it can yield consistent results with a maximum likelihood approach (e.g., Zezas et al., 2007; Kim et al., 2009; Sell et al., 2011). The XLFs were read into sherpa as typical X-ray spectra with the number counts binned in small luminosity bins, . Given the small numbers of sources in the bulge and ring regions, we used the Cash statistic in sherpa for the model fits. The incompleteness corrections were supplied as an ancillary response file (ARF), and the AGN contribution was supplied as a table model in addition to the intrinsic power-law model. The best-fit parameters with 1 errors are reported in Table 4, and the best-fit broken power-law models are shown in Figure 9. For the single-power model, both XLFs have a power slope of . For the broken power-law model, both XLFs show a break luminosity of erg s-1. Above the break luminosity, the power slope is ; below that, the bulge XLF has a slope of while the ring XLF appears flatter, with a slope of . Note that the errors for the broken power-law parameters are relatively large.
The best-fit parameters were derived using the Cash statistic, which does not provide a goodness-of-fit parameter analytically. In order to compare the quality of the power-law and broken power-law fits, we adopted the likelihood ratio test used in Zezas et al. (2007). For each differential XLF (ring/bulge), we simulated 10,000 mock XLFs from the best-fit power-law model, using the same luminosity bins and adding Poisson fluctuations to the source counts. The detection incompleteness and background AGN contamination were also applied to the mock XLFs. We then fit the simulated XLFs with both the power-law and broken power-law models. The ratio of the Cash statistic values of the best power-law and broken power-law fits for the simulated XLFs were calculated and compared to the ratio for the observed XLF; the rate of obtaining a higher ratio in the simulations represents the probability of getting an improved broken power-law fit by chance. For the bulge XLF, we found that the broken power-law model provides a statistically improved fit at the 89% confidence level; for the ring XLF the broken power-law model provides an improved fit at the 94% confidence level. Therefore, the broken power-law model appears to provide better fits to the data for both the bulge and ring populations. The broken power-law shapes of the XLFs suggest that both the bulge and ring XRB populations are dominated by LMXBs. We are probing the low-luminosity break at erg s-1, with a slope of at the brighter end and a flatter shape at the fainter end; there are too few luminous XRBs in NGC 1291 to constrain the high-luminosity break at erg s-1. This result is consistent with that inferred from the X-ray colors (see Section 4.4). Given the arguments above, we prefer the broken power-law model for both the bulge and ring XLFs, and the following discussions are based on the broken power-law parameters.
6. THEORETICAL MODELING OF THE X-RAY BINARY POPULATIONS
PS modeling has been proven a valuable tool in order to study the physical properties of the XRB populations observed with Chandra in nearby galaxies. Belczynski et al. (2004) constructed the first synthetic XRB populations for direct comparison with the Chandra observed XLF of NGC 1569, a star forming dwarf irregular galaxy. Linden et al. (2009, 2010) developed models for the HMXB and Be XRBs of the SMC, studying the XLF and the spatial distribution of this population and investigating the effect of electron-capture supernovae of massive ONeMg stellar cores. Fragos et al. (2008, 2009) performed extensive PS simulations for the modeling of the two old elliptical galaxies NGC 3379 and NGC 4278. They studied the relative contribution to the observed XLF from sub-populations of LMXBs with different donor and accretor types, and the effects of the transient behavior of LMXBs. All these studies have been pivotal in interpreting Chandra observations of nearby galaxies.
In this paper, we utilized a new grid of PS models to interpret the XLF characteristics of NGC 1291. In these models, we focused on LMXBs and HMXBs formed in the galactic field as products of the evolution of isolated primordial binaries (i.e. we did not take into account any dynamical effects). We performed our simulations with StarTrack (Belczynski et al., 2002, 2008), an advanced PS code that has been tested and calibrated using detailed mass transfer star calculations and observations of binary populations, and incorporates all the important physical processes of binary evolution.
In the development of our models we incorporate our current knowledge about the characteristics of the stellar population in NGC 1291. This galaxy has a stellar mass of and a low current SFR of yr-1 (Kennicutt et al., 2003). We adopted the Noll et al. (2009) model for the star-formation history of NGC 1291 including two exponential starburst events (see Section 1). The metallicity of both populations is assumed to be solar. Due to the similar shapes of the bulge and ring cumulative XLFs and their relatively large uncertainties, it is not plausible to compare models to the individual XLFs. We also note that the best fit results by Noll et al. (2009) about the star-formation history of NGC 1291 have no spatial information. Hence, our comparison between PS models and the observed XRB population is limited to the combined (bulge plus ring) XLF of the galaxy.
We created a grid of 48 PS models varying parameters that are known from previous studies (Fragos et al., 2008) to affect the shape and normalization of the resulting synthetic XLF. Namely, we varied the common envelope (CE) efficiency, the initial mass function, stellar wind strength, and finally we allowed for various outcomes of the CE phase, in particular the possible CE inspirals with Hertzsprung gap donors that terminate binary evolution barring the subsequent XRB formation (Belczynski et al., 2007). The latter parameter, which is known to affect the evolution of massive binaries which are the progenitors of double compact objects (Belczynski et al., 2007), is for the first time explored in the context of XRB populations. The various parameter values used are shown in table 5. We note that in our calculations we combined and into one CE parameter, where is a measure of the central concentration of the donor and the envelope binding energy. In the rest of the text, whenever we mention the CE efficiency , we refer in practice to the product , effectively treating as a free parameter (see Belczynski et al., 2008, for details).
The synthetic XLFs were constructed based on the method described in Fragos et al. (2008), while transient systems were modeled according to Fragos et al. (2009). Furthermore, we calculated the errors in the synthetic XLF due to Poisson low number statistics (high luminosity end) and uncertainties in the bolometric correction factors (low luminosity end) (T. Fragos et al. 2012, in prep.; P. Tzanavaris et al. 2012, in prep.). In order to assess which are the preferred values of the different model parameters, we calculated the likelihood of the observed XLF given a model. Our statistical analysis takes into account not only the shape of the XLF (as in Fragos et al., 2008) but the absolute normalization too. Our maximum likelihood model has a low CE efficiency () and the “standard” stellar wind prescription (Belczynski et al., 2010, and references therein). We also found that there is an apparent degeneracy between the slope of IMF and whether or not we restrict the outcome of a CE event to a merger when the donor star is in the Hertzsprung gap. A flatter IMF results in a larger black hole XRB (BH-XRB) population, while on the other hand, assuming that a CE with a Hertzsprung gap donor leads always to a merger, which prevents many of the binaries from evolving into a BH-XRB. Hence, a BH-XRB population consistent with observations could either result from a steeper IMF (slope of -2.7) and CE prescription where we allow for all possible outcomes, even with a Hertzsprung gap donor, or it could result from a flatter IMF (slope of -2.35) and a CE model where a CE event with a Hertzsprung gap donor would always lead to a merger. In fact, the former case corresponds to our maximum likelihood model, while the latter to the model with the second highest likelihood.
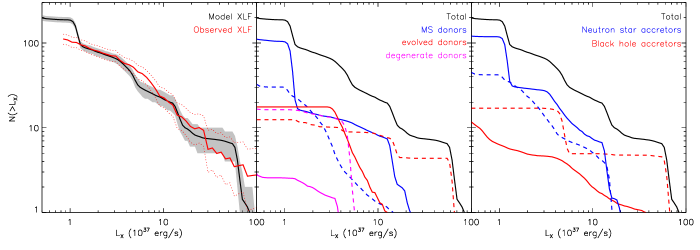
Figure 10 shows the synthetic XLF from our maximum likelihood model in comparison with the observed XLF, as well as the different types of XRBs contributing to the XLF at different ranges of X-ray luminosity. There are two artificial “jumps” in the model XLF at erg s-1 and erg s-1, instead of the observed smoother power-law shape. In our models, we identify transient and persistent sources by comparing the calculated mass-transfer rate of the binary to a critical mass-transfer rate, below which the thermal instability develops. Furthermore, we strictly limit the accretion rate to the Eddington limit. These limiting mass-transfer rates in our modeling are responsible for the apparent jumps in the synthetic XLF. However, in nature there is no sharp transition between thermally stable and unstable disks, nor a precise limit in the highest accretion rate possible. Accretion onto a compact object is a non-linear and much more complex process, which in reality can results in a smoother luminosity distribution with no sharp transitions. Finally, by assuming a solar metallicity for the stellar population of NGC 1291 in order to be consistent with Noll et al. (2009) and in the absence of any stellar metallicity measurements, we impose in practice a maximum BH mass of . If instead part of the stellar population had a lower metallicity (e.g. 30% solar) then the maximum BH mass would increase to or more (Belczynski et al., 2010), which could smooth out the jump at the very luminous end of the XLF.
We found that the BH-XRBs that populate the high-end of the XLF (above erg s-1, Eddington limit for a hydrogen accreting neutron star) are transient systems with evolved companion stars, while at lower luminosities the XRB population consists of a mixture of transient and persistent XRBs with a neutron star accretor and a giant or a main sequence (MS) donor star. These findings and the general shape of the synthetic XLF are in agreement with the PS study by Fragos et al. (2008) of the two old elliptical galaxies NGC 3379 and NGC 4278. This leads us to the conclusion that an old LMXB population is dominating the observed XLF. However, there is an evident overabundance of super-Eddington ( erg s-1, the Eddington limit for a hydrogen accreting neutron star) XRBs, compared to the Fragos et al. (2008) models, which can be attributed to the enrichment of the younger XRB population with black hole accretors. This younger population is likely originated from the ring star-forming region. Our finding that the younger stellar population of the ring region enhances the high X-ray luminosity, super-Eddington BH-XRB population, is consistent with the recent observational study by Kim & Fabbiano (2010). Kim & Fabbiano (2010) compared the combined XLF of LMXBs detected in Chandra observations of post-merger elliptical galaxies with that of typical old elliptical galaxies and found that elliptical galaxies with signs of recent star formation host a larger fraction of luminous LMXBs ( erg s-1) than old elliptical galaxies.
7. DISCUSSION
7.1. The Bulge LMXB Population
Galactic bulges host relatively homogeneous samples of old stellar populations, and thus they are ideal targets for the research of LMXB XLFs. PS modeling of the XLFs has been used to constrain the formation, evolution, and physical properties of the LMXB population (e.g., Fragos et al., 2008, 2009). Recently deep Chandra exposures of nearby elliptical galaxies and spiral bulges have pushed the XLFs down to limiting luminosities of around a few erg s-1; some best studied examples include Centaurus A (Voss & Gilfanov, 2006), M31 (Voss & Gilfanov, 2007), M81 (Sell et al., 2011), and samples of galactic bulges in Gilfanov (2004) and Kim et al. (2009). The derived XLFs are remarkably similar, with a low-luminosity break at erg s-1 and a high-luminosity break or cut-off at erg s-1. The bulge of NGC 1291 is dominated by LMXBs based on the XLF shape and the X-ray colors, though relatively weak star formation could still exist given the observed filaments of H gas (See Section 1). The bulge XLF of NGC 1291 reaches a similar threshold luminosity of erg s-1, and its shape is statistically consistent with previous findings. We obtain a low-luminosity break at erg s-1; a high-luminosity break is not constrained but is highly probable as there is only one bulge source with erg s-1 (one of the ULX candidates). The power-law slope above the low-luminosity break is , and is below the break, typical for LMXB XLFs. Despite of the complex morphology of the galaxy, the bulge of NGC 1291 still hosts a population of LMXBs that is very similar to those in typical elliptical galaxies and spiral bulges (in terms of their XLFs) down to the limiting luminosity, suggesting that all LMXB populations are compatible.
7.2. Comparison of the Bulge and Ring Populations
X-ray observations of the XRBs can provide valuable constraints on the underlying stellar populations, independent of what were obtained from the other wavelengths. Given the X-ray observations of NGC 1291, we consider that the ring of this galaxy hosts a younger stellar population than the bulge, based on the arguments given below.
-
1.
There appears to be an overdensity of X-ray sources in the ring of the galaxy. The radial profile of the X-ray source surface density follows the NUV surface brightness distribution in the ring instead of the -band surface brightness distribution, suggesting that the ring XRBs are likely associated with a younger stellar population (see Section 4.1).
-
2.
The ring XRB population has in general a harder soft X-ray color than the bulge population, likely due to increased obscuration in the ring associated with ongoing/recent star-forming activities (see Section 4.4).
-
3.
The bulge and ring combined XLF can be well modeled with a synthetic XLF that is in general agreement with the PS modeling of typical old elliptical galaxies. However, there appears to be an enhancement of super-Eddington XRBs, which could be associated a possible younger stellar population in the ring region (see Section 6).
-
4.
The XLF is an efficient probe of the relative age of stellar populations. It has been reported that young elliptical galaxies host a larger fraction of luminous LMXBs and the XLFs appear flatter than those of typical old elliptical galaxies (Kim & Fabbiano, 2010). For NGC 1291, the slope of the broken power-law fit at the faint end (Table 4) for the ring appears flatter than that for the bulge, albeit with a large uncertainty, suggesting that there are more luminous X-ray sources in the ring. A comparison of the numbers of sources in given luminosity bins for the bulge and ring populations is shown in Figure 11a. The numbers of sources have been corrected for the detection incompleteness and background AGN contamination. The fraction of relatively luminous sources ( erg s-1)) is for the bulge, and it is for the ring; the errors are Poissonian.
The LMXBs of the ring likely belong to two populations, a relatively old population that ages similarly to the bulge population and a relatively young population that formed with the enhanced star formation. To isolate this young population, we simply assume that the source number counts of the old population scale with the total -band luminosity, and then the old population in the ring can be derived from the bulge source number counts and the ratio between the -band luminosities of the bulge and ring (a factor of 3.6). We subtract this old population from the ring number counts and the residual is displayed in Figure 11b. The fraction of relatively luminous sources is for this remaining population in the ring. The difference in the fraction of luminous sources between the bulge and the ring appears more significant, and it is likely that the remaining XRB population is indeed younger.
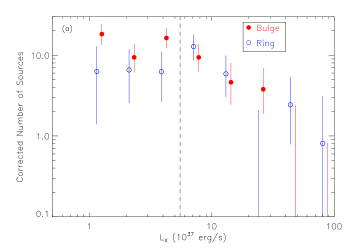
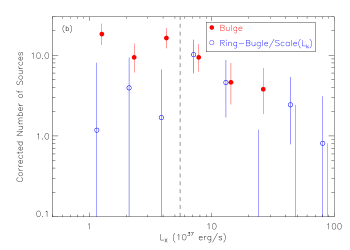
Figure 11.— Numbers of X-ray sources in given luminosity bins for the bulge, ring [panel (a)], and bulge-subtracted ring [panel (b); see text] populations. The numbers of sources have been corrected for the detection incompleteness and background AGN contamination. The luminosity bins were chosen to be the same for all the populations, and the limiting luminosity is erg s-1. The luminosities for the bulge data points were shifted by a small amount for display purpose. For several cases with only error bars and no data points shown in the plot, the numbers of sources are smaller than 0.1. The vertical dashed lines mark the approximate breaks of the XLFs, and are used to separate relatively luminous and relatively faint sources. (A color version of this figure is available in the online journal.)
7.3. XRB Population of Galactic Rings
As the two best studied galactic rings in the X-ray, the rings of NGC 1291 and the Cartwheel galaxy differ significantly. The XRB population in the ring of the Cartwheel galaxy is dominated by ULXs; the XLF has a power-law slope of albeit at high luminosities ( erg s-1; Wolter & Trinchieri 2004), consistent with being dominated by luminous young HMXBs. For NGC 1291, there are only two ULXs in the ring, and the ring XLF shape and X-ray source colors suggest a LMXB dominated system. The ring of the Cartwheel galaxy clearly has much stronger ongoing star formation than the ring of NGC 1291 (total SFR of 0.4 yr-1 for NGC 1291 compared to 67.5 yr-1 for the Cartwheel galaxy).
Such a discrepancy is probably caused by different formation and evolution scenarios of the galactic rings. The ring of the Cartwheel galaxy is likely produced by a recent merger event, and the expanding density wave forms the starburst ring. Collisional rings are generally short-lived with a lifetime of the order of a few hundred million years (see the review of Moiseev & Bizyaev 2009 and references therein). The ring of NGC 1291 is probably created by secular gas accumulation at the resonance orbit due to the gravity torques of the bars. Enhanced star formation appeared in the ring as gas was being gathered. However, this could a be a less energetic and longer-term event than those appeared in collisional ring systems, resulting in the relatively mild star formation observed today. Adopting the Noll et al. (2009) star-formation history model (Section 1) and assuming the ring hosts the young stellar population with an e-folding timescale of 50 Myr, the SFR of NGC 1291 would be yr-1 200 Myr ago, comparable to the current SFR of the Cartwheel galaxy.
8. Summary
We presented Chandra observations of the ring galaxy NGC 1291 and studied the XRB populations in the ring and bulge regions of the galaxy. The main results are summarized below.
-
1.
We analyzed the four Chandra ACIS-S3 observations of NGC 1291, with a total exposure of ks. We have detected 169 point sources in the 0.3–8.0 keV band, 75 of which are in the bulge and 71 in the ring. The full-band luminosities of the sources range from to erg s-1.
-
2.
We studied basic properties of the X-ray sources. There appears to be an overdensity of X-ray sources in the ring of the galaxy. The radial profile of the X-ray source surface density resembles the NUV surface brightness distribution in the ring, suggesting that a significant fraction of the ring XRBs are associated with a relatively young stellar population. About 40% of the sources in the bulge and 25% of the sources in the ring show long-term variability in the full-band count rate.
-
3.
We studied the spectra of the nuclear source, which appears to be a low-luminosity AGN with moderate obscuration, and there is also hot gas present in the nuclear region that produces soft excesses in the spectra. The spectra of individual observations were well fit with an absorbed power-law plus thermal plasma model.
-
4.
In the X-ray color-color plot, a significant fraction of the bulge () and ring () sources with relatively small color errors are located in the region expected for LMXBs. On average, the ring XRB population has a harder soft X-ray color, suggesting that the ring XRBs are more obscured, probably associated with ongoing/recent star-forming activities in the ring.
-
5.
We constructed full-band XLFs for the bulge and ring regions, taking into account the detection incompleteness and background AGN contamination. The resulting 90% completeness limits are and erg s-1 for the bulge and ring populations, respectively. The ring XRB population is heavily contaminated () by background AGNs. Both XLFs can be fit with a broken power-law model. The shapes are consistent with those expected for populations dominated by LMXBs. The ring XLF appears flatter than the bulge XLF, indicating that the ring hosts a larger fraction of luminous sources and is likely associated with a younger stellar population.
-
6.
We successfully modeled the bulge and ring combined XLF with a PS model, utilizing our current knowledge of the galaxy properties. The model is consistent with those for typical old elliptical galaxies, suggesting that an old LMXB population is dominating the observed XLF. The relative enrichment of luminous sources of NGC 1291 can be attributed a younger XRB population originated from the ring star-forming region.
-
7.
We consider that the ring of NGC 1291 hosts a younger stellar population than the bulge based on the X-ray studies presented in this paper.
This work is supported by NASA grant GO0-11104X. We acknowledge support from the CXC, which is operated by the Smithsonian Astrophysical Observatory (SAO) for and on behalf of NASA under Contract NAS8-03060. S. Pellegrini acknowledges partial support from ASI/INAF grant I/009/10/0. P. Tzanavaris acknowledges support through a NASA Postdoctoral Program Fellowship at Goddard Space Flight Center, administered by Oak Ridge Associated Universities through a contract with NASA. We thank the referee for carefully reviewing the manuscript and providing helpful comments.
References
- Appleton & Struck-Marcell (1996) Appleton, P. N., & Struck-Marcell, C. 1996, Fund. Cosmic Phys., 16, 111
- Arnaud (1996) Arnaud, K. A. 1996, in ASP Conf. Ser., Vol. 101, Astronomical Data Analysis Software and Systems V, ed. G. H. Jacoby & J. Barnes, 17
- Baganoff et al. (2003) Baganoff, F. K., Maeda, Y., Morris, M., et al. 2003, ApJ, 591, 891
- Bauer et al. (2004) Bauer, F. E., Alexander, D. M., Brandt, W. N., et al. 2004, AJ, 128, 2048
- Belczynski et al. (2010) Belczynski, K., Bulik, T., Fryer, C. L., et al. 2010, ApJ, 714, 1217
- Belczynski et al. (2002) Belczynski, K., Kalogera, V., & Bulik, T. 2002, ApJ, 572, 407
- Belczynski et al. (2008) Belczynski, K., Kalogera, V., Rasio, F. A., et al. 2008, ApJS, 174, 223
- Belczynski et al. (2004) Belczynski, K., Kalogera, V., Zezas, A., & Fabbiano, G. 2004, ApJ, 601, L147
- Belczynski et al. (2007) Belczynski, K., Taam, R. E., Kalogera, V., Rasio, F. A., & Bulik, T. 2007, ApJ, 662, 504
- Brassington et al. (2010) Brassington, N. J., Fabbiano, G., Blake, S., et al. 2010, ApJ, 725, 1805
- Brassington et al. (2008) Brassington, N. J., Fabbiano, G., Kim, D.-W., et al. 2008, ApJS, 179, 142
- Brassington et al. (2009) —. 2009, ApJS, 181, 605
- Broos et al. (2010) Broos, P. S., Townsley, L. K., Feigelson, E. D., et al. 2010, ApJ, 714, 1582
- Buta & Combes (1996) Buta, R., & Combes, F. 1996, Fund. Cosmic Phys., 17, 95
- Cash (1979) Cash, W. 1979, ApJ, 228, 939
- Chomiuk & Povich (2011) Chomiuk, L., & Povich, M. S. 2011, AJ, 142, 197
- Colbert et al. (2004) Colbert, E. J. M., Heckman, T. M., Ptak, A. F., Strickland, D. K., & Weaver, K. A. 2004, ApJ, 602, 231
- Crocker et al. (1996) Crocker, D. A., Baugus, P. D., & Buta, R. 1996, ApJS, 105, 353
- de Vaucouleurs (1948) de Vaucouleurs, G. 1948, Annales d’Astrophysique, 11, 247
- de Vaucouleurs (1975) —. 1975, ApJS, 29, 193
- de Vaucouleurs et al. (1991) de Vaucouleurs, G., de Vaucouleurs, A., Corwin, Jr., H. G., et al. 1991, Third Reference Catalogue of Bright Galaxies, ed. Roman, N. G., de Vaucouleurs, G., de Vaucouleurs, A., Corwin, H. G., Jr., Buta, R. J., Paturel, G., & Fouqué, P.
- Dickey & Lockman (1990) Dickey, J. M., & Lockman, F. J. 1990, ARA&A, 28, 215
- Done et al. (2007) Done, C., Gierliński, M., & Kubota, A. 2007, A&A Rev., 15, 1
- Eddington (1913) Eddington, A. S. 1913, MNRAS, 73, 359
- Evans et al. (2010) Evans, I. N., Primini, F. A., Glotfelty, K. J., et al. 2010, ApJS, 189, 37
- Fabbiano (2006) Fabbiano, G. 2006, ARA&A, 44, 323
- Fabbiano et al. (2010) Fabbiano, G., Brassington, N. J., Lentati, L., et al. 2010, ApJ, 725, 1824
- Finkelman et al. (2011) Finkelman, I., Moiseev, A., Brosch, N., & Katkov, I. 2011, MNRAS, in press (arXiv:1108.3079)
- Finoguenov & Jones (2002) Finoguenov, A., & Jones, C. 2002, ApJ, 574, 754
- Fragos et al. (2008) Fragos, T., Kalogera, V., Belczynski, K., et al. 2008, ApJ, 683, 346
- Fragos et al. (2009) Fragos, T., Kalogera, V., Willems, B., et al. 2009, ApJ, 702, L143
- Freeman et al. (2002) Freeman, P. E., Kashyap, V., Rosner, R., & Lamb, D. Q. 2002, ApJS, 138, 185
- Gao et al. (2003) Gao, Y., Wang, Q. D., Appleton, P. N., & Lucas, R. A. 2003, ApJ, 596, L171
- Garmire et al. (2003) Garmire, G. P., Bautz, M. W., Ford, P. G., Nousek, J. A., & Ricker, Jr., G. R. 2003, Proc. SPIE, 4851, 28
- Gehrels (1986) Gehrels, N. 1986, ApJ, 303, 336
- Gilfanov (2004) Gilfanov, M. 2004, MNRAS, 349, 146
- Gilli et al. (2007) Gilli, R., Comastri, A., & Hasinger, G. 2007, A&A, 463, 79
- Grimm et al. (2002) Grimm, H.-J., Gilfanov, M., & Sunyaev, R. 2002, A&A, 391, 923
- Grimm et al. (2003) Grimm, H.-J., Gilfanov, M., & Sunyaev, R. 2003, MNRAS, 339, 793
- Grimm et al. (2005) Grimm, H.-J., McDowell, J., Zezas, A., Kim, D.-W., & Fabbiano, G. 2005, ApJS, 161, 271
- Grouchy et al. (2010) Grouchy, R. D., Buta, R. J., Salo, H., & Laurikainen, E. 2010, AJ, 139, 2465
- Higdon (1993) Higdon, J. L. 1993, PhD thesis, Texas Univ., Austin.
- Hoag (1950) Hoag, A. A. 1950, AJ, 55, 170
- Hornschemeier et al. (2001) Hornschemeier, A. E., Brandt, W. N., Garmire, G. P., et al. 2001, ApJ, 554, 742
- Irwin et al. (2003) Irwin, J. A., Athey, A. E., & Bregman, J. N. 2003, ApJ, 587, 356
- Irwin et al. (2002) Irwin, J. A., Sarazin, C. L., & Bregman, J. N. 2002, ApJ, 570, 152
- Ivanova & Taam (2003) Ivanova, N., & Taam, R. E. 2003, ApJ, 599, 516
- Kennicutt et al. (2003) Kennicutt, Jr., R. C., Armus, L., Bendo, G., et al. 2003, PASP, 115, 928
- Kilgard et al. (2005) Kilgard, R. E., Cowan, J. J., Garcia, M. R., et al. 2005, ApJS, 159, 214
- Kim et al. (2004) Kim, D., Cameron, R. A., Drake, J. J., et al. 2004, ApJS, 150, 19
- Kim & Fabbiano (2004) Kim, D.-W., & Fabbiano, G. 2004, ApJ, 611, 846
- Kim & Fabbiano (2010) —. 2010, ApJ, 721, 1523
- Kim et al. (2009) Kim, D.-W., Fabbiano, G., Brassington, N. J., et al. 2009, ApJ, 703, 829
- King (2004) King, A. R. 2004, MNRAS, 347, L18
- Kormendy & Kennicutt (2004) Kormendy, J., & Kennicutt, Jr., R. C. 2004, ARA&A, 42, 603
- Kraft et al. (1991) Kraft, R. P., Burrows, D. N., & Nousek, J. A. 1991, ApJ, 374, 344
- Linden et al. (2010) Linden, T., Kalogera, V., Sepinsky, J. F., et al. 2010, ApJ, 725, 1984
- Linden et al. (2009) Linden, T., Sepinsky, J. F., Kalogera, V., & Belczynski, K. 2009, ApJ, 699, 1573
- Liu et al. (2006) Liu, J.-F., Bregman, J. N., & Irwin, J. 2006, ApJ, 642, 171
- Luo et al. (2008) Luo, B., Bauer, F. E., Brandt, W. N., et al. 2008, ApJS, 179, 19
- Lyons (1991) Lyons, L. 1991, Data Analysis for Physical Science Students (Cambridge: Cambridge Univ. Press)
- Marston & Appleton (1995) Marston, A. P., & Appleton, P. N. 1995, AJ, 109, 1002
- Mebold et al. (1979) Mebold, U., Goss, W. M., Siegman, B., van Woerden, H., & Hawarden, T. G. 1979, A&A, 74, 100
- Moiseev & Bizyaev (2009) Moiseev, A. V., & Bizyaev, D. V. 2009, New A Rev, 53, 169
- Noll et al. (2009) Noll, S., Burgarella, D., Giovannoli, E., et al. 2009, A&A, 507, 1793
- Park et al. (2006) Park, T., Kashyap, V. L., Siemiginowska, A., et al. 2006, ApJ, 652, 610
- Perrine (1922) Perrine, C. D. 1922, MNRAS, 82, 486
- Phillips (1996) Phillips, A. C. 1996, in Astronomical Society of the Pacific Conference Series, Vol. 91, IAU Colloq. 157: Barred Galaxies, ed. R. Buta, D. A. Crocker, & B. G. Elmegreen, 44
- Postnov & Kuranov (2005) Postnov, K. A., & Kuranov, A. G. 2005, Astronomy Letters, 31, 7
- Prestwich et al. (2003) Prestwich, A. H., Irwin, J. A., Kilgard, R. E., et al. 2003, ApJ, 595, 719
- Prestwich et al. (2009) Prestwich, A. H., Kilgard, R. E., Primini, F., McDowell, J. C., & Zezas, A. 2009, ApJ, 705, 1632
- Ptak et al. (1999) Ptak, A., Serlemitsos, P., Yaqoob, T., & Mushotzky, R. 1999, ApJS, 120, 179
- Remillard & McClintock (2006) Remillard, R. A., & McClintock, J. E. 2006, ARA&A, 44, 49
- Revnivtsev et al. (2011) Revnivtsev, M., Postnov, K., Kuranov, A., & Ritter, H. 2011, A&A, 526, A94+
- Risaliti et al. (2002) Risaliti, G., Elvis, M., & Nicastro, F. 2002, ApJ, 571, 234
- Ryder et al. (1996) Ryder, S. D., Buta, R. J., Toledo, H., et al. 1996, ApJ, 460, 665
- Sarazin et al. (2000) Sarazin, C. L., Irwin, J. A., & Bregman, J. N. 2000, ApJ, 544, L101
- Sell et al. (2011) Sell, P. H., Pooley, D., Zezas, A., et al. 2011, ApJ, 735, 26
- Smith et al. (2007) Smith, J. D. T., Draine, B. T., Dale, D. A., et al. 2007, ApJ, 656, 770
- Swartz et al. (2004) Swartz, D. A., Ghosh, K. K., Tennant, A. F., & Wu, K. 2004, ApJS, 154, 519
- Turner et al. (1997) Turner, T. J., George, I. M., Nandra, K., & Mushotzky, R. F. 1997, ApJS, 113, 23
- van Driel et al. (1988) van Driel, W., Rots, A. H., & van Woerden, H. 1988, A&A, 204, 39
- Voss & Ajello (2010) Voss, R., & Ajello, M. 2010, ApJ, 721, 1843
- Voss & Gilfanov (2006) Voss, R., & Gilfanov, M. 2006, A&A, 447, 71
- Voss & Gilfanov (2007) —. 2007, A&A, 468, 49
- Wolter & Trinchieri (2004) Wolter, A., & Trinchieri, G. 2004, A&A, 426, 787
- Xue et al. (2011) Xue, Y. Q., Luo, B., Brandt, W. N., et al. 2011, ApJS, 195, 10
- Zezas et al. (2007) Zezas, A., Fabbiano, G., Baldi, A., et al. 2007, ApJ, 661, 135
- Zhang et al. (2011) Zhang, Z., Gilfanov, M., Voss, R., et al. 2011, A&A, 533, A33
| Obs. ID | Start Date | Exp (ks) | Cleaned Exp (ks) | PI |
|---|---|---|---|---|
| (1) | (2) | (3) | (4) | (5) |
| 795 | 2000 Jun 27 | 39.7 | 37.6 | J. A. Irwin |
| 2059 | 2000 Dec 7 | 37.0 | 22.8 | A. H. Prestwich |
| 11272 | 2010 May 4 | 70.0 | 69.1 | G. Fabbiano |
| 11273 | 2010 May 8 | 50.0 | 49.1 | G. Fabbiano |
Note. — Column 1: Chandra observation identification number. Column 3: Observation start data. Column 3: Nominal exposure time. Column 4: Exposure time after removing background flares. Column 5: Name of the Principal Investigator.
| X-ray Coordinates | Counts | |||||||||
|---|---|---|---|---|---|---|---|---|---|---|
| XID | Off-Axis | FB | FB Low Err | FB Up Err | SB | SB Low Err | SB Up Err | |||
| (1) | (2) | (3) | (4) | (5) | (6) | (7) | (8) | (9) | (10) | (11) |
| 1 … | 03 16 47.17 | 41 08 15.2 | 4.6 | 6.2 | 29.9 | 5.9 | 7.2 | 19.2 | 4.8 | 6.2 |
| 2 … | 03 16 47.62 | 41 05 34.2 | 4.2 | 5.9 | 144.8 | 13.0 | 14.2 | 106.9 | 11.3 | 12.6 |
| 3 … | 03 16 48.09 | 41 04 10.1 | 4.6 | 6.2 | 6.6 | 2.8 | 4.2 | 10.8 | 1.0 | 1.0 |
Note. — Units of right ascension are hours, minutes, and seconds, and units of declination are degrees, arcminutes, and arcseconds. (This table is available in its entirety in a machine-readable form in the online journal. A portion is shown here for guidance regarding its form and content. The full table contains 34 columns of information on the 169 X-ray sources.)
| Observation | dof | |||
|---|---|---|---|---|
| ( cm-2) | ( erg s-1) | |||
| (1) | (2) | (3) | (4) | (5) |
| 795 | 0.84 | |||
| 2059 | 0.93 | |||
| 11272 | 1.21 | |||
| 11273 | 1.11 |
Note. — The spectra were fit with an absorbed power law plus thermal plasma model (wabs1*apec+wabs2*pow). and are the absorption column density and photon index for the power-law component, respectively. The temperature ( keV) and column density ( cm-2) of the thermal component were fixed at the values derived from the stacked spectrum. The observed 2.0–8.0 keV luminosities are dominated by the power-law component.
| Region | Single Power-law | Broken Power-law | |||||||
|---|---|---|---|---|---|---|---|---|---|
| erg s-1) | |||||||||
| Bulge | 143 | 138 | |||||||
| Ring | 159 | 153 | |||||||
Note. — and are the Cash fit statistic values for the power-law and broken power-law fit, respectively. See Equations (2) and (3) for the definition of the other parameters.
| Parameter | Notation | Value |
|---|---|---|
| Star Formation History | Noll et al. (2009) | |
| Metallicity | 0.02 | |
| Total Stellar Mass | ||
| Binary Fraction | 50% | |
| IMF power-law slope | -2.7 or -2.35 | |
| CE Efficiency | 0.1, 0.2, 0.3, or 0.5 | |
| Stellar wind strength | 0.25, 1.0, or 2.0 | |
| CE during HG | Yes or No | |
| Magnetic Braking | Ivanova & Taam (2003) |