The discovery of high power – high synchrotron peak blazars
Abstract
We study the quasi-simultaneous near-IR, optical, UV, and X-ray photometry of eleven -ray selected blazars for which redshift estimates larger than 1.2 have been recently provided. Four of these objects turn out to be high-power blazars with the peak of their synchrotron emission between and Hz, and therefore of a kind predicted to exist but never seen before. This discovery has important implications for our understanding of physical processes in blazars, including the so-called “blazar sequence”, and might also help constraining the extragalactic background light through -ray absorption since two sources are strongly detected even in the 10100 GeV Fermi -LAT band. Based on our previous work and their high powers, these sources are very likely high-redshift flat-spectrum radio quasars with their emission lines swamped by the non-thermal continuum.
keywords:
BL Lacertae objects: general — radiation mechanisms: non-thermal — gamma-rays: observations — radio continuum: galaxies — X-rays: galaxies1 Introduction
Blazars are radio loud active galactic nuclei (AGN) with their jets pointing towards the observer (see e.g. Blandford & Rees, 1978; Urry & Padovani, 1995). Observationally, they come in two main flavours with very different optical spectra. Namely, Flat Spectrum Radio Quasars (FSRQs) have strong, broad emission lines, just like radio quiet quasars, while BL Lacertae objects (BL Lacs) show at most weak emission lines, sometimes display absorption features, and can also be completely featureless.
Blazars emit variable, non-thermal radiation across the whole electromagnetic spectrum, which includes two components forming two broad humps in a representation. The low-energy one is attributed to synchrotron radiation and the high-energy one is usually thought to be due to inverse Compton radiation (e.g. Abdo et al., 2010b). The peak of the synchrotron emission () can occur over a wide range of frequencies, from about Hz to over Hz, reflecting the maximum energy at which particles can be accelerated (e.g. Giommi et al., 2012b). Blazars with rest-frame Hz are called Low Synchrotron Peaked (LSP) sources, while those with Hz Hz and Hz are called Intermediate and High Synchrotron Peaked (ISP and HSP) sources, respectively (Abdo et al., 2010b). These definitions expand on the original division of BL Lacs into LBL and HBL sources first introduced by Padovani & Giommi (1995).
The location of the synchrotron peak implies different mechanisms for the X-ray emission, namely inverse Compton in LSPs, which have hard energy index () spectra, and an extension of the synchrotron emission responsible for the lower energy continuum in HSPs, which typically display steeper () X-ray spectra111Unless is in the X-ray band, where one samples the top of the synchrotron hump and the X-ray spectrum is also relatively flat (Padovani & Giommi, 1996). (e.g. Padovani & Giommi, 1996; Wolter et al., 1998; Padovani et al., 2004).
The distribution of the synchrotron peak frequency is extremely different for the two blazar classes. While the rest-frame distribution of FSRQs is strongly peaked at low frequencies ( Hz) and never reaches high values ( Hz) (Giommi et al., 2012b), the distribution of BL Lacs is shifted to higher values by at least one order of magnitude and can reach as high as Hz. In other words, while BL Lacs can be of the LSP and HSP type, FSRQs appear to be solely LSPs.
The origin of this difference has been discussed at length in the literature. In a series of papers, Padovani, Giommi, and collaborators, looked for HSP FSRQs using multi-wavelength catalogues and the deep X-ray radio blazar survey (DXRBS; e.g. Padovani et al., 2003) with only limited success. In fact, while FSRQs with possibly larger than previously known were discovered, follow-up X-ray observations showed in most cases a relatively flat X-ray spectrum. This, together with their overall spectral energy distributions (SEDs), was suggestive of inverse Compton emission (e.g. Padovani et al., 2002; Landt et al., 2008) and did not support a possible HSP classification. The only exception is RGB J1629+4008, with Hz and steep X-ray spectrum (Padovani et al., 2002). ROXA J081009.9+384757.047 was also suggested to be an HSP (Giommi et al., 2007) but new WISE data (Wright et al., 2010) indicate that the near-IR and optical flux can be attributed to accretion (the big “blue bump”) and that the peak of the non-thermal synchrotron radiation is located in the far infrared, making this object a typical LSP.
The purported non-existence of HSP FSRQs implied also the lack of high-power HSP blazars (since FSRQs are more powerful than BL Lacs), which was also hinted at by a suggested anti-correlation between bolometric luminosity and (the so-called “blazar sequence”; Fossati et al., 1998). This has been interpreted by some researchers as an intrinsic physical difference between LSPs and HSPs. Since HSPs are typically characterized by a low intrinsic power and external radiation field, given their very weak or absent emission lines, cooling was thought to be less dramatic than in LSPs allowing particles to reach energies high enough to produce synchrotron emission well into the X-ray band (Ghisellini et al., 1998). In this respect, RGB 1629+4008, with its relatively low radio power, W Hz-1, was regarded as fitting on the sequence as well (Padovani et al., 2002).
Giommi et al. (2012a) have recently presented a new scenario, where blazars are classified as FSRQs, BL Lacs, LSPs, or HSPs according to a varying mix of the Doppler boosted radiation from the jet, emission from the accretion disk, the broad line region, and the host galaxy. This hypothesis predicts the existence of high power – high blazars, which however would be very hard to identify because of their featureless optical spectra and, therefore, lack of redshift. This is because when both and radio power are large the dilution by the non-thermal continuum becomes extreme and all optical features are washed away.
Very recent results provide a simple way to test this prediction and look for the existence of previously unidentified high power HSPs. Rau et al. (2012) have presented redshift constraints for 103 blazars from the Fermi 2LAC catalogue (Ackermann et al., 2011) by fitting SED templates to their UV-to-near-IR multi-band photometry obtained quasi-simultaneously with Swift/UVOT and GROND (Greiner et al., 2008). In fact, attenuation due to neutral hydrogen along the line of sight at the Lyman limit allows an accurate estimate of the redshift of the absorber and thereby provides a reliable lower limit to the blazar redshift. Eleven of their objects have and for eight such sources these are the first reliable redshift measurements. Since the spectrum of most of these sources is featureless and high redshift typically means high power, this is an ideal sample to look for high power HSPs with their lines completely swamped by the non-thermal continuum, which is the purpose of this work.
Throughout this paper we use a CDM cosmology with km s-1 Mpc-1, and (Komatsu et al., 2011).
2 SEDs of the newly identified high redshift blazars
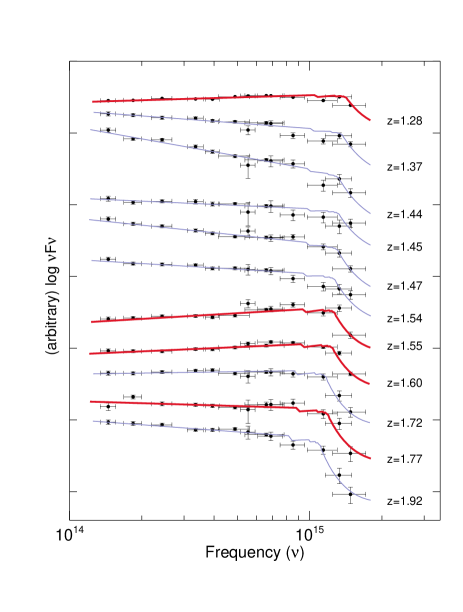
Fig. 1 plots the near-IR through UV SEDs of all eleven blazars with from Rau et al. (2012) in a representation. Taking into account the obvious decrease in flux at high frequencies due to neutral hydrogen absorption, it is already clear from these SEDs covering only about one decade in frequency that a few of the sources do appear to have Hz, which qualifies them as HSPs. We have then assembled the SEDs of all eleven sources over the whole electromagnetic spectrum by using the SED builder tool available at the ASDC (tools.asdc.asi.it/SED, Stratta et al., 2011). As mentioned in the Introduction, a key requirement for an HSP classification is a steep X-ray spectrum (for Hz). Since the Swift/X-ray Telescope (XRT) observes contemporaneously with Swift/UVOT, our sources have quasi-simultaneous coverage from the GROND bands into the X-ray regime, i.e. between and Hz. This is an ideal situation to determine for HSPs.
| Name | Fermi Name | Optical Coordinatesa | |||||
| mJy | AB | erg/cm2/s | ph/cm2/s | ||||
| RX J0035.2+1515 | 2FGLJ0035.2+1515 | 00 35 14.7 +15 15 04.2 | |||||
| SUMSS J053748571828 | 2FGLJ0537.75716 | 05 37 49.0 57 18 30.4 | |||||
| CRATES J06302406 | 2FGLJ0630.92406 | 06 30 59.5 24 06 46.2 | |||||
| CRATES J13122156 | 2FGLJ1312.42157 | 13 12 31.6 21 56 23.5 | 349.8 | 16.56 | |||
| aFrom Rau et al. (2012) | |||||||
| bRadio flux density at 843 MHz | |||||||
It turns out that four sources are HSPs, whose main observational parameters are given in Table 1. We determined rest-frame values by fitting a third degree polynomial222This represents the simplest way to estimate in a straightforward and model-independent way. to the radio data, the GROND and UVOT data below the Lyman limit, and the quasi-simultaneous Swift/XRT data. We also fitted the X-ray data (using the XSPEC12.0 package) adopting a simple power law spectral model with the low energy absorption fixed to the Galactic value in the direction of the source (Dickey & Lockman, 1990). In two cases, given the relatively short exposure times, we used the XIMAGE package (Giommi et al., 1992) V4.5333XIMAGE is part of the HEASARC Xanadu standard software package for multi-mission X-ray astronomy. to estimate the source count rates in the soft ( keV) and hard ( keV) X-ray energy bands and derive an estimate of the spectral slope. In the case of CRATES J13122156, however, we could only get a upper limit at higher energies, which translates into a lower limit to the slope.
| Name | log | log | log | a | |
| Hz (rest-frame) | erg s-1 | W Hz-1 | (0.5 – 10 keV) | (100 MeV – 100 GeV) | |
| RX J0035.2+1515 | 15.8 | 46.6 | 26.2 | ||
| SUMSS J053748571828 | 15.5 | 46.6 | 27.1b | c | |
| CRATES J06302406 | 16.0 | 47.1 | 27.1 | ||
| CRATES J13122156 | 15.6 | 46.9 | 27.7 | c | |
| aFrom Abdo et al. (2012) | |||||
| bExtrapolated from 843 MHz assuming | |||||
| cDerived from the count rates in the and keV bands | |||||
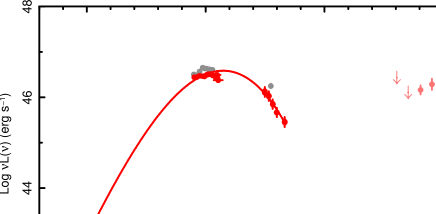
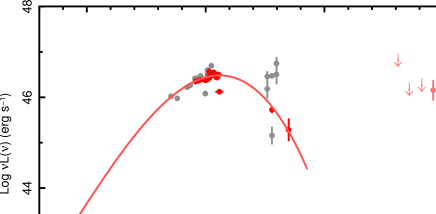
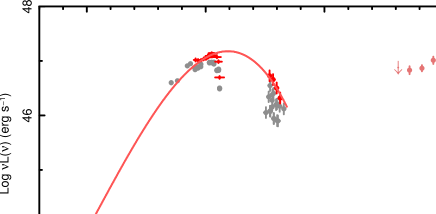
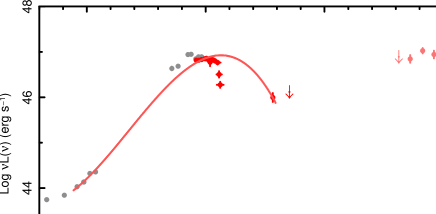
The SEDs for the HSPs are shown in Figs. 2 – 5 while Table 2 gives , , , , and . All four sources are characterized by Hz and a rising -ray spectrum (). Three of the sources display also a very steep X-ray spectrum (), while for the fourth one we can only say that . and are quite high, being erg s-1 and W Hz-1, i.e. typical of FSRQs. We also note that SUMSS J053748571828 shows clear evidence of X-ray variability of the type displayed by HSPs in the X-ray band when this is beyond . Similarly, CRATES J06302406 also shows evidence of X-ray variability, with Swift/XRT data taken at different times still displaying a steep X-ray spectrum.
3 Discussion and Implications
All of the observational evidence suggests that we have discovered four blazars of a previously unknown type, that is sources having both high power ( erg s-1) and high ( Hz). These objects have also radio powers orders of magnitude larger than the only previously known HSP FSRQ and therefore are firmly into the FSRQ regime (unlike RGB 1629+4008, which was near the low-luminosity end of the FSRQ luminosity function: Padovani et al., 2002).
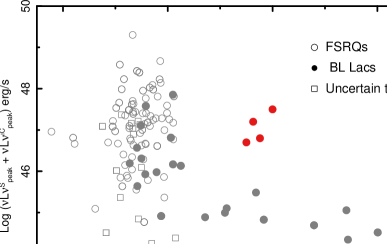
To put things into perspective, Fig. 6, adapted from Giommi et al. (2012b), plots the bolometric power (i.e., the sum of the synchrotron and inverse Compton peak powers) for blazars selected in the radio, X-ray and -ray-bands, against . Our HSPs end up in an empty region of the plot, where no objects were found before. Similar results are obtained if all 2LAC BL Lacs with redshifts are also included.
Our estimates are robust, as they are based on quasi-simultaneous coverage over four decades in frequency and are corroborated in at least three cases by a steep X-ray spectrum. Contamination by a thermal (accretion disk) component is ruled out by the featureless spectra of these sources and also by the fact that the flux of an accretion disk fitted using the scaling of Giommi et al. (2012a) would be well below the observational data. Our sources also end up in the HBL region of the – plot of Padovani et al. (2004) (their Fig. 5).
These four sources are also the only ones with , as the other seven in the Rau et al. (2012) sample have (Abdo et al., 2012). While one is borderline with , three have . We note that no FSRQ, LSP, or ISP reach these low values in the Clean Sample of Ackermann et al. (2011). It is also interesting to note that 4/6 of the remaining objects in the Rau et al. (2012) sample (excluding the FSRQ OM 235) have Hz and therefore qualify as ISPs.
In the radio power – plot of Giommi et al. (2012a) (their Fig. 11) the newly discovered HSPs end up in the region of parameter space mostly populated by sources without redshift, which agrees with the fact that, indeed, these sources have totally featureless optical spectra. Based on that paper, our sources are very likely FSRQs with their emission lines swamped by the non-thermal continuum. Given their large powers, this makes sense also on statistical grounds. Indeed, for erg s-1, which is the smallest value for our sources, previously known FSRQs outnumber BL Lacs by a factor in Fig. 6.
The discovery of high power HSPs has important implications and consequences for a variety of issues. We mention here some of the most prominent ones:
-
1.
our HSPs end up in an empty region of the – plot of Meyer et al. (2011) (see their Fig. 4). In fact, the closest sources with similar to those of our objects have more than an order of magnitude smaller. This implies that the so-called “blazar sequence” (Fossati et al., 1998; Ghisellini et al., 1998) is indeed heavily influenced by the selection effects described by Giommi et al. (2012a);
-
2.
it is well established that a large fraction of BL Lacs (% in BZCAT Massaro et al. (2009) and % of the BL Lacs in the Fermi 1 and 2 year AGN catalogs: Abdo et al., 2010a; Ackermann et al., 2011) have no measured redshift due to the lack of any detectable feature in their optical spectrum, despite the use of 8/10-m class optical telescopes for the spectroscopy identification campaign. This paper, together with the results of Rau et al. (2012), confirms the suggestion by Giommi et al. (2012a) that these sources are high-redshift blazars, most likely FSRQs with their emission lines swamped by the jet. Therefore: a) one should not assume for these objects a redshift typical of other BL Lacs but a much larger one (typically ); b) these sources should be included with the FSRQs when studying cosmological evolution and luminosity functions, since their exclusion is bound to bias the results;
-
3.
the study of distant very high energy (VHE) emitting AGN is of fundamental importance to constrain the extragalactic background light (EBL). The -ray flux from distant blazars is in fact absorbed on its way from the source through its interaction with EBL photons. One can then use the measurement of the induced distortions to derive constraints on the EBL density (e.g. Mazin & Raue, 2007). The discovery of high redshift, -ray emitting blazars, strongly detected in the Fermi highest energy band ( GeV) in the case of RX J0035.2+1515 and CRATES J06302406 (see Figs. 2 and 4), is therefore very important also in this context. Some of the high-redshift sources of the type described in this paper may be detectable by existing Cherenkov telescopes, as the GeV Fermi fluxes of both sources discussed above are within the range of observed values of blazars that have already been detected at TeV energies. The next generation of VHE telescopes, particularly the Cherenkov Telescope Array, will be able to detect many such sources, especially if the low energy threshold will reach GeV, as planned.
Acknowledgments
We acknowledge the use of data and software facilities from the ASI Science Data Center (ASDC), managed by the Italian Space Agency (ASI). Part of this work is based on archival data and on bibliographic information obtained from the NASA/IPAC Extragalactic Database (NED) and from the Astrophysics Data System (ADS) Bibliographic Services. Part of the funding for GROND (both hardware as well as personnel) was generously granted from the Leibniz-Prize to Prof. G. Hasinger (DFG grant HA 1850/28-1).
References
- Abdo et al. (2010a) Abdo A. A., et al., 2010a, ApJ, 715, 429
- Abdo et al. (2010b) Abdo A. A., et al., 2010b, ApJ, 716, 30
- Abdo et al. (2012) Abdo A. A., et al., 2012, ApJS, in press (arXiv:1108.1435)
- Ackermann et al. (2011) Ackermann M., et al., 2011, ApJ, 743, 171
- Blandford & Rees (1978) Blandford R. D., Rees M. J., 1978, in Pittsburg Conference on BL Lac Objects, Ed. A. M. Wolfe, Pittsburgh, University of Pittsburgh press, p. 328
- Dickey & Lockman (1990) Dickey J. M., Lockman F. J., 1990, ARA&A, 28, 215
- Fossati et al. (1998) Fossati G., Maraschi L., Celotti A., Comastri A., Ghisellini G., 1998 MNRAS, 299, 433
- Ghisellini et al. (1998) Ghisellini G., Celotti A., Fossati G., Maraschi L., Comastri A., 1998, MNRAS, 301, 451
- Giommi et al. (1992) Giommi P., Angelini L., Jacobs, P., Tagliaferri G., 1992, ASPC, 25, 100
- Giommi et al. (2007) Giommi P., et al., 2007, A&A, 468, 97
- Giommi et al. (2012a) Giommi P., Padovani P., Polenta G., Turriziani S., D’Elia V., Piranomonte S., 2012a, MNRAS, in press (arXiv:1110.4706)
- Giommi et al. (2012b) Giommi P., et al., 2012b, A&A, in press (arXiv:1108.1114)
- Greiner et al. (2008) Greiner J., et al., 2008, PASP, 120, 405
- Komatsu et al. (2011) Komatsu E., et al., 2011, ApJS, 192, 18
- Landt et al. (2008) Landt H., Padovani P., Giommi P., Perri M., Cheung C. C., 2008, ApJ, 676, 87
- Massaro et al. (2009) Massaro E., Giommi P., Leto C., Marchegiani P., Maselli A., Perri M., Piranomonte S., Sclavi S., 2009, A&A, 495, 691
- Mazin & Raue (2007) Mazin D., Raue M., 2007, A&A, 471, 439
- Meyer et al. (2011) Meyer E. T., Fossati G., Georganopoulos M., Lister M. L., 2011, ApJ, 740, 9
- Padovani & Giommi (1995) Padovani P., Giommi P., 1995, ApJ, 444, 567
- Padovani & Giommi (1996) Padovani P., Giommi P., 1996, MNRAS, 279, 526
- Padovani et al. (2002) Padovani P., Costamante L., Ghisellini G., Giommi P., Perlman E., 2002, ApJ, 581, 895
- Padovani et al. (2003) Padovani P., Perlman E. S., Landt H., Giommi P., Perri M., 2003, ApJ, 588, 128
- Padovani et al. (2004) Padovani P., Costamante L., Giommi P., Ghisellini G., Celotti A., Wolter A., 2004, MNRAS, 347, 1282
- Rau et al. (2012) Rau A., et al., 2012, A&A, 538, A26
- Stratta et al. (2011) Stratta G., Capalbi M., Giommi P., Primavera R., Cutini S., Gasparrini D., 2011, arXiv:1103.0749
- Urry & Padovani (1995) Urry C. M., Padovani P., 1995, PASP, 107, 803
- Wolter et al. (1998) Wolter A., et al., 1998, A&A, 335, 899
- Wright et al. (2010) Wright E. L., et al., 2010, AJ, 140, 1868