The structure of star clusters in the outer halo of M31
Abstract
We present a structural analysis of halo star clusters in M31 based on deep Hubble Space Telescope (HST) Advanced Camera for Surveys (ACS) imaging. The clusters in our sample span a range in galactocentric projected distance from 13 to 100 kpc and thus reside in rather remote environments. Ten of the clusters are classical globulars, while four are from the Huxor et al. (2005, 2008) population of extended, old clusters. For most clusters, contamination by M31 halo stars is slight, and so the profiles can be mapped reliably to large radial distances from their centres. We find that the extended clusters are well fit by analytic King (1962) profiles with parsec core radii and parsec photometric tidal radii, or by Sérsic profiles of index (i.e. approximately exponential). Most of the classical globulars also have large photometric tidal radii in the range 50–100 parsec, however the King profile is a less good fit in some cases, particularly at small radii. We find 60% of the classical globular clusters exhibit cuspy cores which are reasonably well described by Sérsic profiles of index . Our analysis also reinforces the finding that luminous classical globulars, with half-light radii parsec, are present out to radii of at least 100 kpc in M31, which is in contrast to the situation in the Milky Way where such clusters (other than the unusual object NGC 2419) are absent beyond 40 kpc.
keywords:
galaxies: star clusters, galaxies: individual: M31, galaxies: haloes1 Introduction
In recent years the halo and outer disk of M31 have been the subject of several large-area imaging campaigns. By mapping the distribution of individual resolved stars to large radii, these have resulted in the discovery of considerable substructure (e.g., Ibata et al., 2001; Ferguson et al., 2002; Ibata et al., 2007; McConnachie et al., 2009), and the identification of previously unknown components in the outer regions of the galaxy (e.g., Irwin et al., 2005; Ibata et al., 2005; Gilbert et al., 2006). The same surveys have also been successful in extending the known dwarf galaxy (e.g., Zucker et al., 2004; Martin et al., 2006; Irwin et al., 2008; McConnachie et al., 2008; Martin et al., 2009; Richardson et al., 2011) and globular cluster systems.
In particular, our group has discovered a number of very remote globular clusters (GCs) (Huxor et al., 2004; Martin et al., 2006; Huxor et al., 2008, 2011), and also a population of more extended clusters (ECs), which have properties similar to the GCs but typical half-light radii nearly an order of magnitude larger (Huxor et al., 2005, 2008, 2011). What is clear from these studies is that the M31 GC system differs from that of the Milky Way in several respects, in addition to being times more numerous; notably it includes a significant population of bright GCs at large galactocentric radius and some of these are very diffuse (Mackey et al., 2007; Huxor et al., 2011). By contrast the outer GCs in the Milky Way, while often moderately extended in structure (typified by the “Palomar” clusters), are predominantly faint111A notable exception is the unusual, remote cluster NGC 2419, which has been argued may be the core of a stripped dwarf spheroidal (e.g., Mackey & van den Bergh, 2005; Cohen et al., 2010).. We note in passing that M31’s brighter dwarf spheroidals are also on the average more extended than the Milky Way’s, measured for example by half-light radius (McConnachie & Irwin, 2006; Richardson et al., 2011), although the significance and underlying nature of this discrepancy remains under debate (Collins et al., 2011; Brasseur et al., 2011).
Studies of the M31 GC system are important as it possesses the largest cluster population in the Local Group, and is sufficiently near to us that clusters can be resolved into stars with HST. Several authors have previously analysed HST images (mainly taken with WFPC2) of M31’s inner GC population (e.g., Grillmair et al., 1996; Holland, 1998; Barmby, Holland, & Huchra, 2002; Barmby et al., 2007; Strader, Caldwell, & Seth, 2011), finding their overall structural properties to be similar to those of the Milky-Way system in the same regime of galactocentric distance.
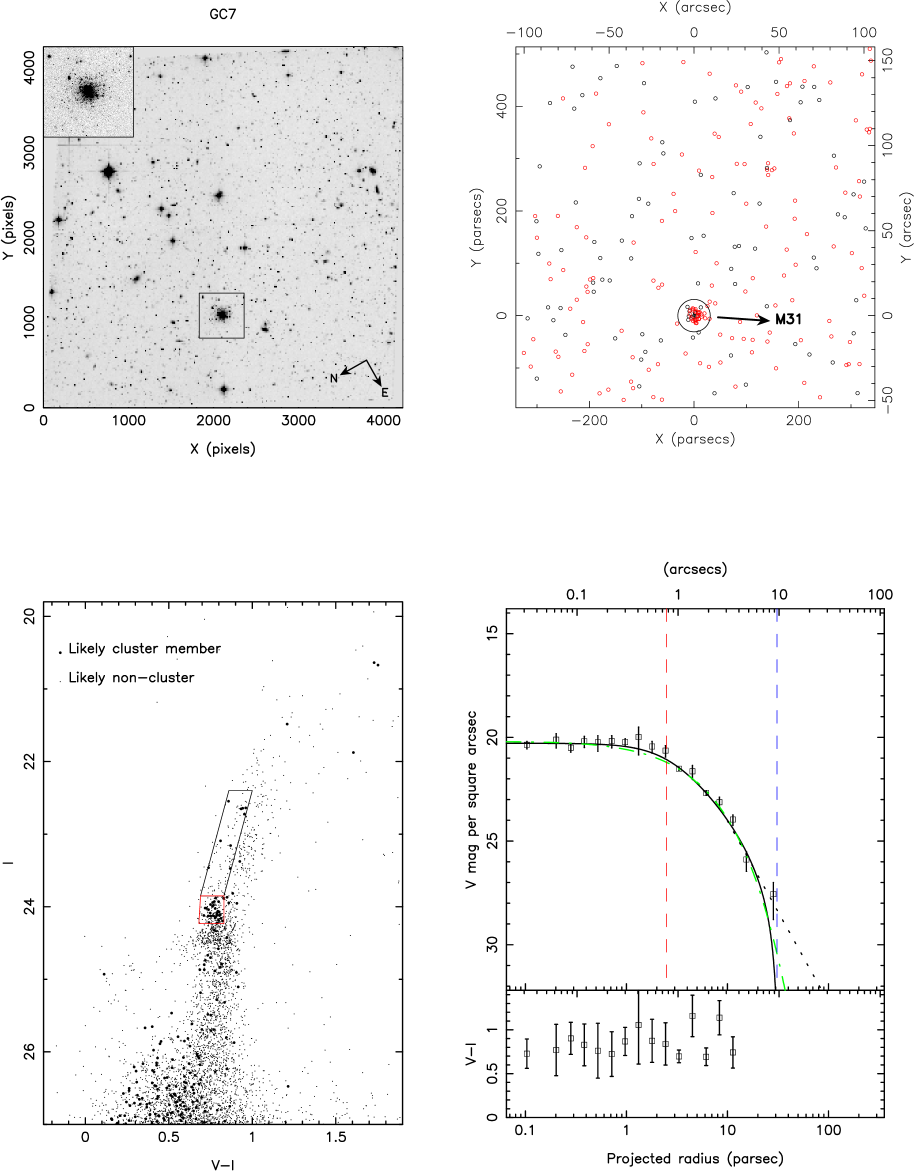
We have observed a subset of our outer cluster sample with HST Advanced Camera for Surveys (ACS; programme GO-10394, PI Tanvir). The targeted clusters included the first four extended clusters discovered, and ten classical clusters selected because of their large galactocentric radius. Photometric analyses of the clusters were presented in papers by Mackey et al. (2006, 2007), which also showed their spatial distribution around M31, while Richardson et al. (2009) presented an analysis of their surrounding field star populations. The clusters are generally old and metal poor, although one classical globular (GC7) has a relatively high metallicity derived from the red-giant branch locus of [Fe/H], and may be several Gyr younger than the rest of the sample (Mackey et al., 2007).
In this paper we consider the structural properties of this sample in a more detail than hitherto, using a combination of surface photometry and star count analysis. Such studies provide insight into the dynamical properties of clusters as well as their origin and evolution within the parent galaxy’s gravitational field. At large galactocentric radius we expect only small tidal stresses and also, because of their long orbital periods, that visits close to the galactic centre or disk may have been infrequent in the lifetimes of the clusters. On the other hand, it has been argued that many of the outer clusters in the Milky Way have been accreted from satellite galaxies (e.g., Zinn, 1993; Mackey & Gilmore, 2004), and the situation could be similar in M31. Indeed, the same surveys in which these clusters have been found have also provided evidence of abundant substructure in the M31 halo and outer disk – the fossil records of various accretion events – which we have recently shown show some statistical correlation with the distribution of outer GCs (Mackey et al., 2010a). Thus the properties of the outer clusters might alternatively reflect their formation within dwarf galaxies from which they have been accreted.
Particular goals of this paper are: (a) to compare the structural properties of the outer GCs with those of the inner galaxy, and the M31 GC system as a whole to the Milky Way’s system; (b) to search for evidence of tidal disruption as has been seen in a number of MW GCs (e.g., Grillmair et al., 1996), and might be particularly evident in the case of the extended clusters. The low density of contaminating field stars at these large galactocentric radii lends itself to these studies.
2 Observations and Data analysis
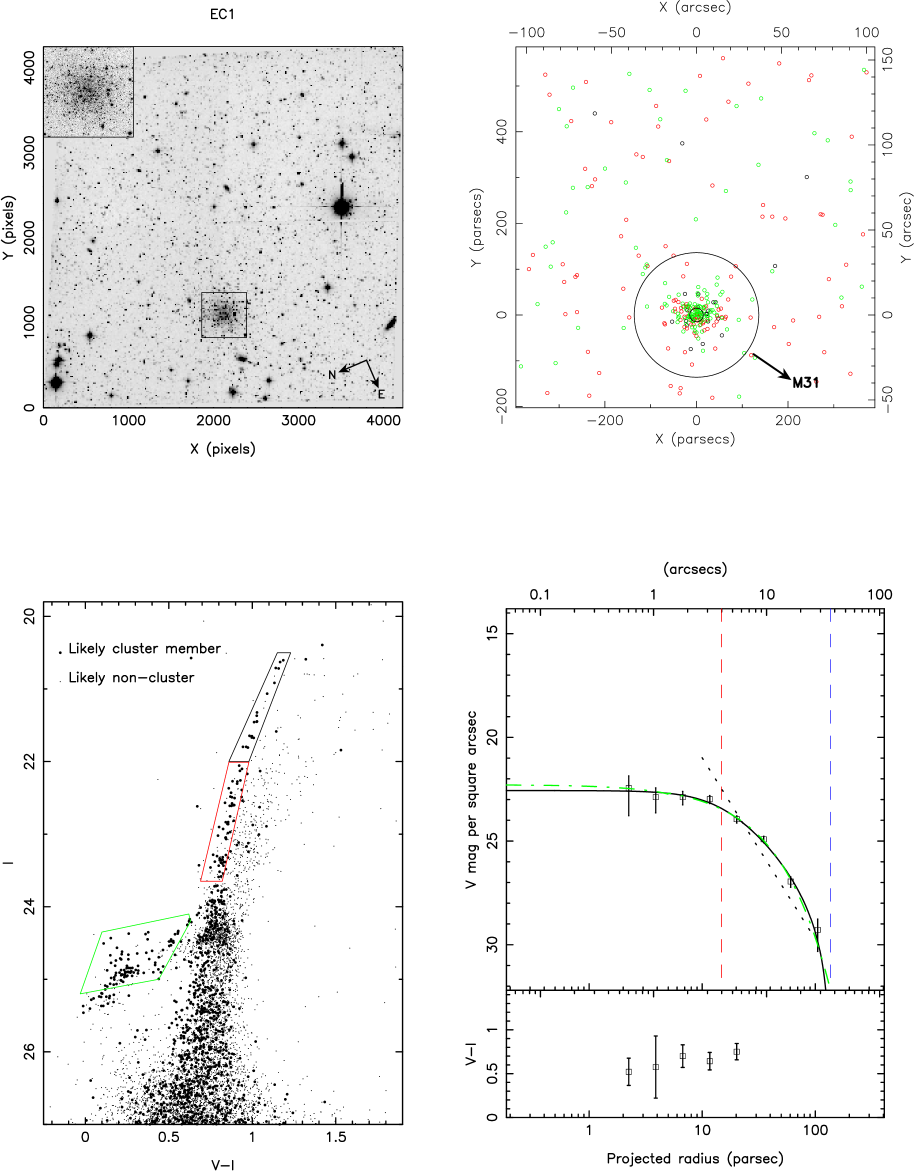
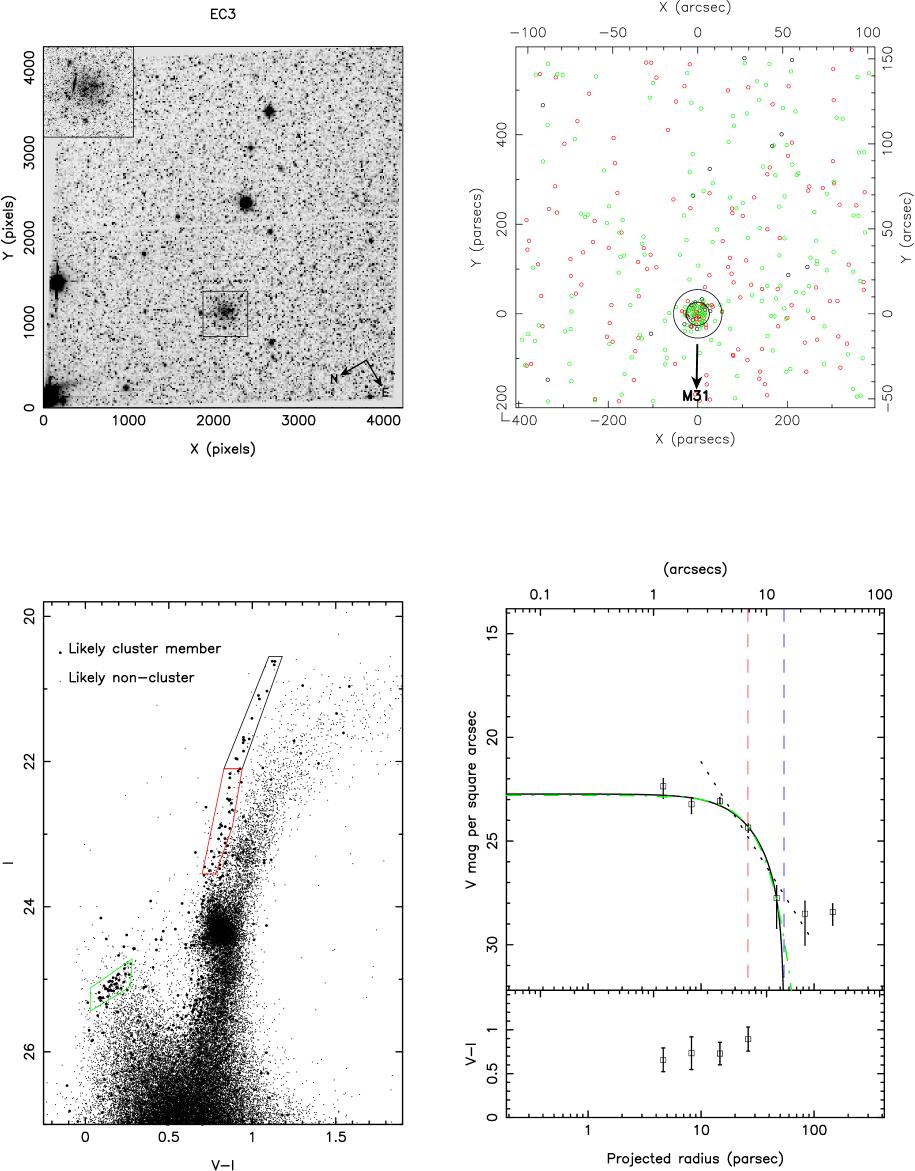
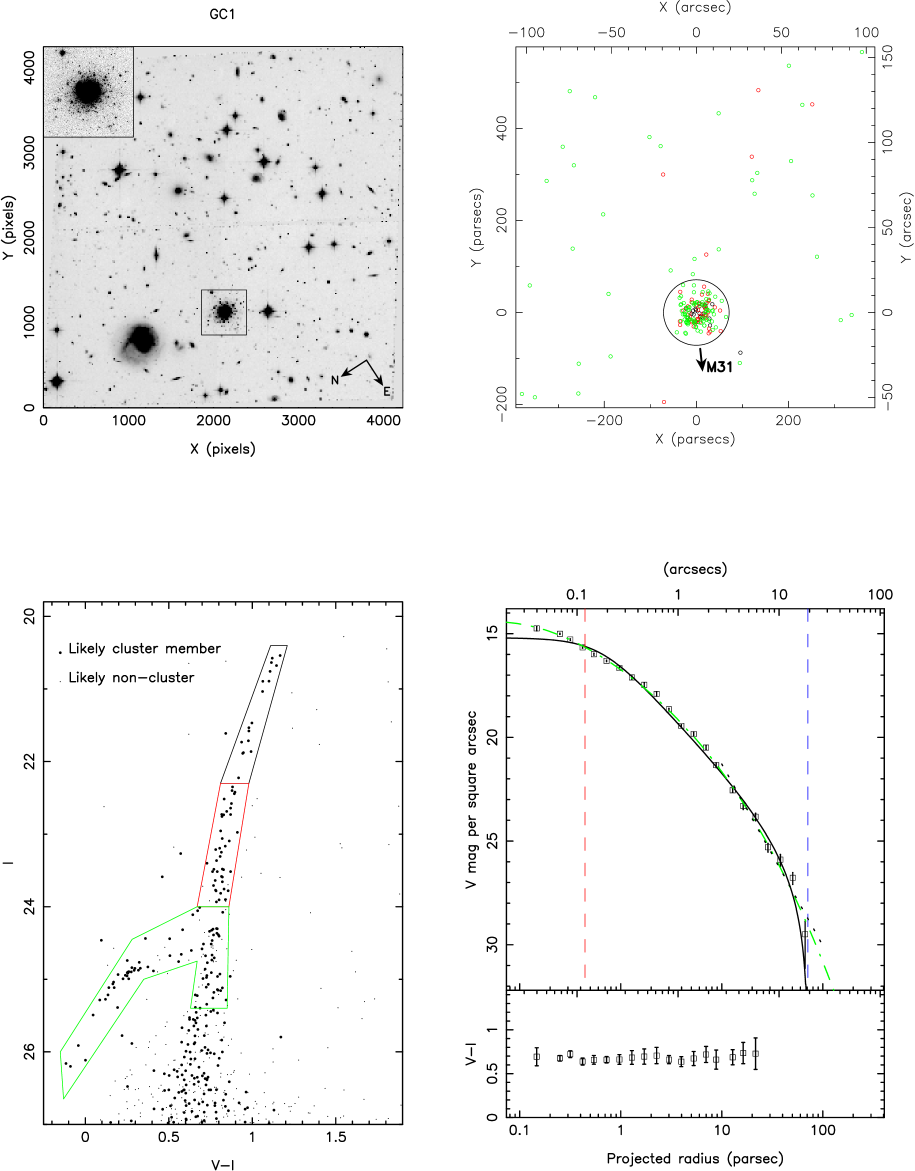
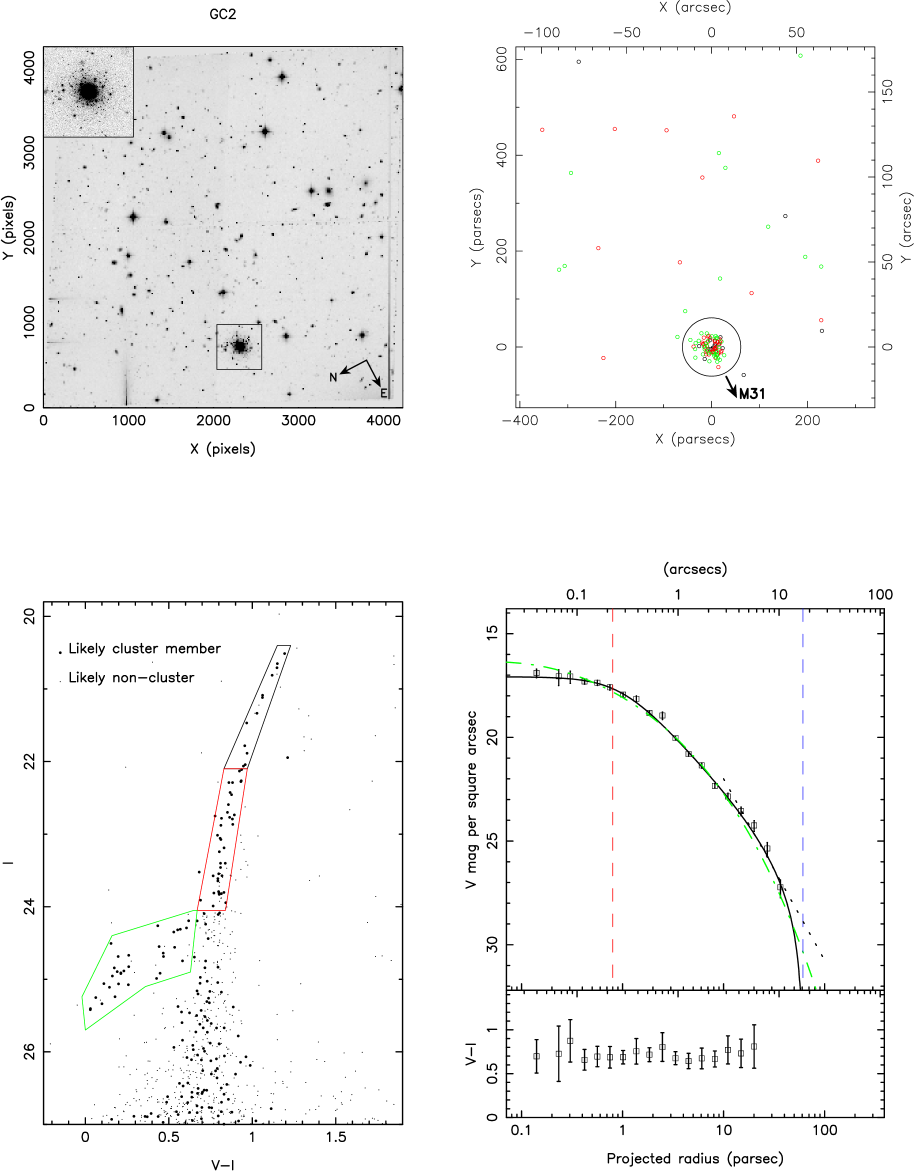
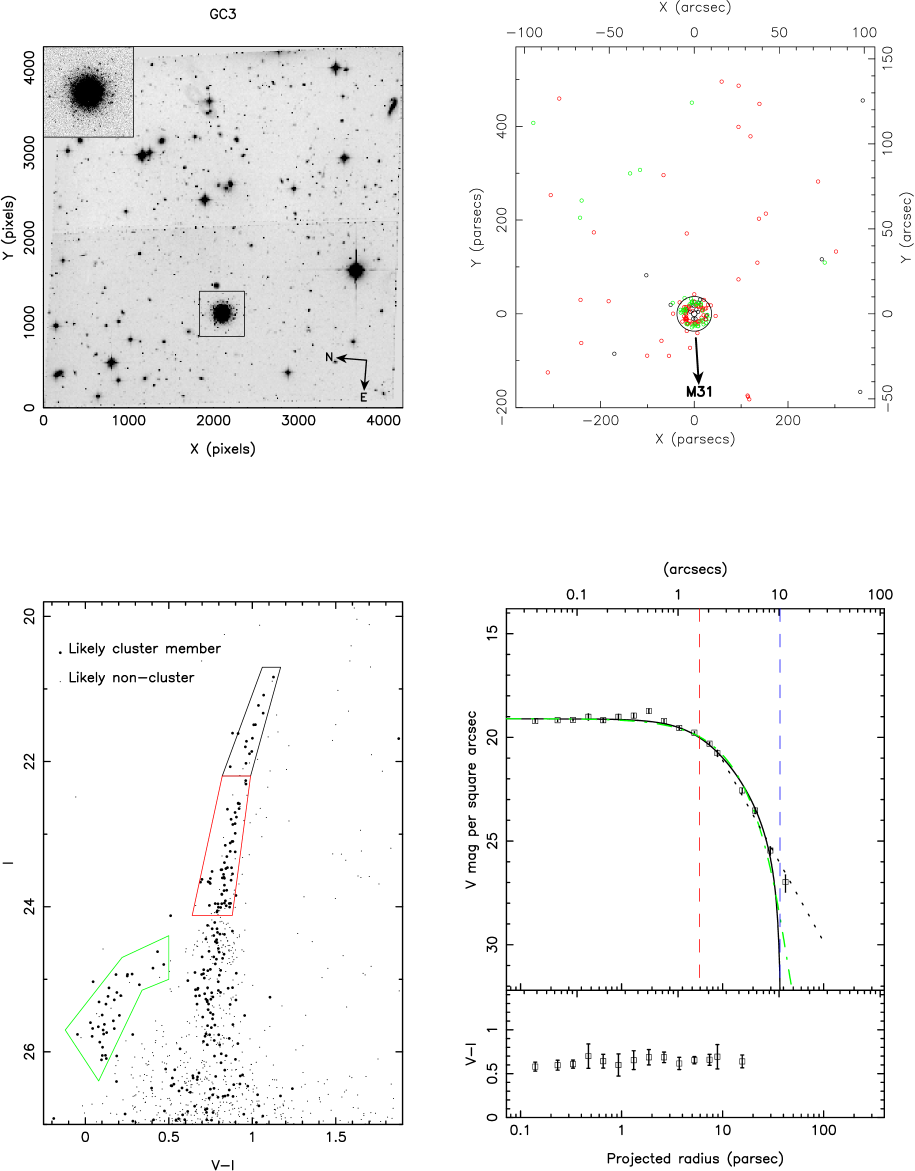
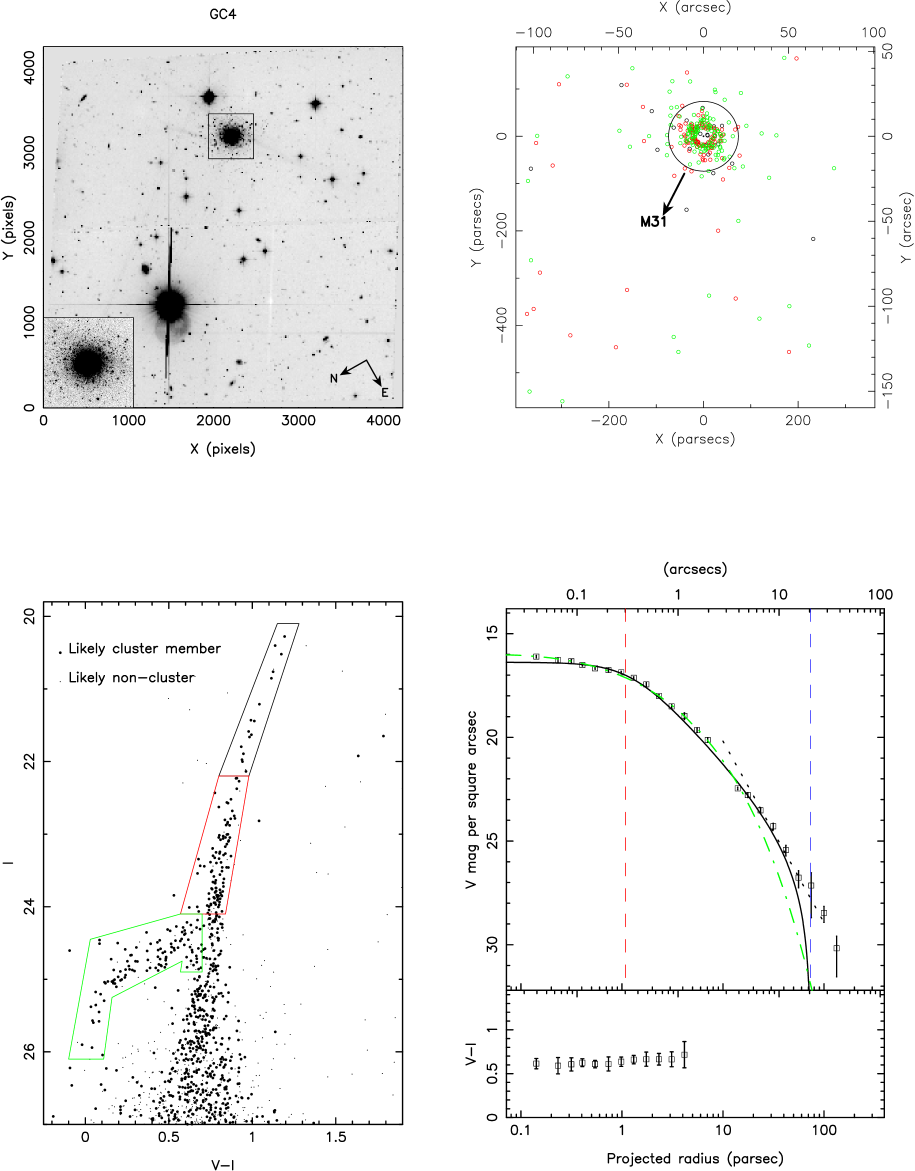
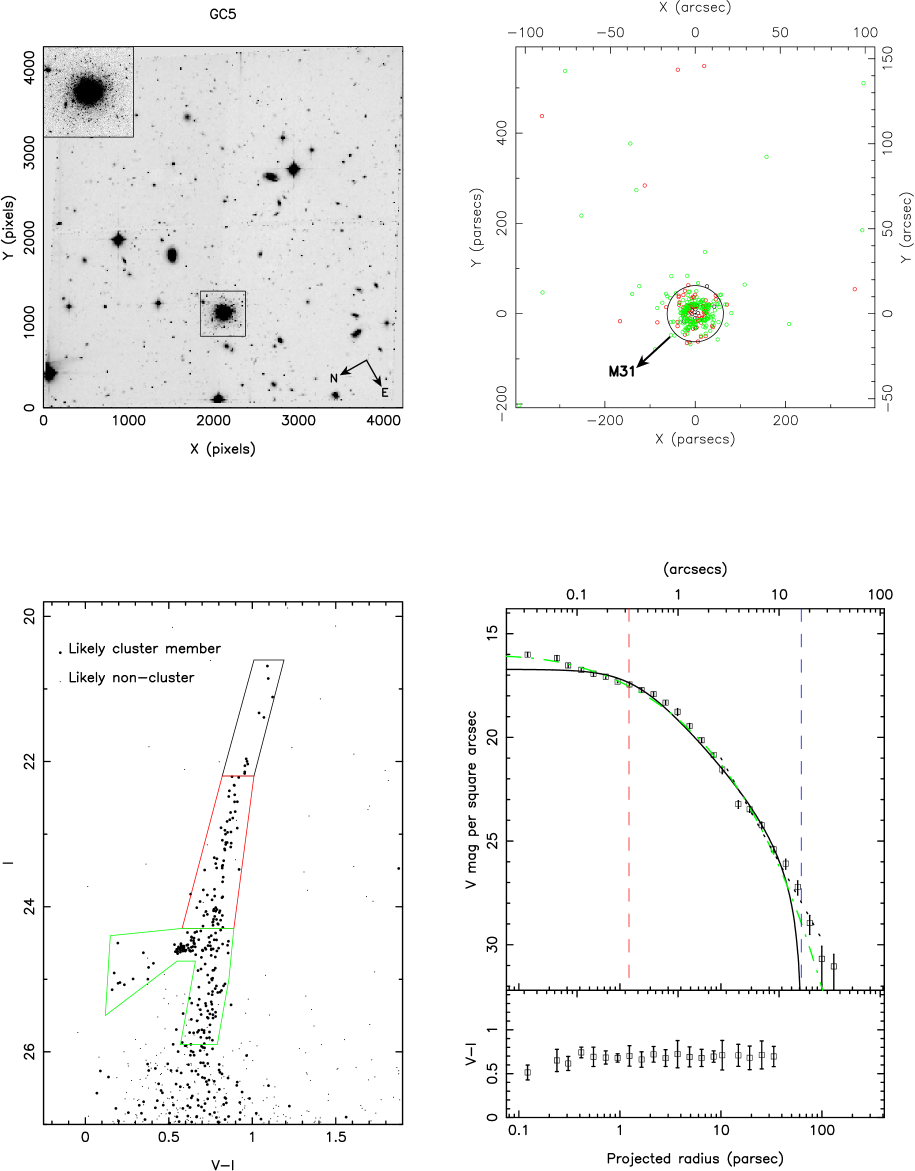
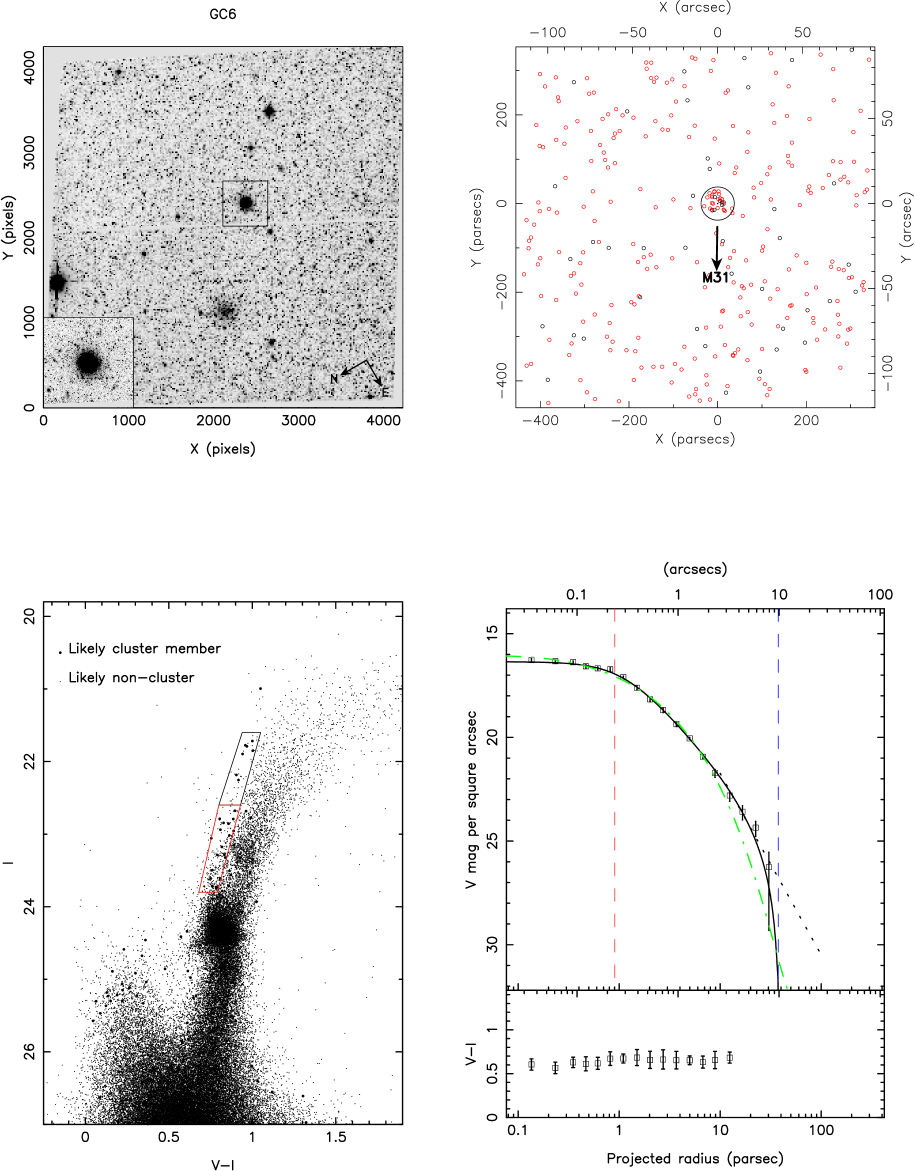
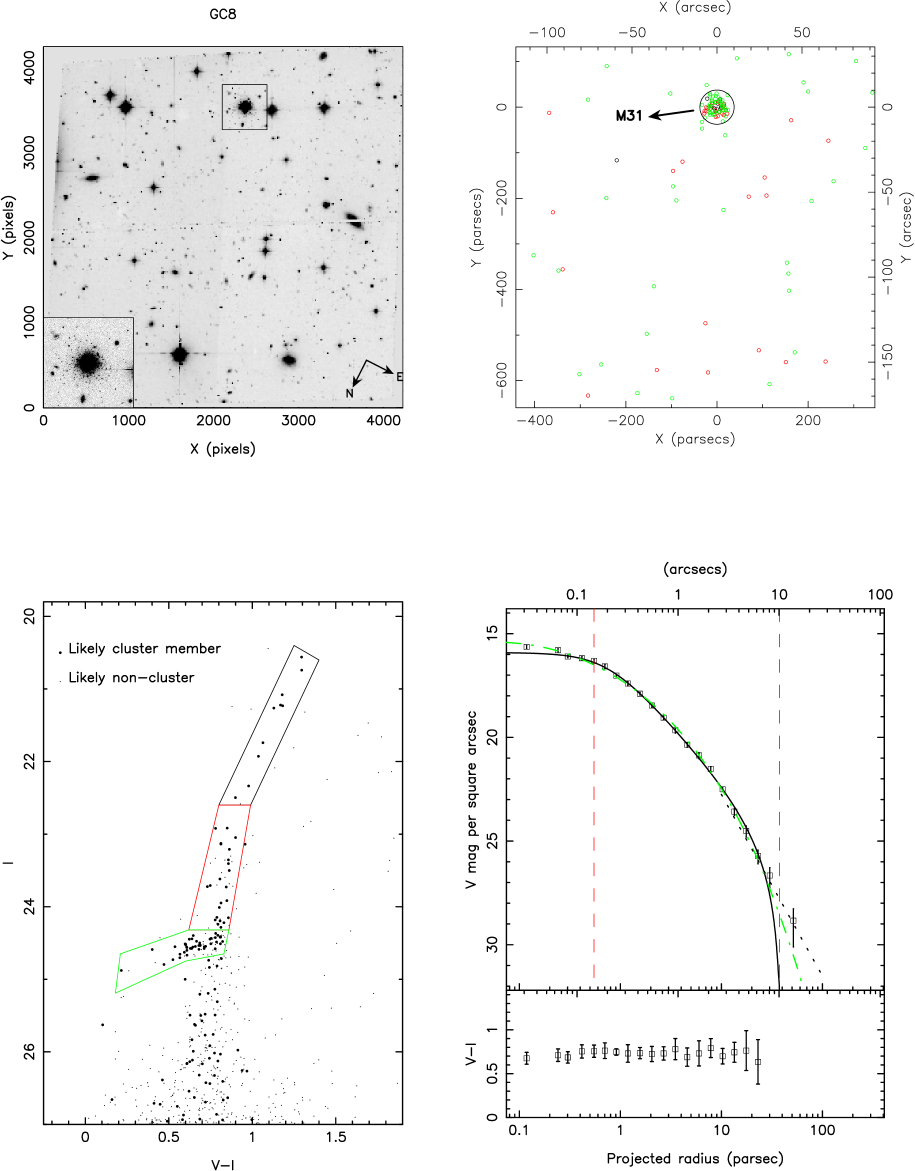
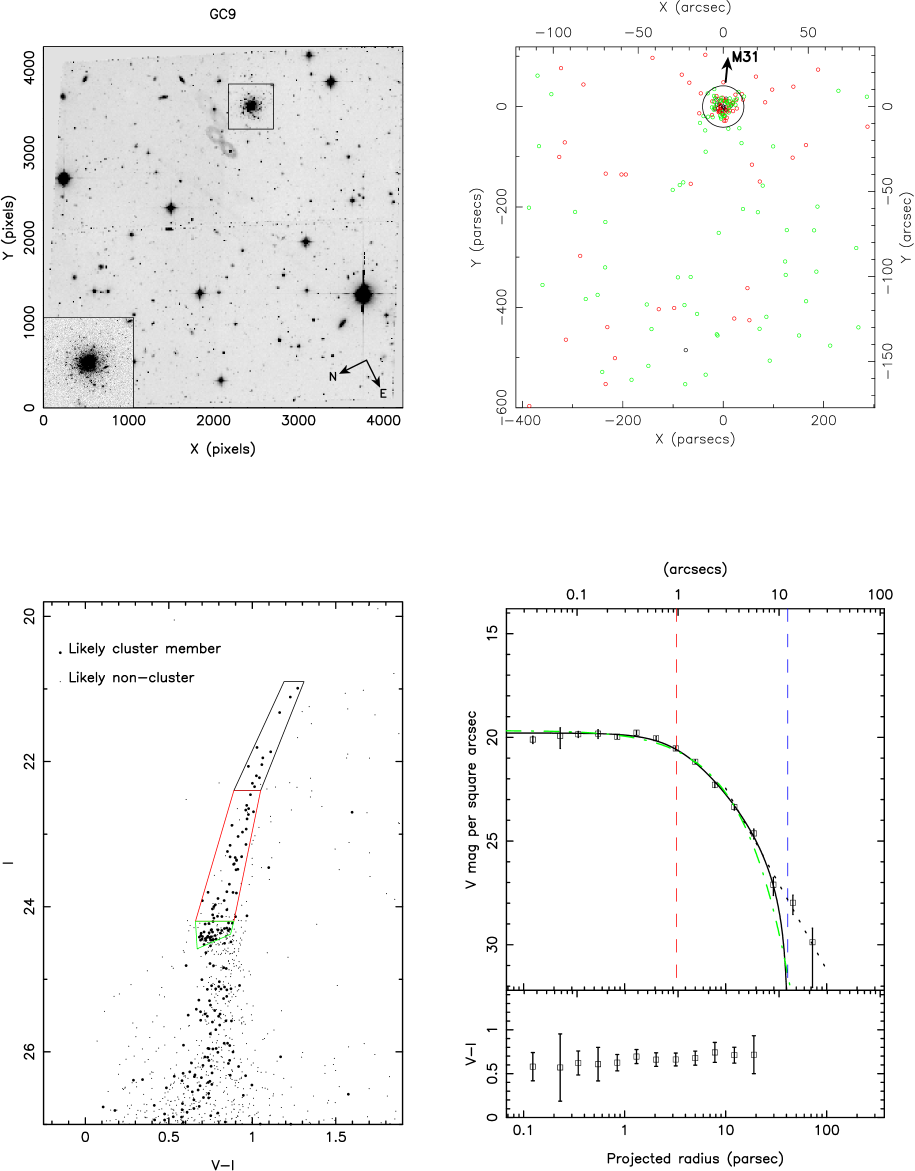
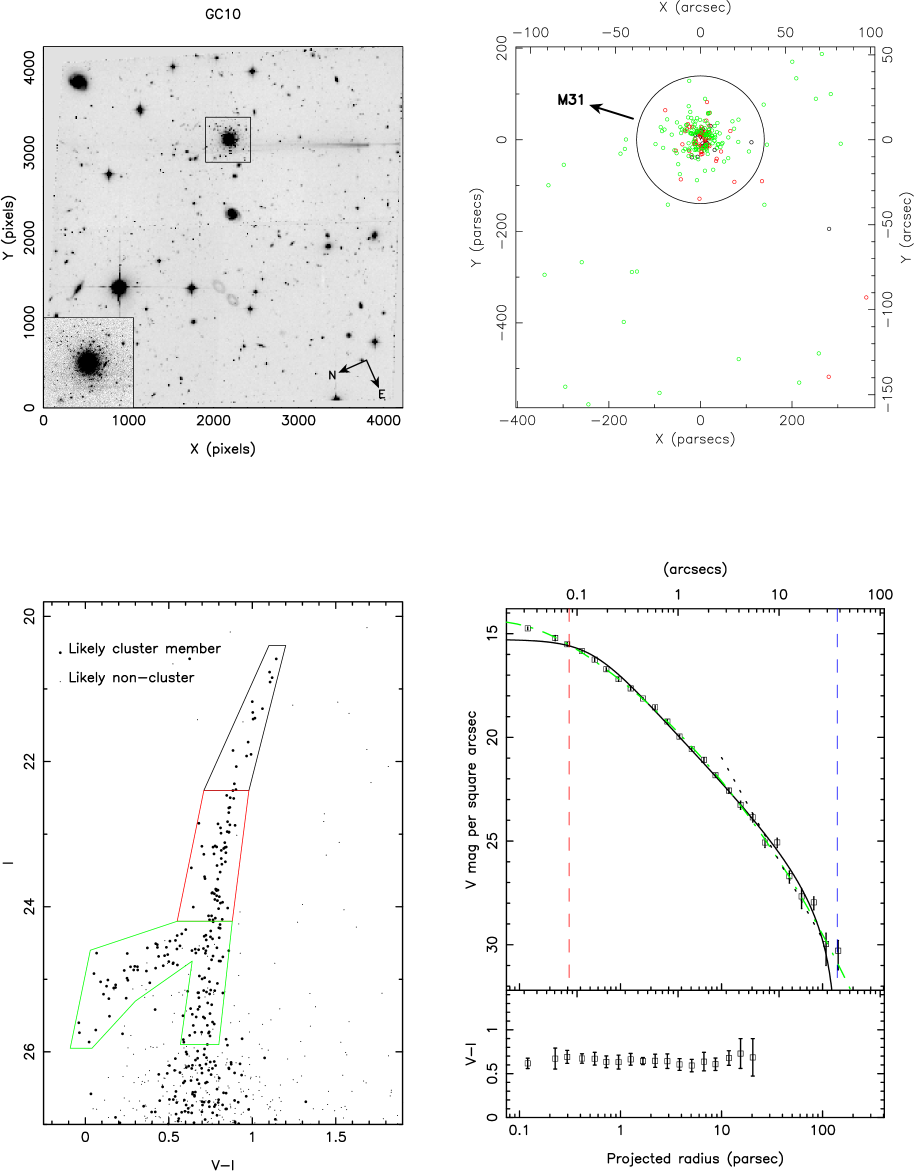
The sample of clusters is summarised in Table 1 along with these basic properties and the name given in the Revised Bologna Catalogue (RBC) of M31 globular clusters222Revised Bologna Catalogue website http://www.bo.astro.it/M31/. All observations were made with the HST/ACS(WFC) using the F606W and F814W filters. The clusters were generally located in the middle of one of the ACS CCDs to minimise the influence of the chip-gap, although in some instances additional offsets allowed us to avoid bright stars appearing in the field. The F814W filter images of all the clusters are shown in the upper-left panels of Figures 1–14. In the case of EC3 and GC6 the two clusters were both available in the same pointing, and the resulting image (see Figure 3) illustrates well the striking morphological difference between the two classes. Details of the HST/ACS imaging, the basic reduction steps and transformation to standard -band (F606W) and -band (F814W) magnitudes are given in Mackey et al. (2006, 2007), along with a description of the profile-fitting photometric analysis. We have also taken the naming scheme, dust extinction values and distances to each cluster from those papers.
| Cluster | RBC entry | ||||
|---|---|---|---|---|---|
| EC1 | MCEC1-HEC5 | 00 38 19.5 | +41 47 15 | 0.08 | 13.3 |
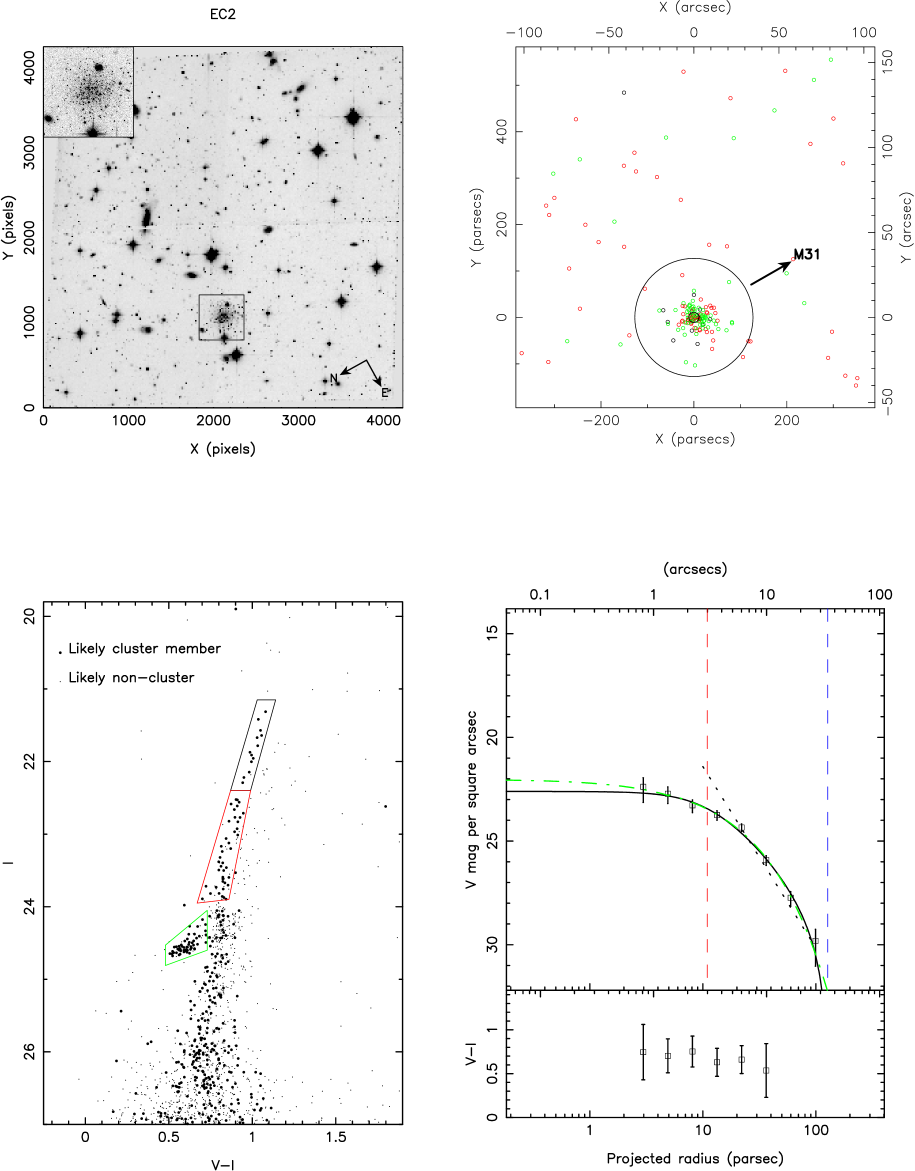
| EC2 | MCEC2-HEC7 | 00 42 55.0 | +43 57 28 | 0.10 | 36.8 |
| EC3 | MCEC3-HEC4 | 00 38 04.6 | +40 44 39 | 0.07 | 14.0 |
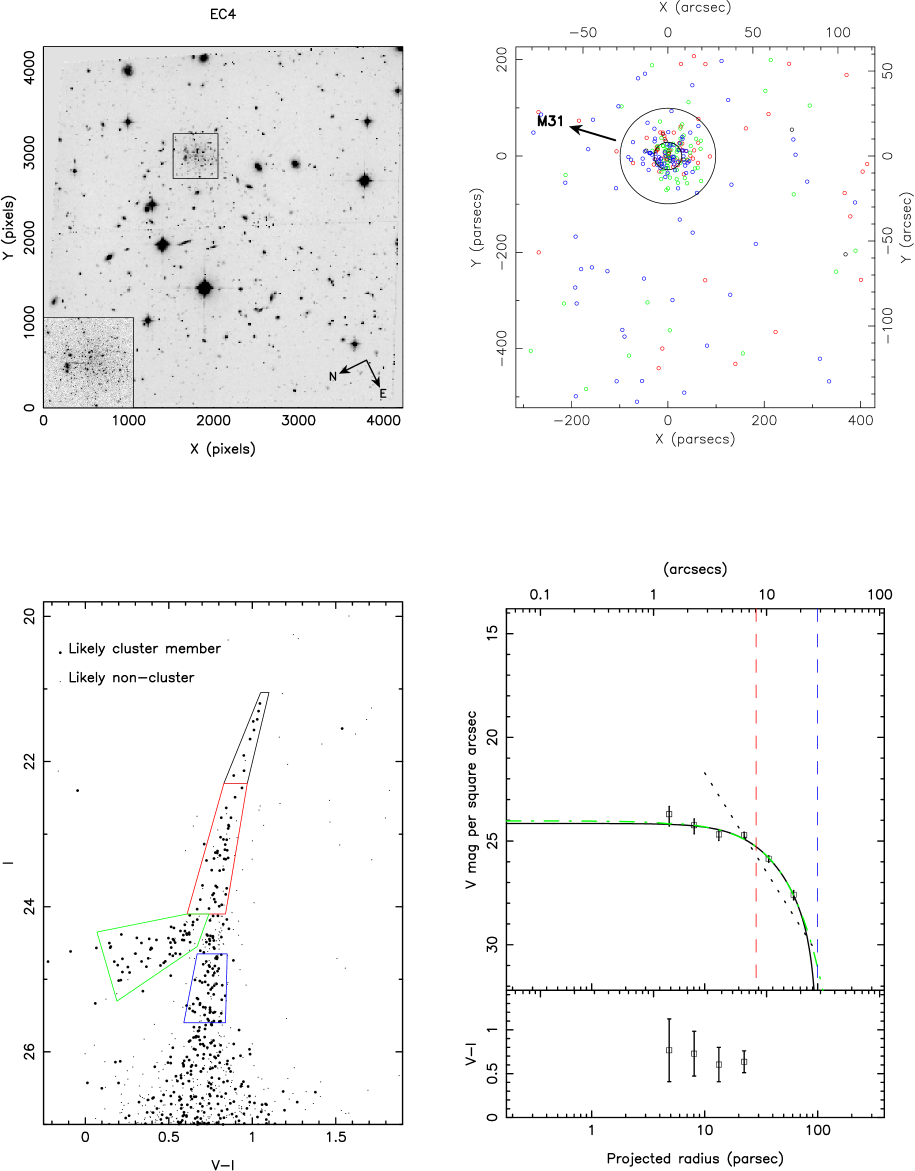
| EC4 | MCEC4-HEC12 | 00 58 15.4 | +38 03 02 | 0.08 | 60.1 |
| GC1 | MCGC1-B520 | 00 26 47.7 | +39 44 46 | 0.09 | 46.4 |
| GC2 | MCGC2-H4 | 00 29 45.0 | +41 13 09 | 0.08 | 33.5 |
| GC3 | MCGC3-H5 | 00 30 27.3 | +41 36 20 | 0.11 | 31.8 |
| GC4 | B514-MCGC4 | 00 31 09.8 | +37 54 00 | 0.09 | 55.2 |
| GC5 | MCGC5-H10 | 00 35 59.7 | +35 41 04 | 0.08 | 78.5 |
| GC6 | B298-G021 | 00 38 00.2 | +40 43 56 | 0.09 | 14.0 |
| GC7 | MCGC7-H14 | 00 38 49.4 | +42 22 47 | 0.06 | 18.2 |
| GC8 | MCGC8-H23 | 00 54 25.0 | +39 42 56 | 0.09 | 37.0 |
| GC9 | MCGC9-H24 | 00 55 44.0 | +42 46 16 | 0.15 | 38.9 |
| GC10 | MCGC10-H27 | 01 07 26.3 | +35 46 48 | 0.09 | 100.0 |
2.1 Surface Photometry
The first requirement of the analysis is to establish the best photometric centroid for each cluster. For the extended clusters and those classical GCs with low central surface-brightness, the intensity fluctuations due to individual resolved stars means this is not straight-forward. In practice, we adopted an iterative scheme, beginning with a centroid defined by the simple first moment of the light distribution and hence finding the best-fitting King function from a first pass (see below) analysis of the 1D profile. This analytic function was itself then fitted to the 2D spatial distribution of stars to obtain an improved estimate of the centroid, and hence an improved profile fit and so-on until convergence. This approach works well for all the clusters, with the possible exception of the sparsest, EC4, for which the maximum likelihood fit finds a number of plausible local maxima (within arcsec) which are not much less likely than the best solution.
Measurements of the classical clusters with the Iraf/ellipse333IRAF is distributed by the National Optical Astronomy Observatory, which is operated by the Association of Universities for Research in Astronomy (AURA) under cooperative agreement with the National Science Foundation. task finds no significant ellipticity in the inner regions, whilst the extended clusters also appear to be roughly circular, within the limits of the noise introduced in the light distribution by individual resolved stars. For each cluster we therefore summed the integrated light in circular annuli around the cluster centre, and subtracted an estimate of the background using areas of the images well beyond the apparent cluster extent (typically a distance of about 1 arcmin defined the inner radius of the background region). Only particularly bright stars and galaxies were masked from the background estimate (the same sources are also masked from the cluster apertures). It is worth noting at this point that if any of the clusters extend at low levels over a majority of the ACS fields, then it would lead us to overestimate the background level, and underestimate, for example, the photometric tidal radius.
The spacing of the boundaries between the annuli is logarithmic, although the number of annuli used for each cluster was chosen, dependent on the size and brightness of the cluster, to ensure good signal-to-noise in most bins (in particular, relatively few but large bins were considered most appropriate for the extended clusters).
2.2 Star Counts
For the classical globular clusters at larger radii, and the extended
clusters at all radii, these integrated light surface photometry
measurements become noisy due to contamination: the result of light
from faint background galaxies and stars in M31 and the MW halo (as
noted above, the brighter stars and galaxies in the images were masked
out to reduce their effect on the star counts). To extend the
measured profiles we performed star counts using the following
procedure:
Step 1: a colour-magnitude diagram (CMD, see
lower-left panels of Figures 1–14) was created for each cluster.
Bold symbols represent stars from an annulus judged by eye to be
clearly within the main body of the cluster but not too severely
crowded (typically out to about 10 to 20 arcsec, depending on the
cluster), and therefore are likely to be dominated by cluster stars.
Smaller symbols represent stars from the same region of the image that
was used to calculate the sky background,
which are very likely to be almost entirely sources unassociated with
the cluster. Stars in the outer parts of the cluster were excluded
from this plot since they could not be considered either good
candidates for membership or likely contaminants, simply on the basis
of spatial position.
For this reason the primary references for the cluster CMDs remain Mackey et al. (2006, 2007),
in which the typical photometric errors are also presented.
Step 2:
regions on the CMD were then chosen separately for each cluster (shown
as outlines in the figures) in order roughly to maximise the number of
cluster stars, whilst minimising background contamination. The more
remote clusters with very low contamination therefore benefitted from
much looser constraints in this regard. Nevertheless, it is important
to note that effective background contamination varies considerably
from cluster to cluster, not only because the clusters nearer to M31
have a higher density of M31 halo and disk stars in the field, but
also because in some cases, driven by metallicity differences, the
loci of the cluster red giant branch (RGB) and horizontal branch (HB)
were less distinct from those of the M31 halo than in other cases.
Clusters EC3 and GC6, which are both located in the same ACS field,
suffered most from a high density of contaminating field stars.
Step 3: stars from within these CMD regions were the
only ones, henceforth, considered in the star count analysis. Their
numbers were summed in the same annuli as were used for the surface
photometry. Residual contamination within these annuli, by
point-sources unrelated to the cluster, was removed
statistically by subtracting an appropriately scaled background count
determined, again, over the area of the chip far from the cluster.
The spatial distribution of stars within the selected regions of each CMD is shown in the upper-right panel of Figures 1–14. The different regions of the CMD used to measure the star counts are colour-coded to highlight different stellar populations (usually, horizontal branch, and upper and lower red giant branch). Given that the range of stellar mass from the RGB to the HB is not large, we do not expect any significant difference in these distributions, except that which results from incompleteness due to crowding setting in at larger radii for the fainter stars. In these panels we also plot for reference the direction of M31 and the King-profile core and photometric tidal radii (see below) of each cluster. Note the linear scale in parsec is appropriate to the measured distance of each cluster (Mackey et al., 2006, 2007).
2.3 Cluster Profiles
To construct the final, circularly-averaged intensity profiles, the star count density was scaled to the -band surface photometry in an annular region, the inner and outer radii of which were selected by eye for each cluster to define a zone in which the surface photometry should still be reliable, but the star counts not significantly affected by incompleteness. For the classical globulars, this was typically a region from a few arcsec to about 15 arcsec from the cluster centre. In effect, this means that core radii are determined largely from the integrated light measurements and photometric tidal radii largely from the star counts. In the case of extended clusters the profiles reported are those solely based on the star counts, although again these are normalised to the measured surface photometry in an aperture roughly corresponding to the core region.
The resulting radial profiles (extinction-corrected) are shown in lower-right panels of Figures 1–14. The error bars for the star counts were determined from Poisson statistics (including the error introduced by the background subtraction step), whereas those for the surface photometry were obtained by dividing each annulus into eight segments and determining the variance of surface brightness between these. This latter approach should account for the extra noise, over and above photon shot noise plus detector noise etc., which is due to the graininess introduced by resolved stars; although for very small radii the segments are typically so small that the variance is likely to be underestimated. In the overlap region, in which the plotted points are a weighted average of the surface photometry and (scaled) star counts, the error is taken as an average of the error on each (this was chosen since the uncertainties should be well correlated).
Due to the magnitude limit of the observations, the star counts only sample the most luminous stars in the clusters. The integrated light analysis is also dominated by the light from the brightest, most massive stars, and particularly in the intermediate radii where we normalise the star counts to the surface photometry, it is reasonable to assume dynamical mass segregation does not affect the results. At small radii, particularly in any post core-collapse clusters, sinking of more massive stars (including stellar remnants) to the cores will modify both the luminosity function and mass-to-light ratio. The radial dependence of colour, determined from surface photometry in annuli around each cluster (see bottom plots in lower right panels of Figures 1–14), confirms there is no evidence of any significant trend on the scales we probe.
3 Results
We fitted the radial profile of each cluster with an empirical King (1962) model of the form:
| (1) |
where is the surface brightness at projected radius , is a normalising factor (which is approximately the central surface brightness when ), the core radius (again, approximately the half-width at half-maximum in the same limit), and is the photometric tidal cut-off radius. It is worth emphasising that does not necessarily correspond closely to the current physical (dynamical) tidal radius, even when a King model provides a good fit to the light profile, since, for example, it could reflect past tidal curtailment when the cluster’s orbit passed closer to the galaxy, or be influenced by stars in the process of escaping the cluster.
The best fit was determined using a Markov-Chain Monte-Carlo algorithm to find the maximum likelihood model parameters, taking the estimated photometric flux errors to be Gaussian distributed. These fits are the solid curves shown in the lower-right panels of Figures 1 – 14. In addition, the data were similarly fitted with Sérsic (1968) profiles:
| (2) |
where is a scale radius and is the shape index. The Sérsic profile (dashed curves shown in the same panels) has no tidal cut-off, but better describes steeper, more cuspy central light distributions seen in some clusters.
Note that the models were convolved with HST/ACS point spread function (PSF) – the functional form of the PSF being taken from Barmby et al. (2007, see their Equation 4 and Table 3). Although the difference is only small, it provides a more correct comparison with the data in the cluster cores. Of course, the pixel binning contributes further to the smoothing of light in the very central regions, and imposes another limit to the information we can expect to find, particularly for clusters with central cusps.
For the extended clusters, the low density of stars precludes reliable measures of star counts or surface brightness in the central couple of arcseconds since the annular bins there are such that a single resolved star (or the absence of one) makes a significant difference to the measured flux. For the same reason, estimating flux uncertainties for small regions in the extended clusters is less reliable. Thus, although both the King and Sérsic profile fits are good, we cannot make firm statements about how flat the central light distribution is in each such object.
We also calculated model-independent (hereafter referred to as “empirical”) estimates of half-light radius and absolute magnitude. For the extended clusters this was calculated directly by summing the star counts and scaling these to the surface photometry in the central regions. For the classical globulars we combined surface photometry in the inner regions and (scaled) star counts in the outer regions, to give an effective brightness distribution, which was again summed to determine these parameters.
Numerical results of our analysis, including confidence intervals for the fitted parameters, are summarised in Table 2. The galactocentric radii are projected on the sky from the galaxy centre, and we take the distance to M31 to be 785 kpc (McConnachie et al., 2005). The empirical absolute magnitudes and half light radii presented here can be considered to be more precise than the ground-based estimates in Huxor et al. (2005), and the preliminary estimates using the same data tabulated in Mackey et al. (2006, 2007). The agreement is generally good, with a slight systematic tendency to brighter magnitudes and smaller radii here. We note that EC3 is a particularly difficult case due to the high background of contaminating field stars, and formally the core radius is found to be only a factor of smaller than the tidal radius, although there may be a slight excess of stars beyond the tidal radius.
GC4 was observed independently by Federici et al. (2007), also with HST/ACS. Their derived parameters from a King model fit, , pc and pc, are in good agreement with those found in our analysis.
| Cluster | Empirical | King | Sérsic | ||||||||||
|---|---|---|---|---|---|---|---|---|---|---|---|---|---|
| logpc) | n | (kpc) | |||||||||||
| (pc) | (pc) | (pc) | (pc) | (pc) | |||||||||
| EC1 | -7.68 | 33.2 | 24.2 | 24.4 | 20.3 | ||||||||
| EC2 | -7.03 | 24.9 | 20.1 | 19.9 | 25.7 | ||||||||
| EC3 | -7.45 | 24.6 | 18.3 | 18.1 | 7.2 | ||||||||
| EC4 | -6.68 | 33.2 | 27.7 | 28.1 | 25.8 | ||||||||
| GC1 | -8.91 | 3.5 | 2.8 | 3.0 | 7.1 | ||||||||
| GC2 | -7.83 | 4.0 | 3.6 | 3.5 | 8.2 | ||||||||
| GC3 | -8.68 | 9.1 | 7.9 | 8.0 | 3.0 | ||||||||
| GC4 | -8.74 | 3.5 | 4.6 | 4.3 | 8.0 | ||||||||
| GC5 | -8.90 | 5.1 | 4.5 | 4.9 | 6.0 | ||||||||
| GC6 | -8.50 | 3.6 | 3.0 | 2.7 | 3.2 | ||||||||
| GC7 | -6.25 | 5.4 | 4.7 | 5.0 | 6.2 | ||||||||
| GC8 | -8.21 | 2.8 | 2.3 | 2.5 | 4.0 | ||||||||
| GC9 | -7.25 | 7.5 | 6.2 | 6.0 | 6.1 | ||||||||
| GC10 | -8.49 | 4.0 | 3.2 | 3.3 | 20.5 | ||||||||
4 Discussion
In the left panels of Figures 15–17 we show the distribution of King model core, half-light and tidal radii against projected galactocentric radius for our sample, compared to the compilations of M31 clusters studied by Barmby et al. (2007)444We only show those clusters from the Barmby et al. (2007) sample that are listed as confirmed clusters in the Revised Bologna Catalogue V4 (Galleti et al., 2004). and Strader, Caldwell, & Seth (2011). The right panels show the equivalent data for the Milky Way from McLaughlin & van der Marel (2005) (note, in this case the 3D galactocentric radius is scaled by /4 to make it comparable, in the mean, to the projected radius used for M31). The M31 sample also includes MGC1, the most remote globular cluster currently known in M31, which has well-determined structural parameters from high resolution ground-based imagery (Mackey et al., 2010b). Examining these size estimates in tandem is relevant since half-light radius is expected to be relatively insensitive to dynamical evolution, varying little even through core-collapse (e.g., Gnedin, Lee, & Ostriker, 1999).
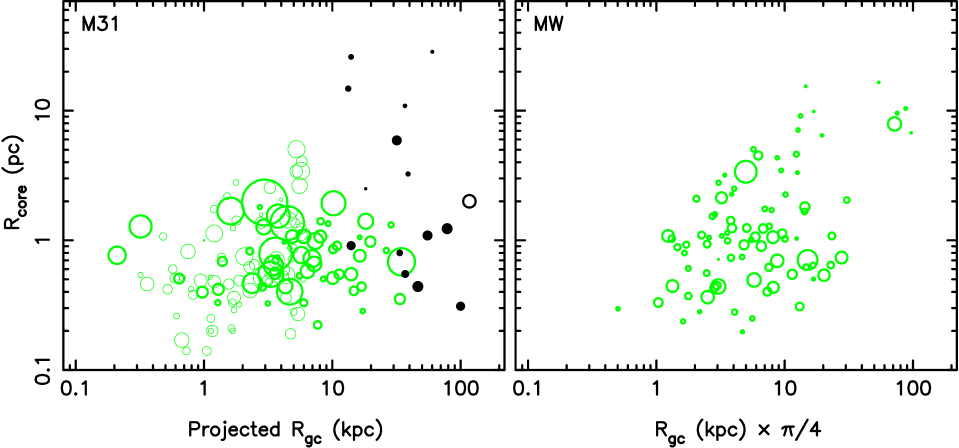
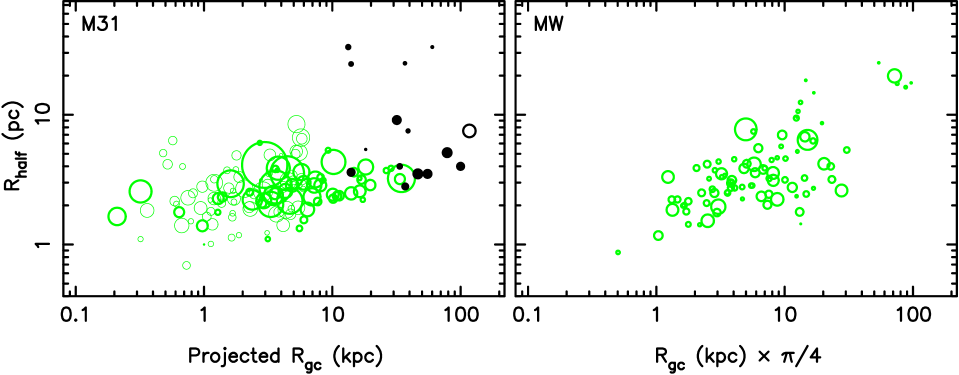
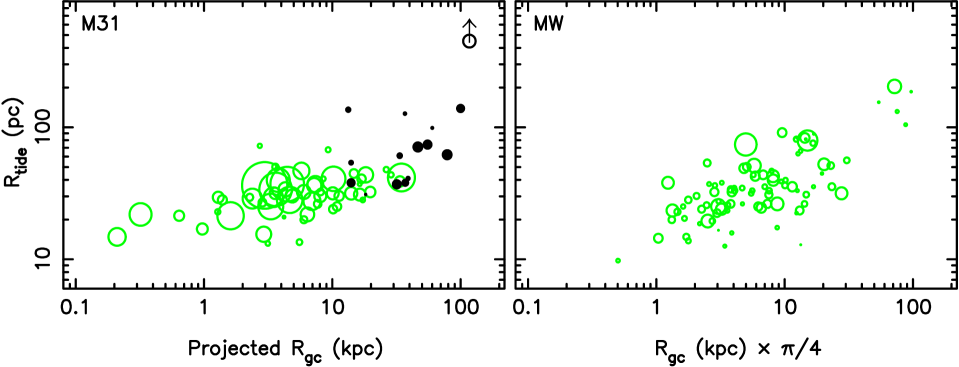
These samples are not complete, but are sufficiently large to be broadly representative of the range of cluster properties in each galaxy. The extended clusters occupy a unique region of parameter space, particularly noticeable in Figure 16 where they are quite distinct from the rest of the M31 GC population. Several of the Pal-type clusters in the Milky Way are also comparatively diffuse, but are considerably fainter than the M31 extended clusters in our sample. However it is possible that there is a continuum of sizes in the extended cluster population, with those objects in the present sample representing the extreme upper end of the distribution (Huxor et al., 2011). Even ignoring the extended clusters, a trend for increasing half-light radius with galactocentric radius is apparent in Figure 16 in both systems, although it is also clear that in M31, unlike the Milky Way, at least some clusters beyond kpc are just as compact and luminous as the inner population. The presence of such remote compact luminous clusters in M31 has previously been commented on by Mackey et al. (2007) and Huxor et al. (2011) and is confirmed here with our more accurate structural and photometric measurements.
4.1 Inner structure of the classical globular clusters
Four of the classical clusters (GC3, GC6, GC7 and GC9) have convincingly flat light distributions in their cores. This is consistent with, the 50% proportion of flat-cored clusters found in the Milky Way (Noyola & Gebhardt, 2006) and the 60% proportion in the clusters of MW satellites (Noyola & Gebhardt, 2007). Of the others, some show evidence of a shallow central power-law slope (GC2, GC4, GC8), some a steep central power-law slope (GC1, GC5, GC10). As one would expect, all these cases are better fit by a Sérsic profile in their inner regions. Some caution is appropriate since, as mentioned above, the photometric error bars in the central arcsec will certainly not account adequately for the graininess due to individual bright stars, but in at least the cases of GC1 and GC10 the central surface brightness is so high that this should be of little concern.
Cuspy cores are usually thought to be the result of post core-collapse (PCC) evolution. Trager, King, & Djorgovski (1995) estimate that 20% of MW globulars fall into this category, although criteria for deciding in individual cases are not well established. Indeed, recent numerical simulations have shown that PCC clusters may often be very difficult to distinguish from pre-core-collapse based on their light profiles since segregation of dark remnants in the core leads to a heating and hence spreading of the visible component (Trenti et al., 2010). A consequence of this is that many more clusters than previously recognised may be post core-collapse.
Interestingly, our results suggest that the spread in the distribution of central surface brightness slopes increases with increasing radial distance from M31. Three of the four GCs at greatest projected distance from M31 have particularly steep power-law light profiles in their inner regions. Indeed, the most remote (at least in projection), GC10, has a profile that is almost a pure power-law over most of the range we probe. These particularly cuspy clusters contrast markedly with the flat cored extended clusters (below) which are also found at large galactocentric distance. We further note that within the Milky Way, the proportion of PCC and other centrally condensed clusters seems to increase significantly toward the centre of the Galaxy (Chernoff et al., 1989), possibly due to an increased incidence of tidal shocking (cf. Gnedin, Lee, & Ostriker, 1999). If the steeper profiled outer clusters in M31 have a similar origin, it would presumably indicate that they had been stripped from now destroyed satellites where they had orbited closer to the parent galaxy core. However, a comparison of the positions of the most steeply cusped clusters with the regions of known halo substructure from Mackey et al. (2010a) does not show any significant correlation, and hence does not provide support for such a conclusion.
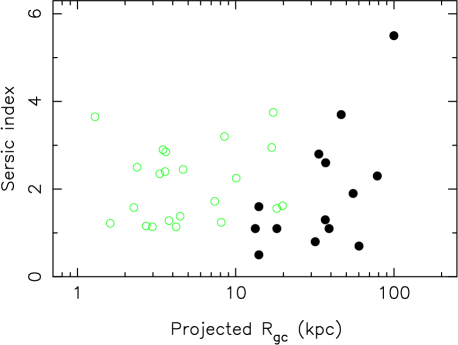
We should be cautious in comparing these results to those for the larger sample of inner M31 GCs compiled by Barmby et al. (2007) since they are mostly observed with WFPC2 where the larger pixels make it harder to quantify inner structure. However, if we take the Sérsic index as one measure of degree of cuspiness, a plot of this against galactocentric radius (Figure 18, which also includes the extended clusters) indeed shows a greater spread for the outer clusters (although note only a fraction of the Barmby et al. (2007) sample have Sérsic fits).
4.2 Structure of the extended clusters
Although the most remote globular clusters in the Milky Way tend to be faint and diffuse, the discovery of a population of clusters in the outer parts of M31 that are both brighter and even more extended than these, was a surprise. There is, of course, a selection effect against discovering such clusters at small galactocentric radii, since they would become increasingly hard to distinguish against a rising background of crowded field stars. There is also likely to be a physical selection effect, in the sense that extended clusters at smaller galactocentric distance would be vulnerable to complete tidal disruption (e.g., Hurley & Mackey, 2010), unless they were embedded in massive dark matter halos, which does not appear to be the case for EC4 at least (Collins et al., 2009).
The (circularly averaged) profiles of the four extended clusters studied here are all rather similar to each other in terms of implied central surface brightness, core radius and tidal radius. Although the diffuse nature of these clusters should lead to two-body relaxation times which are of order the Hubble time or longer, we find they are all well fitted by both King models with large cores and Sérsic models with low indices . EC3 formally has the smallest tidal radius, although it is in the most crowded field (in projection it is close to the outer part of M31’s disk), and there is evidence of a lower level excess of cluster stars beyond the measured tidal radius. The 2D distribution of stars is statistically consistent with circular symmetry.
We emphasise that although faint, such central surface brightnesses are considerably in excess of those of several recently discovered dwarf galaxies. The Ursa Major dSph, for example, has a magnitude similar to the extended clusters studied here, but a half-light radius ten times larger (Willman et al., 2005), whilst other likely dwarf galaxies are even fainter with significantly lower central surface brightnesses (e.g., McConnachie et al., 2008; Martin, de Jong, & Rix, 2008). Thus a population of similar extended clusters in the Milky Way could only have eluded detection if they were few in number and particularly unfortunately placed for observation from our location within the Galaxy.
4.3 Possible asymmetries in EC2 and EC4
From visual inspection, two of the extended clusters, EC2 and EC4, do show some indications of deviation from circular symmetry (or even point symmetry) in the distribution of their stars on the sky (see upper right panels of Figures 2 and 4). Explaining such deviations by dynamical processes would be hard, given the age and isolated nature of the clusters, and so we first ask whether the apparent asymmetries could be simply due to statistical chance.
There are a number of difficulties in assessing the significance of the findings of this sort. In the first place the determination of the cluster centroid is affected by counting statistics so it is possible that the measured centroid is a little out, although, as noted above, even for the very sparse EC4, this uncertainty is unlikely to be more than arcsec. Secondly, the regions of the image which are masked out around bright stars and galaxies are not symmetrical around the cluster centre, and their effect depends on the cluster profile. Finally, and hardest to deal with, is the à posteriori nature of the analysis. To mitigate this, we try to ask a fairly general question of the data, namely, if we consider just stars between the half-light radius and the tidal radius, what is the maximum ratio of stars in one half of the spatial distribution relative to the other half, allowing the axis splitting the the sample across a diameter freedom to be at any angle? This we compare to the same statistic determined for each of 10000 simulated clusters, which are constructed based on the King profile parameters, background star density and image mask appropriate to the real cluster in question
In the case of EC2 there is an excess of stars outside the half-light radius which lie in the positive -direction from the cluster centre. Although to the eye this may appear significant, % of our simulated clusters showed a similar or greater degree of asymmetry. In a sample of four extended clusters it is therefore no surprise to find one like EC2, even if their underlying structure is circularly symmetric.
The situation with EC4 is potentially even more perplexing, in as much as it appears to be particularly the horizontal branch stars (and possibly the red-giant branch stars) outside the half-light radius which are systematically shifted to higher -values from the overall centroid. Once again, the same caveats apply, although in this case it is even harder to imagine a dynamical explanation for such an offset. We do note, however, that the EC4 horizontal branch is unusual in another way in being particularly broad. This range of magnitudes cannot be explained by photometric errors (being the least crowded and one of the most remote of the clusters, the photometry is good at these magnitudes), and a line-of-sight depth sufficient to produce such a spread is highly improbable. Most likely the photometric spread of the HB stars is produced by some combination of the inclusion of several RR Lyrae variables which happen to be caught close to their maxima, and possibly a small number of contaminating sources. To test the significance of such an asymmetry we restrict our attention to just the 35 horizontal branch stars. Here we find a smaller number, 0.2%, of simulated clusters exhibit an asymmetry of the same magnitude as the real cluster. However, again, we must recognise that we have looked at four extended clusters, and in each case have split the stars into three or four sub-populations in the CMD, therefore to find one which shows this level of asymmetry is not too surprising.
Our conclusion is that the extended clusters are consistent with being circularly symmetric, and that the marginal evidence for an asymmetry of the horizontal branch stars with respect to the rest of the cluster in EC4 is not sufficiently strong with the current data to be regarded as a firm conclusion.
4.4 Outer structure
4.4.1 Tidal radii
The photometric tidal radii determined from the King profiles generally represent the point where the surface brightness finally turns over. We note that simulations suggest that it is likely the photometric tidal radius will frequently somewhat overestimate the true dynamical tidal radius due to the slow evaporation of stars across the boundary (Trenti et al., 2010). On the other hand, a cluster on an orbit which ranges significantly in galactocentric distance will experience a time-varying tidal field, and so its present photometric limit might reflect the tidal truncation from an earlier time; this effect is considered in more detail below. Figure 17 shows that tidal radii also generally have larger values at larger galactocentric radius. Despite the above caveats, such a trend is broadly as expected since the outer clusters sample the shallower potential gradient at larger distances from M31.
GC10 presents a particularly interesting case: it is the most remote cluster in our sample (in projection) and as remarked previously has a profile which is almost a pure power-law. The tidal radius we formally derive is pc, which is the largest of any cluster in our sample, and since the tidal truncation knee is very poorly defined, the photometric tidal radius could easily be even larger. The outer profile of GC10 is similar to that found using ground-based data for the cluster MGC1 which is kpc in projection, and likely at a true distance of kpc, from M31. In that case the cluster is traced out to at least 450 pc and possibly further (Mackey et al., 2010b).
The tidal radius of a globular cluster depends on the potential of the host galaxy, the potential of the cluster, its orbit around the parent galaxy, and the orbits of the stars within it (e.g., Read et al., 2006). Here, we parameterise the M31 potential using the model in Geehan et al. (2006), and the GC potential using a Plummer sphere with half light radius matched to the GC photometry. We calculate the GC masses from their -band luminosity, assuming a mass to light ratio of 2 (cf. Pryor & Meylan, 1993). We then solve equation 11 of Read et al. (2006) for the pericentre . There are three other unknowns in this equation: the apocentre, , the 3D distance to the GC, , and the tidal radius555We set the internal orbit parameter (i.e. radial) since we do not expect significant rotation in the GCs (e.g., Kim et al., 2008), and there is no obvious onset of tidal tails that might justify using (i.e. retrograde; see Read et al., 2006; Adén et al., 2009)., . Since we do not know these three parameters, we can only calculate a lower bound on . For this, we set to its minimum allowed value: the King tidal radius, assumed to be determined at pericentre, which fixes . This leaves only as an unknown. Here we use the fact that the GCs are most likely to be at apocentre, since this is where they spend most of their time on their orbit. We marginalise over the unknown exploring the range , where is the projected distance of the GC from the centre of M31.
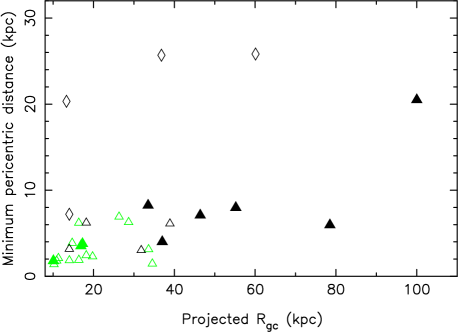
Minimum pericentric radii calculated this way are given in Table 2, and plotted against present galactocentric distance in Figure 19. Here we also include clusters from Barmby et al. (2007) with projected galactocentric distance greater than 10 kpc (below this there is increasing likelihood that the cluster is a member of the disk population or has been subject to frequent disk shocking). The extended clusters, as expected if they are to avoid disruption, generally appear to be on low-eccentricity orbits, with pericentric distances greater than 20 kpc in three out of four cases.
There is no apparent trend for the most cuspy clusters to have smaller pericentric radii, which might have been expected if their structure was due to strong dynamical interactions when at pericentre driving them to core-collapse. Gnedin & Prieto (2008) find from simulations that in MW-like galaxies all GCs beyond 10 kpc began life in smaller galaxies, and, in particular, beyond 50 kpc they are preferentially on radial orbits, and certainly the outer classical clusters, apart from GC10, apparently have much more radial orbits than do the extended clusters if we are to believe the above analysis. In fact, the Gnedin & Prieto (2008) results also suggest that between 10 and 60 kpc (inner halo) the clusters are primarily from disrupted satellites, and beyond 60 kpc they are either still associated with parent dwarfs or they have been removed via dwarf-dwarf encounters. The GCs in our study do not seem to be orbiting with known dwarf galaxies, although some may be associated with the considerable substructure which has been revealed by recent M31 surveys (e.g., Chapman et al., 2008; Mackey et al., 2010a).
4.4.2 Tidal evaporation
We can use the spatial distribution of likely cluster stars to search for possible tidal distortion and extra-tidal stars indicating significant ongoing evaporation. The distributions are shown in the upper-right panels of Figures 1–14. In several instances there is a suggestion of such distortion. Perhaps the best case is that of GC4, which has an excess of stars beyond the photometric tidal radius out to about 300 pc, particularly in the east-west direction. This cluster has also been studied by Federici et al. (2007), who came to a very similar conclusion. It is not obvious why GC4 should exhibit a significant extratidal component, given that it is very remote from M31 (50 kpc in projection) along the major axis.
The other good case is GC5, at an even greater distance from M31, which exhibits a similar, albeit less pronounced, excess. An apparently significant excess of extra-tidal stars is also seen in EC3. However, since the background to this field is a relatively crowded region of the outer disk of M31, it seems more likely that the excess is due to a gradient in the density of contaminating stars. Several other clusters, e.g. GC8 and GC9, show marginal evidence for a small excess beyond the formal King-model tidal radius.
On the other hand McLaughlin & van der Marel (2005); McLaughlin et al. (2008) have shown that many globular clusters are better modelled by Wilson (1975) profiles, which have greater extension in the outer parts than King (1962) or King (1966) models. Whilst the theoretical basis of Wilson models is somewhat ad-hoc, it may indicate that clusters such as GC4 and GC5 are not overflowing their tidal radii. However, for GC4, in particular, the roughly elliptical distribution of the stars beyond the King tidal radius does remain suggestive of a tidal process.
4.4.3 Are any clusters embedded in dark matter halos?
Although measurements of mass-to-light ratios in GCs generally do not find evidence of their being embedded in extended dark matter halos, it has been suggested that clusters may have formed that way (Peebles, 1984) but with the dark halos being largely tidally stripped during their subsequent journeys through the parent galaxy potential.
Conroy, Loeb, & Spergel (2011) have recently argued that for GCs at large galactocentric distance, which may therefore have suffered little tidal stripping in their lifetimes, the existence of an extended dark matter halo should manifest itself in a shallow gradient of outer stellar density. They specifically considered MGC1, at a distance of kpc from M31 (Mackey et al., 2010b), and showed that the slope of projected stellar surface density declines more steeply than for radii larger than pc. This compares to an expected slope at least as shallow as for high models in the same regime of radius, and so they conclude this cluster is not dark matter dominated. Although our clusters appear not to be at such great galactocentric radius as MGC1, we note that the GCs at largest projected distance (GCs 1, 4, 5 and 10) all have outer slopes at least as steep as , and so we similarly conclude that they show no evidence of residing in their own dark matter halos.
5 Conclusions
We must be aware that neither our sample, nor the sample of M31 GCs studied by other groups, are well defined in any statistical sense. Generally they are biased to brighter magnitudes, for example. Nonetheless, although selection criteria are not homogeneous, the total sample is probably reasonably representative of at least the brighter population of normal GCs. In addition to that, a number of exceptional clusters, such as the extended clusters reported here, allow us to study properties of relatively extreme objects from the overall population.
The findings of our study are:
-
•
The extended clusters are well fit by both King and Sérsic profiles with large core radii, around 10–30 pc, confirming they are very distinct from the bulk of classical GCs. Three of the four have large King-model tidal radii of about 100 pc, which is consistent with their being on relatively circular orbits where they experience relatively little tidal stress.
-
•
The measured photometric tidal radii of the classical globulars are also typically 50–100 pc. Together with the ECs, the apparent trend of increasing tidal radius with increasing with galactocentric radius is as expected if the photometric measures are providing a reasonable indication of dynamical tidal truncation. In at least two cases, GC4 and GC5, there is evidence of a halo of stars beyond the King-model tidal radius, although as discussed in the text, for individual cases it is not necessarily the case that this photometric model parameter corresponds well to the dynamical tidal radius.
-
•
Overall, the properties of our outer sample extend the trend of larger half-light and core radii with increasing galactocentric distance seen in samples of inner GCs in M31, and also in the MW GC system. But they also reinforce the finding that in M31, the range of cluster properties (size and luminosity) is much greater in the outer halo of M31 than it is in the Milky Way.
-
•
In particular, we confirm that M31 possesses a number of compact, luminous clusters at large galactocentric radii that have no counterparts in the MW.
-
•
About half of the GCs are cuspy in their central regions, and hence not well-fit by King profiles. In particular, there seems to be a trend for some of the most remote clusters to have the steepest central power-law slopes. Thus the spread in the cuspiness for the whole population of clusters seems to increase at large galactocentric radius. Steep central surface brightness gradients may indicate these clusters have been through core-collapse.
Acknowledgments
NRT acknowledges a STFC Senior Research Fellowship.
AMNF and ADM acknowledge support from a Marie Curie Excellence Grant from the European Commission under contract MCEXT-CT-2005-025869.
ADM acknowledges an Australian Research Fellowship.
GFL thanks the Australian Research Council for support through his Future Fellowship (FT100100268) and Discovery Project (DP110100678).
Based on observations made with the NASA/ESA Hubble Space Telescope, obtained at the Space Telescope Science Institute (STScI), which is operated by the Association of Universities for Research in Astronomy, Inc., under NASA contract NAS 5-26555. These observations are associated with program GO-10394.
References
- Adén et al. (2009) Adén D., Wilkinson M. I., Read J. I., Feltzing S., Koch A., Gilmore G. F., Grebel E. K., Lundström I., 2009, ApJ, 706, L150
- Barmby, Holland, & Huchra (2002) Barmby P., Holland S., Huchra J. P., 2002, AJ, 123, 1937
- Barmby et al. (2007) Barmby P., McLaughlin D. E., Harris W. E., Harris G. L. H., Forbes D. A., 2007, AJ, 133, 2764
- Brasseur et al. (2011) Brasseur C. M., Martin N. F., Macciò A. V., Rix H.-W., Kang X., 2011, ApJ, 743, 179
- Chapman et al. (2005) Chapman S. C., Ibata R., Lewis G. F., Ferguson A. M. N., Irwin M., McConnachie A., Tanvir N., 2005, ApJ, 632, L87
- Chapman et al. (2008) Chapman S. C., et al., 2008, MNRAS, 390, 1437
- Chernoff et al. (1989) Chernoff D. F. & Djorgovski, S, 1989, ApJ, 339, 904
- Cohen et al. (2010) Cohen J. G., Kirby E. N., Simon J. D. & Geha M., 2010, ApJ, 725, 288
- Collins et al. (2009) Collins M. L. M., et al., 2009, MNRAS, 396, 1619
- Collins et al. (2011) Collins M. L. M., et al., 2011, MNRAS, 417, 1170
- Conroy, Loeb, & Spergel (2011) Conroy C., Loeb A., Spergel D. N., 2011, ApJ, 741, 72
- Federici et al. (2007) Federici L., Bellazzini M., Galleti S., Fusi Pecci F., Buzzoni A., Parmeggiani G., 2007, A&A, 473, 429
- Ferguson et al. (2002) Ferguson A. M. N., Irwin M. J., Ibata R. A., Lewis G. F., Tanvir N. R., 2002, AJ, 124, 1452
- Galleti et al. (2004) Galleti S., Federici L., Bellazzini M., Fusi Pecci F., Macrina S., 2004, A&A, 416, 917
- Geehan et al. (2006) Geehan J. J., Fardal M. A., Babul A., Guhathakurta P., 2006, MNRAS, 366, 996
- Gilbert et al. (2006) Gilbert K. M., et al., 2006, ApJ, 652, 1188
- Gnedin, Lee, & Ostriker (1999) Gnedin O. Y., Lee H. M., Ostriker J. P., 1999, ApJ, 522, 935
- Gnedin & Prieto (2008) Gnedin O. Y., Prieto J. L., 2008, IAUS, 246, 403
- Grillmair et al. (1996) Grillmair C. J., Ajhar E. A., Faber S. M., Baum W. A., Holtzman J. A., Lauer T. R., Lynds C. R., O’Neil E. J., Jr., 1996, AJ, 111, 2293
- Holland (1998) Holland S., 1998, PASP, 110, 759
- Hurley & Mackey (2010) Hurley J. R., Mackey A. D., 2010, MNRAS, 408, 2353
- Huxor et al. (2004) Huxor A., Tanvir N. R., Irwin M., Ferguson A., Ibata R., Lewis G., Bridges T., 2004, in Satellites and Tidal Streams, Astronomical Society of the Pacific. Eds F. Prada, D. Martinez Delgado, and T. J. Mahoney, 327, 118
- Huxor et al. (2005) Huxor A. P., Tanvir N. R., Irwin M. J., Ibata R., Collett J. L., Ferguson A. M. N., Bridges T., Lewis G. F., 2005, MNRAS, 360, 1007
- Huxor et al. (2011) Huxor A. P., et al., 2011, MNRAS, 414, 770
- Huxor et al. (2008) Huxor A. P., Tanvir N. R., Ferguson A. M. N., Irwin M. J., Ibata R., Bridges T., Lewis G. F., 2008, MNRAS, 385, 1989
- Ibata et al. (2001) Ibata R., Irwin M., Lewis G., Ferguson A. M. N., Tanvir N., 2001, Nature, 412, 49
- Ibata et al. (2005) Ibata R., Chapman S., Ferguson A. M. N., Lewis G., Irwin M., Tanvir N., 2005, ApJ, 634, 287
- Ibata et al. (2007) Ibata R., Martin N. F., Irwin M., Chapman S., Ferguson A. M. N., Lewis G. F., McConnachie A. W., 2007, ApJ, 671, 1591
- Irwin et al. (2005) Irwin M. J., Ferguson A. M. N., Ibata R. A., Lewis G. F., Tanvir N. R., 2005, ApJ, 628, L105
- Irwin et al. (2008) Irwin M. J., Ferguson A. M. N., Huxor A. P., Tanvir N. R., Ibata R. A., Lewis G. F., 2008, ApJ, 676, L17
- Kim et al. (2008) Kim E., Yoon I., Lee H. M., Spurzem R., 2008, MNRAS, 383, 2
- King (1962) King I., 1962, AJ, 67, 471
- King (1966) King I. R., 1966, AJ, 71, 64
- Mackey & Gilmore (2003) Mackey A. D., Gilmore G. F., 2003, MNRAS, 338, 85
- Mackey & Gilmore (2003) Mackey A. D., Gilmore G. F., 2003, MNRAS, 340, 175
- Mackey & Gilmore (2004) Mackey A. D., Gilmore G. F., 2004, MNRAS, 355, 504
- Mackey & van den Bergh (2005) Mackey A. D., van den Bergh S., 2005, MNRAS, 360, 631
- Mackey et al. (2006) Mackey A. D., et al., 2006, ApJ, 653, L105
- Mackey et al. (2007) Mackey A. D., et al., 2007, ApJ, 655, L85
- Mackey et al. (2010a) Mackey A. D., et al., 2010a, ApJ, 717, L11
- Mackey et al. (2010b) Mackey A. D., et al., 2010b, MNRAS, 401, 533
- Martin et al. (2006) Martin N. F., Ibata R. A., Irwin M. J., Chapman S., Lewis G. F., Ferguson A. M. N., Tanvir N., McConnachie A. W., 2006, MNRAS, 371, 1983
- Martin, de Jong, & Rix (2008) Martin N. F., de Jong J. T. A., Rix H.-W., 2008, ApJ, 684, 1075
- Martin et al. (2009) Martin N. F., et al., 2009, ApJ, 705, 758
- McConnachie et al. (2005) McConnachie A. W., Irwin M. J., Ferguson A. M. N., Ibata R. A., Lewis G. F. & Tanvir N., 2005, MNRAS, 356, 979
- McConnachie & Irwin (2006) McConnachie A. W. & Irwin, M. J., 2006, MNRAS, 365, 1263
- McConnachie et al. (2008) McConnachie A. W., et al., 2008, ApJ, 688, 1009
- McConnachie et al. (2009) McConnachie A. W., et al., 2009, Nature, 461, 66
- McLaughlin & van der Marel (2005) McLaughlin D. E., van der Marel R. P., 2005, ApJS, 161, 304
- McLaughlin et al. (2008) McLaughlin D. E., Barmby P., Harris W. E., Forbes D. A., Harris G. L. H., 2008, MNRAS, 384, 563
- Noyola & Gebhardt (2007) Noyola E., Gebhardt K., 2007, AJ, 134, 912
- Noyola & Gebhardt (2006) Noyola E., Gebhardt K., 2006, AJ, 132, 447
- Peebles (1984) Peebles P. J. E., 1984, ApJ, 277, 470
- Pryor & Meylan (1993) Pryor C., Meylan G., 1993, ASPC, 50, 357
- Read et al. (2006) Read J. I., Wilkinson M. I., Evans N. W., Gilmore G., Kleyna J. T., 2006, MNRAS, 366, 429
- Richardson et al. (2009) Richardson J. C., et al., 2009, MNRAS, 396, 1842
- Richardson et al. (2011) Richardson J. C., et al., 2011, ApJ, 732, 76
- Sérsic (1968) Sérsic J. L., 1968, Atlas de Galaxias Australes (Cordoba: Observatoria Astronomico).
- Strader, Caldwell, & Seth (2011) Strader J., Caldwell N., Seth A. C., 2011, AJ, 142, 8
- Trager, King, & Djorgovski (1995) Trager S. C., King I. R., Djorgovski S., 1995, AJ, 109, 1912
- Trenti et al. (2010) Trenti, M., Vesperini, E. & Pasquato, M., 2010, ApJ, 708, 1958
- van den Bergh & Mackey (2004) van den Bergh S., Mackey A. D., 2004, MNRAS, 354, 713
- Willman et al. (2005) Willman B., et al., 2005, ApJ, 626, L85
- Wilson (1975) Wilson C. P., 1975, AJ, 80, 175
- Zinn (1993) Zinn R., 1993, in Smith G.H., Brodie, J.P., eds., ASP Conf. Ser. 48: The Globular Cluster-Galaxy Connection. Astron. Soc. Pac., San Francisco, p. 38
- Zucker et al. (2004) Zucker D. B., et al., 2004, ApJ, 612, L121