Roles of Critical Valence Fluctuations in Ce- and Yb-Based Heavy Fermion Metals
Abstract
The roles of critical valence fluctuations of Ce and Yb are discussed as a key origin of several anomalies observed in Ce- and Yb-based heavy fermion systems. Recent development of the theory has revealed that a magnetic field is an efficient control parameter to induce the critical end point of the first-order valence transition. Metamagnetism and non-Fermi liquid behavior caused by this mechanism are discussed by comparing favorably with CeIrIn5, YbAgCu4, and YbIr2Zn20. The interplay of the magnetic order and valence fluctuations offers a key concept for understanding Ce- and Yb-based systems. It is shown that suppression of the magnetic order by enhanced valence fluctuations gives rise to the coincidence of the magnetic-transition point and valence-crossover point at absolute zero as a function of pressure or magnetic field. The interplay is shown to resolve the outstanding puzzle in CeRhIn5 in a unified way. The broader applicability of this newly clarified mechanism is discussed by surveying promising materials such as YbAuCu4, -YbAlB4, and YbRh2Si2.
1 Introduction
In this article, we discuss the roles of critical valence fluctuations of Ce and Yb as a key origin of several anomalies observed in the Ce- and Yb-based heavy fermion systems. Recent development of the theory and experiments have revealed that the valence fluctuations appear ubiquitously by tuning the control parameters of the magnetic field and pressure, giving rise to broader consequences than previously recognized. First, we briefly survey accumulated experiments on the anomalies related to the valence transition and its fluctuations, and explain how the theoretical understanding has been achieved so far. Then, we discuss the recent development of theory and experimental results focusing on the prototypical materials.
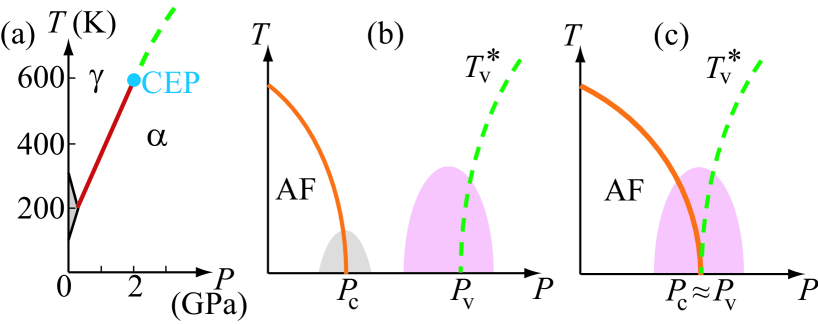
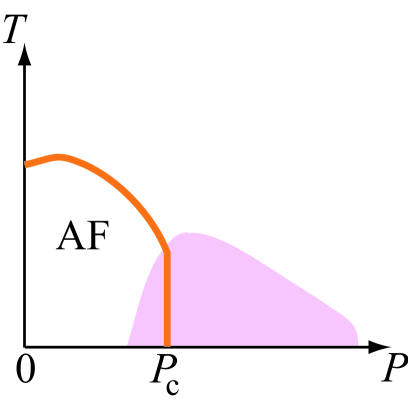
Valence transition is an isostructural phase transition with a valence of the materials element showing a discontinuous jump. A typical example is known as the - transition in Ce metal [1], where the first-order valence transition (FOVT) occurs in the temperature-pressure phase diagram while keeping the fcc lattice structure, as shown in Fig. 1(a). The critical end point (CEP) of the FOVT is located at (600 K, 2 GPa). The valence of Ce changes discontinuously between ( phase) and ( phase) at K [2]. YbInCu4 is also well known as a prototypical material for the isostructural FOVT [3, 4], where as decreases, the Yb valence changes discontinuously from to at K [5]. As diverging density fluctuations in the liquid-gas transition, valence fluctuations diverge at the CEP of the FOVT. When the temperature of the CEP is suppressed by controlling the materials parameters and enters the Fermi degeneracy regime, diverging valence fluctuations are considered to be coupled to the Fermi-surface instability. This multiple instability is considered to be a key mechanism for understanding anomalies observed in Ce- and Yb-based heavy-fermion systems. Such phenomena have been detected in CeCu2Ge2 [6] and CeCu2Si2 [7], where remarkable enhancement of the superconducting transition temperature appears at the pressure larger than corresponding to the antiferromagnetic (AF) quantum critical point (QCP) (see Fig. 1(b)), and in CeCu2(SixGe1-x)2 where two separate domes of the superconducting phase have been found under pressure [8]. In these materials, near , remarkable anomalies such as the -linear resistivity and enhancement of the residual resistivity have been observed, which clearly exhibit distinct behavior of resistivity near [6, 7, 8]. Furthermore, these materials show that the coefficient obtained by the fitting to the lowest- regime of the resistivity decreases by 2-3 orders of magnitude when increases across .
Theoretically, it has been pointed out that enhanced Ce-valence fluctuations are the possible origin of the anomalies near in the CeCu2(Si/Ge)2 systems [9]. It has also been pointed out that the sudden drop of the coefficient at can be understood as a sharp change of the valence of Ce on the basis of the Gutzwiller arguments in the periodic Anderson model [10]. It has been also shown that enhanced valence fluctuations cause the -linear resistivity [7] and enhancement of residual resistivity [11]. The emergence of the superconducting dome near in Fig. 1(b) has been explained by the valence-fluctuation-mediated superconductivity shown by the slave-boson mean-field theory taking account of the Gaussian fluctuations in the periodic Anderson model [10]. The density-matrix renormalization group (DMRG) calculation applied to the same model in one spatial dimension has also shown the enhancement of the superconducting correlation in the same parameter regime [12]. Pairing symmetry of density-fluctuation (i.e., valence-fluctuation)-mediated superconductivity has also been analyzed on the basis of the phenomenological model [13].
Furthermore, recent NQR measurement in CeCu2Si2 has detected change of the Cu-NQR frequency near , suggesting that the Ce valence changes near [14]. Detailed measurement of the dependence of the specific heat and the upper critical field in CeCu2Si2 under pressure concluded that the pairing symmetries of the superconducting phases near and are different, suggesting that a pairing mechanism different from the antiferromagnetic spin-fluctuation mediated one is realized near [15]. For a detailed summary of the theory and related experiments up to this stage, readers can refer to Ref. [16] and also Ref. [17].
Recent development of the theory of the quantum critical end point (QCEP) of the FOVT has revealed that valence fluctuations play a key role in the other Ce- and Yb-based heavy fermion systems more ubiquitously. We discuss the crucial roles of valence fluctuations in the following sections. In §2, we discuss the properties of the valence transition and valence crossover of Ce or Yb by comparing theoretical phase diagrams with Ce- and Yb-based systems. In §3, we discuss the fact that the QCEP of the FOVT can be induced rather easily by applying the magnetic field to the Ce- and Yb-based systems, which causes various anomalies such as metamagnetism and non-Fermi liquid behavior. We discuss that this mechanism gives a unified explanation for CeIrIn5, YbAgCu4, and YbIr2Zn20. In §4, we discuss the interplay of magnetic order and valence fluctuations, giving rise to coincidence of the magnetic transition and sharp valence crossover at K, as shown in Fig. 1(c). We show how the interplay resolves the outstanding puzzle in CeRhIn5 and also in YbAuCu4. The summary and outlook are given in §5. The broader applicability of the present mechanism is discussed by surveying promising materials such as -YbAlB4 and YbRh2Si2.
2 Model and phase diagrams
2.1 Minimal model for Ce- and Yb-based heavy fermions exhibiting valence transition
We consider the simplest minimal model, which describes an essential part of the physics in Ce- and Yb-based heavy fermion systems exhibiting valence transition, as follows:
| (1) |
where represents the conduction band, the f level and onsite Coulomb repulsion for f electrons, the hybridization between f and conduction electrons, and the Coulomb repulsion between f and conduction electrons. The term is a key ingredient for explaining the valence transition as well as the various anomalies caused by enhanced Ce- or Yb-valence fluctuations [10, 12, 16, 18, 17]: The -linear resistivity and residual resistivity peak have also been shown theoretically by the model Eq. (1) [7, 11].
2.2 Ground state and finite- phase diagrams
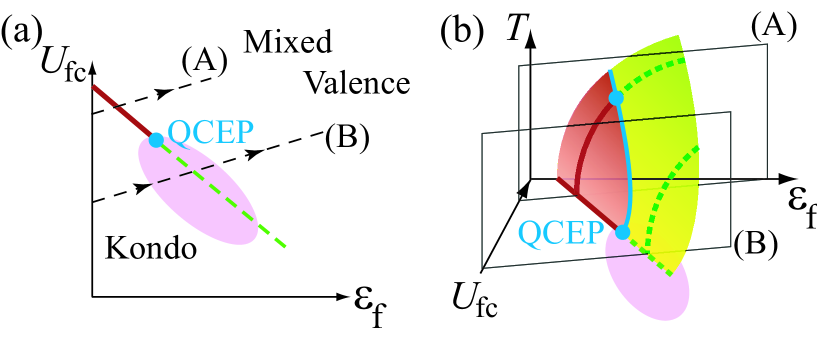
Figure 2(a) shows the schematic ground-state phase diagram for paramagnetic states drawn on the basis of the DMRG calculation in one-spatial dimension [12] and the calculation by the dynamical-mean-field-theory (DMFT) in infinite-spatial dimension [19] applied to the model Eq. (1). Here, the filling with for a=f or c with being the number of lattice sites is set slightly smaller than 1 (half filling), which describes typical Ce- and Yb-based heavy-fermion metals.
The FOVT line (solid line) terminates at the QCEP (filled circle) and sharp valence crossover occurs (dashed line). When is deep enough, the Kondo state with is realized. As increases across the FOVT and valence-crossover line, the mixed valence (MV) state with is realized [20]. At the QCEP, the valence fluctuation diverges and at the valence-crossover line, enhanced valence fluctuation appears [12, 18]. We note that the slave-boson mean-field theory for [12], [21], and [22, 18] also gives essentially the same phase diagram as Fig. 2(a). This is because the valence transition and its fluctuation are caused by the atomic Coulomb interaction in Eq. (1), which is ascribed to the local origin. Hence, the essential feature of the phase diagram for the valence transition does not depend on the spatial dimension. As shown by the shaded region in Fig. 2(a), near the QCEP of the FOVT, the superconducting phase is shown to appear by the slave-boson mean field theory taking into account the Gaussian fluctuations [10], which is supported by the DMRG calculation in the same model Eq. (1) in [12].
Here, we remark that the valence transition is completely different from the localized-to-itinerant transition of f electrons. Everywhere in the phase diagram in Fig. 2(a), f electrons are itinerant with finite c-f hybridization . Hence, the number of f electrons is always included in the total volume of the Fermi surface, giving rise to the large Fermi surface (see also Fig. 6(b)). This is naturally understood in terms of the Landau-Luttinger sum rule. The existence of the QCEP in the ground-state phase diagram ensures that adiabatic continuation holds between the Kondo state and the MV state by detouring the QCEP of the first-order-transition line.
Figure 2(b) shows the schematic phase diagram in the -- space. The FOVT surface (dark surface) bends to the side of the MV regime for at least large since larger entropy coming from f-spin degrees of freedom in the Kondo regime earns the larger free-energy gain [18]. The FOVT line in Fig. 2(a) is the line at the bottom of the FOVT surface. The critical-end line exhibiting diverging valence fluctuations, i.e., , separates the FOVT surface and the valence-crossover surface (light surface), which touches the plane at the QCEP. We note that even at the valence-crossover surface, valence fluctuations are enhanced [18], which cause remarkable anomalies in physical quantities in Ce- and Yb-based materials, as will be shown in §3 and §4.
2.3 Correspondence to Ce- and Yb-based materials
As shown in Fig. 2(a), the Kondo (MV) state with is realized for deep (shallow) for a fixed . In Ce systems, the state corresponds to with a -electron configuration per Ce site. In Yb systems, where has -electron configuration per Yb site, the hole picture is useful, so that the state corresponds to with a -hole configuration per Yb site.
When we apply pressure to the Ce (Yb) compounds, increases (decreases), since negative ions approach the tail of the wavefunction of 4f electrons (holes) at the Ce (Yb) site. The hybridization and inter-orbital Coulomb interaction also increase. In the case of Ce metal, 4f and 5d electrons are located at the same Ce site, which makes large [1]. In Fig. 2(a), the dashed line with an arrow (A) represents the route for applying the pressure to Ce metal. Hence, the cutout for the large including the axis labeled by (A) in Fig. 2(b) corresponds to the - phase diagram of Ce metal shown in Fig. 1(a). Namely, the large critical-end temperature K in Ce metal is naturally understood from a large due to its on-site origin in Fig. 2(b).
On the other hand, in the case of Ce (Yb) compounds with conduction electrons supplied from elements other than Ce (Yb), the Coulomb repulsion between the 4f electron at the Ce (Yb) site and the conduction electron is weaker in general because of its inter-site origin. Hence, applying pressure to the Ce compounds corresponds to the route represented by the dashed line with arrows (B) in Fig. 2(a). The cutout for such a moderate labeled by (B) in Fig. 2(b) is considered to correspond to the - phase diagrams of most of the Ce-based compounds. Although the magnetically-ordered phase is not shown in Figs. 2(a) and 2(b) for simplicity of explanation here, the cutout (B) corresponds to Fig. 1(b) (or Fig. 1(c)). Namely, in CeCu2(Si/Ge)2 systems, the AF phase is located in the Kondo regime with a certain interval to the valence-crossover pressure in Fig. 1(b), where the valence-crossover temperature covered by the superconducting dome corresponds to the cutout of Fig 2(b). When we take into account the magnetic order in the phase diagram, depending on the strength of the c-f hybridization (and also and ) in Eq (1), the location of the magnetic-paramagnetic phase boundary changes. Hence, the relative position of and changes as shown in Figs. 1(b) and 1(c). The interplay of the magnetic order and valence crossover (or transition) is quite important in understanding the actual phase diagrams of Ce- and Yb-based systems, which will be discussed in §4.
Here, we remind the readers of the fact that even at the - transition in Ce metal, the magnitude of the valence jump is about [2] as it is in the case of YbInCu4 [5], as remarked in §1. We note that the magnitude of the valence change at the valence crossover for moderate is smaller than that at the FOVT for large , which is expected to be in the order of . Actually, such a tiny change of the Yb valence has been observed at the valence-crossover temperature K in YbAgCu4 [35], which will be discussed in §3.3.
3 Field-induced valence crossover
3.1 Theoretical results
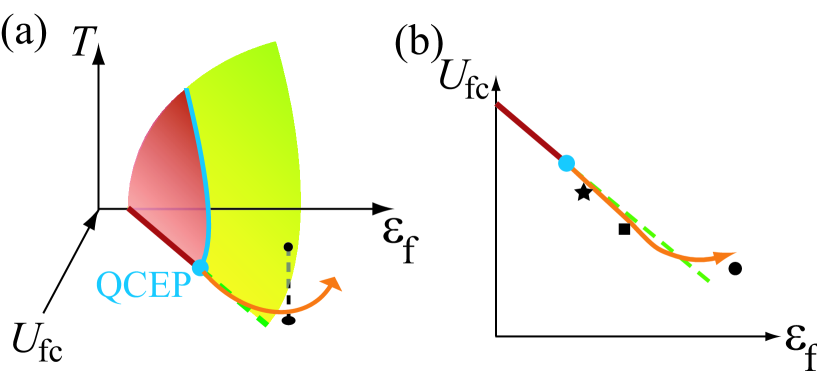
As shown in §2, the valence transition is essentially ascribed to the charge degrees of freedom and it is nontrivial how the magnetic field affects the valence transition. Recently, theoretical studies have clarified that the QCEP of the FOVT as well as the sharp valence crossover is induced by applying a magnetic field [18]. The slave-boson mean-field theory applied to the model Eq. (1) in with the Zeeman term has shown that the FOVT surface and the valence-crossover surface move as shown in Fig. 3(a) [22, 18]. On the locus with an arrow illustrated in Fig. 3(a), the magnetic susceptibility with diverges. Namely, metamagnetism occurs. The DMRG calculation applied to the same model in has also shown that the field-induced extension of the QCEP of the FOVT to the MV regime actually occurs, giving rise to the metamagnetisim [22]. This finding is quite important and hence we put special emphasis on this result: At the QCEP of the FOVT, not only the valence fluctuation, i.e., charge fluctuation, but also the magnetic susceptibility diverges.
Furthermore, this result indicates that even in the intermediate-valence materials, which does not show any valence transition at , the QCEP of the FOVT is induced by applying the magnetic field . An important point here is that as shown in Fig. 2(b), most of the Ce- and Yb-based compounds are located in the region for a moderate , but not in the region for a large causing the FOVT. Hence, in the Ce- and Yb-based compounds, the valence-crossover temperature with strong valence fluctuations can emerge in the - phase diagrams. Here, the magnitude of the characteristic field to make emerge depends on how close the location of the material is to the QCEP of the FOVT in the phase diagram. When the material is located close to the QCEP, metamagnetism as well as non-Fermi liquid behavior is expected to be observed by applying even a small magnetic field. In the following sections of §3.2, §3.3, and §3.4, we discuss the possible relevance of this mechanism to experimental observations.
3.2 Metamagnesim and non-Fermi liquid behavior in CeIrIn5
CeIrIn5 is a heavy-fermion metal, which shows a superconducting transition at K at ambient pressure [23]. When pressure is applied, the superconducting transition temperature increases in spite of the fact that the In-NQR relaxation rate drastically decreases, suggesting the possibility that a pairing mechanism different from the spin-fluctuation-mediated one is relevant to CeIrIn5 [24]. Interestingly, a metamagnetic anomaly was found to exist in the magnetization curve in CeIrIn5 [25]. Several experimental groups have reported this anomaly occurring at the crossover (or first-order-transition) line in the - phase diagram, as shown in Fig. 4 [26, 27, 28, 29]. As increases to approach , non Fermi-liquid behavior becomes prominent: (i) Convex behavior appears in the plot of the low- resistivity suggesting that the -linear resisivity appears near [28]. (ii) Residual resistivity has a peak at [29]. (iii) The specific-heat constant shows a logarithmic divergence near [28]. The properties of (i) and (ii) are consistent with the theoretical results of critical valence fluctuations in Ref. [7] and Ref. [11], respectively, as explained in §1. The property of (iii) is also consistent with a theory recently developed for quantum valence criticality, which has shown that evaluation of the quasiparticle self-energy for one valence-fluctuation exchange process gives the low- specific heat as in a certain- regime [30]. In Fig. 4, the crossover line touches K at T [29]. This fact and the above observations of (i)-(iii) suggest that CeIrIn5 is located at the valence-crossover regime indicated by the black square in Fig. 3(b). At , the black-square point is located at the Kondo regime. However, as increases, the slope of the valence crossover line (dashed line) becomes steeper, which crosses the black-square point at T. This causes emergence of the valence-crossover line for T, as shown in Fig. 4. Namely, CeIrIn5 seems to be located at a distance of about T from the valence-crossover line (dashed line in Fig. 3(b)), close to the QCEP at . Hence, at K in Fig. 4 seems to be in close proximity to the QCEP, which affects the low- physics in CeIrIn5.
Recent measurement of the de Haas-van Alphen (dHvA) effect has confirmed that the dHvA frequencies are not substantially altered at in Fig. 4 [29]. This implies that the Fermi-surface topology remains essentially the same between the regime and the regime. This is also consistent with the metamagnetism caused by the field-induced QCEP of the FOVT: As explained in detail in Fig. 2(a) in §2.2, the Fermi-surface volume basically does not change at the FOVT and valence crossover so long as a system remains in a paramagnetic state (Of course, in case of the FOVT (valence crossover), the lattice constant shows a discontinuous (continuous) change, which gives a change of the wave number itself). We also note that no evidence of the folded Brillouin Zone below and above has been obtained by the dHvA measurement in CeIrIn5 [29]. This result indicates that the field-induced AF-ordered phase is unlikely to be realized at , although the possibility of the magnetic-breakdown effect in the dHvA measurement should be carefully examined.
We also note that CeIrIn5 and CeCoIn5 have almost the same Fermi surfaces according to the band-structure calculations [31] and the dHvA measurements [32]. Both materials have a quite similar level scheme of the crystalline electric field (CEF) [33]. However, in CeCoIn5, the crossover line (or first-order transition line) accompanied by the non-Fermi liquid behavior as shown in Fig. 4 does not appear in the - phase diagram. We note here that by applying pressure to CeCoIn5, residual resistivity and the coefficient of the low- resistivity drop drastically [34]. These observations suggest that the QCEP of the FOVT, or the sharp valence crossover point exists on a slightly-negative pressure side in the - phase diagram of CeCoIn5. Actually, the experimental fact of the emergence of the -linear resistivity and logarithmic divergence of the specific heat at low temperatures and ambient pressure in CeCoIn5 does not contradict this point of view [30].
These results indicate that a viewpoint of the closeness to the QCEP of the FOVT is important for understanding the Ce115 systems in addition to the conventional view based on the competition between the Kondo effect and the RKKY interaction. Indeed, this viewpoint offers us a key to resolving the outstanding puzzle in CeRhIn5 as well, which will be discussed in §4.1. Since the superconducting correlation has been shown to develop near the QCEP of the FOVT theoretically (see Figs. 2(a) and 3(b)) [10, 12], the proximity to the QCEP seems to control the occurrence of the unconventional superconductivity in CeIrIn5.
To examine our theoretical proposal, it is desirable to measure the valence change of Ce at the crossover line (or first-order transition line) in Fig. 4. The X-ray adsorption spectra for direct observation of the Ce valence, the NQR measurement for the electric-field gradient, the ultrasonic measurement, and the X-ray diffraction and/or thermal expansion measurement for the lattice-constant change are highly desirable.
3.3 Enhanced magnetic susceptibility and metamagnetism in YbAgCu4
As noted in §1, YbInCu4 shows the FOVT at K [3, 4]. When In is replaced by other elements, the FOVT has not been observed. However, anomalous behavior which seems to be related to valence fluctuations has been observed in YbAgCu4 [35]. In YbAgCu4, uniform magnetic susceptibility has a broad peak at K. Below K, the volume expansion occurs [36] simultaneously with a sharp valence crossover from Yb+2.89 for K to Yb+2.87 for K [35], indicating that negative volume expansion occurs as increases to approach K. Namely, the uniform magnetic susceptibility is enhanced at the valence-crossover temperature K with strong valence fluctuations. This is consistent with our theoretical result discussed in §3.1 [18]. At the QCEP and the critical-end line in Fig. 3(a), the valence fluctuations diverge. At the same time, the magnetic susceptibility diverges [22]. YbAgCu4 seems to be located in the valence-crossover regime indicated by the black circle in Fig. 3(a), whose distance from the valence-crossover surface at is about K as shown by the black dashed line in Fig. 3(a) [18, 17]. Hence, the broad peak of the magnetic susceptibility is considered to be caused by the valence fluctuations developed at the valence-crossover surface. YbAgCu4 shows a metamagnetism in the low temperature limit around T [35]. This can also be naturally understood from the field-induced valence-crossover surface shown in Fig. 3(a). Namely, the location of YbAgCu4 indicated by the black circle in Fig. 3(b) is at a distance of about T from the valence-crossover line close to the QCEP at . For more details, the readers can refer to Refs. [17] and [18].
3.4 Enhanced magnetic susceptibility and metamagnetism in YbIr2Zn20
Recently, behaviors similar to those of YbAgCu4 have been observed in YbIr2Zn20 [37]. The uniform magnetic susceptibility has a peak at K accompanied by the volume expansion for . Since the unit-cell volume with the Yb+2.0 ( hole configuration) state is larger than that with the Yb+3.0 ( hole configuration) state, this observation suggests that the enhancement of the magnetic susceptibility is caused by the enhanced Yb-valence fluctuations associated with the valence change of Yb. This viewpoint is consistent with the fact that the thermal expansion coefficient is negative for [37].
Recently, it has been found that YbIr2Zn20 shows a metamagnetism at T [37]. Near the metamagnetic field , enhancement of the cyclotron mass of electrons has been observed by the dHvA measurement. The specific-heat constant and the coefficient of the resistivity at low temperatures also indicate the mass enhancement of electrons at . Furthermore, residual resistivity has a peak at . The temperature region where the low- resistivity shows the dependence becomes narrowest in the vicinity of , which suggests a tendency of the -linear resistivity near . All these observations are naturally explained by the field-induced valence crossover discussed in §3.1. Although the mass enhancement and the residual-resistivity peak suggest a clear signature of the Yb-valence fluctuations developed when approaches , the experimental fact that the resistivity has the dependence at the lowest temperatures even at implies that YbIr2Zn20 at ambient pressure is located at the valence-crossover regime. Namely, YbIr2Zn20 seems to be located at a similar position to that of YbAgCu4, indicated by the black circle in Fig. 3(b). The distance from the valence-crossover line close to the QCEP at seems to be about T in YbIr2Zn20, since metamagnetic field is about T [38]. Indeed, a steep volume shrinkage has been observed at [37], which indicates that the Yb valence sharply increases at . The dHvA measurement has concluded that the Fermi surfaces do not change at from the fact that the dHvA frequencies do not change across [37]. This is also consistent with the mechanism of the field-induced valence crossover, since the Fermi-surface volume is essentially unchanged at the valence crossover so long as the system remains in the paramagnetic state as discussed in §2.2 and also in §3.2.
When pressure is applied to YbIr2Zn20, the metamagnetic field can be tuned to approach T [39]. This seems to be consistent with the location of YbIr2Zn20 mentioned above, since applying pressure makes large because of the reduction of the distance between wavefunctions of 4f and conduction electrons and also makes small (i.e., large) in the hole picture. Here, we should note that the panel of the cutout shown in Fig. 2(b) is drawn for the Ce compounds. In the case of Yb compounds, the panel tilts with a certain angle with the opposite sign to the axis. The observation of the quantum criticality at the QCEP of the FOVT by tuning the control parameters of the pressure and/or magnetic field is an interesting future issue [40]. Systematic measurements in YbX2Zn20 (X=Ir, Co, and Rh) are highly desirable for a unified understanding of the effect of the critical valence fluctuations.
4 Interplay of magnetic order and valence fluctuations
In the preceding sections, we have discussed the nature of the QCEP of the FOVT in a paramagnetic phase and how it is controlled by applying the pressure and/or magnetic field. In Ce- and Yb-based heavy fermion systems, however, the magnetic order can also occur. The interplay of the magnetic order and Ce- or Yb-valence fluctuations offers a key concept for understanding these systems. Below we focus on CeRhIn5 as a prototypical material to demonstrate how such an interplay plays a crucial role in understanding the puzzling behaviors.
4.1 CeRhIn5
CeRhIn5 is a heavy-fermion metal [41] which undergoes an AF transition at K with the ordered vector at ambient pressure [42]. When pressure is applied, the AF-ordered phase changes to the paramagnetic and superconducting phase at GPa, as shown schematically in Fig. 5 [43, 44, 45, 46, 47, 48, 49]. This material has attracted much attention since accumulated experiments offer outstanding puzzle, whose significant features are summarized as follows: (i) The Sommerfeld constant mJ/(molK2) in the AF state at is about 10-times larger than mJ/(molK2) in LaRhIn5 [41, 46]. (ii) The Fermi surfaces similar to those in LaRhIn5 in the AF phase for GPa change to the Fermi surfaces similar to those in CeCoIn5 in the paramagnetic phase for by the dHvA measurement performed under the magnetic field T [46]. (iii) The cyclotron mass of electrons shows an enhancement toward : The cyclotron mass of the branch, whose Fermi surface has a cylindrical shape, changes from at to at and the signal is not detected for , probably because of a too heavy mass, [46]. (iv) The -linear resistivity emerges prominently near [43, 44, 47]. (v) Residual resistivity has a peak at [43, 44, 47]. (vi) The superconducting phase exists in a wide pressure region around [43, 44, 45].
Because of the dHvA measurement noted above (ii), one might succumb to the temptation to believe a scenario in which the localized to itinerant transition of f electrons happens at [50, 51]. However, this scenario encounters a serious difficulty in explaining the experimental fact (i) above: The AF state with the 10-times mass enhancement at strongly suggests that the heavy quasiparticles contribute to the formation of the AF state, indicating the existence of the c-f hybridization even in the AF phase for . Hence, the theoretical explanation for resolving a series of puzzles outlined above (i)-(vi) in a natural and unified way has been desired.
First of all, let us point out that the transport anomalies above (iv) and (v) and the robust superconducting phase (vi) are quite similar to the observations in the CeCu2(Si/Ge)2 systems [6, 7, 8] introduced in §1. Emergence of the -linear resistivity prominent at in Fig. 1(b), at which the residual resistivity has a peak, covered with the superconducting phase in the wide pressure region is the common feature in CeCu2Ge2 [6], CeCu2Si2 [7], and CeCu2(GexSi1-x)2 [8]. Since the -linear resistivity and residual resistivity peak appear at the AF-paramagnetic boundary in CeRhIn5, seems to be realized in Fig. 5. As will be shown below, this is actually the case realized in the model Eq. (1) for realistic parameters for CeRhIn5, which naturally resolves the above puzzles (i)-(vi) [21].
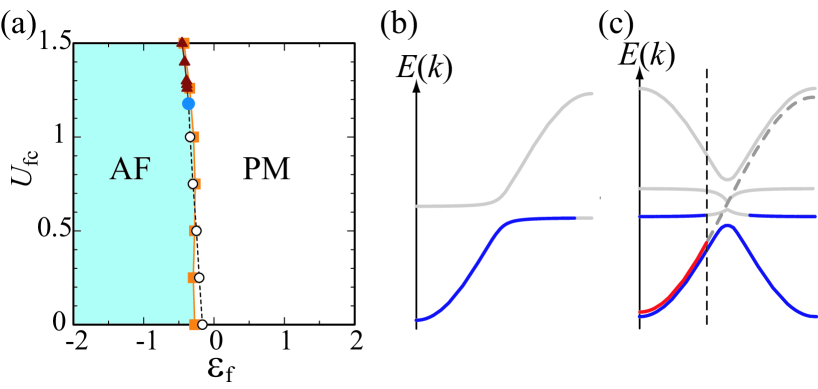
Figure 6(a) shows the ground-state phase diagram of the model Eq. (1) without the magnetic field on the square lattice obtained by the slave-boson mean-field theory [52], which enables us to treat the AF order and valence transition or fluctuations on equal footing. Here, we set small hybridization and the conduction band as at the total filling to mimic the branch of CeRhIn5 [46]. The FOVT line (solid line with triangles) terminates at the QCEP (filled circle). Valence crossover with enhanced valence fluctuations occurs on the dashed line with open circles. These are the results within the paramagnetic states. When the AF order with the ordered vector is taken into account, we find that the AF-paramagnetic boundary represented by the solid line with filled squares emerges at almost the same place as the FOVT line and the valence-crossover line. Since can be regarded as the pressure as explained in §2.3, this result implies that is realized.
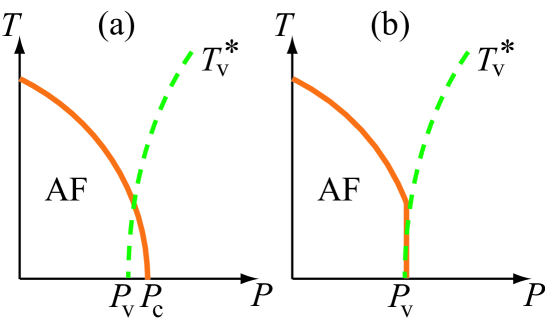
The precise explanation of this mechanism is illustrated in Figs. 7(a) and 7(b). As shown in Fig. 7(a), when the Nel temperature close to K, i.e., K, meets the valence-crossover temperature , enhanced valence fluctuations suppress the AF order. Then, the AF order is suddenly cut around , as shown in Fig. 7(b). Actually, the slave-boson mean-field calculation shows that the AF order exhibits the first-order transition at the solid line with filled squares in Fig. 6(a) [21]. Namely, the coincidence of the AF transition and the valence crossover or transition is caused by the enhanced valence fluctuations or the FOVT. Hence, the illustrated in Fig. 1(c), or more precisely in Fig. 7(b), is shown to be realized for a small hybridization case in the model Eq. (1), which is a realistic parameter for CeRhIn5 [46]. We should remark that for larger hybridization , the AF-paramagnetic boundary appears at smaller than the FOVT and valence-crossover line in Fig. 6(a), which corresponds to Fig. 1(b). Hence, depending on the strength of the hybridization , the relative position of and changes as shown in Figs. 1(b) and 1(c), and Fig. 7(a).
We have also shown that the Fermi surface calculated for in the AF phase at is nearly the same as the small Fermi surface without c-f hybridization where electrons for are located at the localized f level and the conduction band is filled up with all extra electrons for [21]. This naturally explains the dHvA measurement (ii) above. In the paramagnetic phase in Fig. 6(a), the large Fermi surface, which counts the f-electron number in the total Fermi volume, i.e., , is realized, as shown in Fig. 6(b). In the AF phase, the lower and upper hybridized bands are folded, as shown in Fig. 6(c). Since the lower folded hybridized band is completely filled, the Fermi surface becomes the same as that of the conduction electrons at the filling . Hence, we stress that the small Fermi surface appears in the AF phase with finite c-f hybridization, .
The mass enhancement observed by the dHvA measurement (iii) above is also quantitatively reproduced by the same model Eq. (1) under the magnetic field T [21]. Namely, the mass enhancement of the two-dimensional-like Fermi surface of the branch from at to at [46] is well reproduced by the present mechanism, which shows that the total density of states at the Fermi level increases near the AF-paramagnetic boundary in Fig. 6(a). This is because when the pressure is applied to the AF state, i.e., when increases, the gap between the original lower hybridized band and the folded band increases as in Fig. 6(c). Then, the f-electron-dominant flat part of the folded lower hybridized band approaches the Fermi level, giving rise to the increase in the density of states. In the paramagnetic phase, as approaches the AF-paramagnetic boundary in Fig. 6(a), i.e., as decreases, increases to approach 1, which is in the so called Kondo regime. Hence, the density of states at the Fermi level increases. Thus, the reason why the mass enhancement occurs toward the AF-paramagnetic boundary in CeRhIn5 is naturally explained.
This result is quite consistent with a recent experiment on the effective mass of electrons [43]: Knebel et al applied a magnetic field to CeRhIn5, whose magnitude is the same as T used in the dHvA measurement [46]. After the disappearance of the superconductivity, the dependence of the resistivity appears at lowest temperatures. Knebel et al found that the with being the coefficient of the term scales nicely with the cyclotron mass of the branch under pressure for , i.e., const. scaling holds [43]. This scaling indicates that the mass enhancement toward is essentially caused by the effect of the energy band dispersion of quasiparticles [53]. We also note that about 10-times mass enhancement at is also reproduced by the same model Eq. (1) [21], which is quite consistent with the experimental fact (i) above. Formation of the heavy quasiparticles via the c-f hybridization naturally explains the mass enhancement even inside of the AF phase.
As shown in Fig. 6(a), is a consequence of the suppression of the AF order by enhanced valence fluctuations for moderate , e.g., , which is a realistic parameter for CeRhIn5, giving rise to the -linear resistivity and the residual resistivity peak at the AF-paramagnetic boundary. Hence, the experimental facts (iv) and (v) are naturally explained. Since the superconducting phase was shown to be realized around [10, 12], as shown in Fig. 1(b), the above (vi) is also consistently explained (see Fig. 5 and Fig. 7(b)). Hence, all of the above experimental observations (i)-(vi) are naturally explained in a unified way.
We note that local correlation effects of 4f electrons give rise to the large ordered moment of the AF order: Only about reduction of the full ordered moment for the Kramers doublet of the lowest CEF level is realized even near the AF-paramagnetic boundary in Fig. 6(a) by the slave-boson mean-field theory [21], which is consistent with the observation in CeRhIn5 [48]. Our result shows that strong onsite Coulomb repulsion of 4f electrons yields the local-moment-like behavior as if f electrons are localized, in spite of the fact that f electrons are always itinerant, i.e., always holds everywhere of the phase diagram shown in Fig. 6(a), which is nothing but a manifestation of the localized-itinerant duality [54].
As reported in Ref. [55], the experimental comparison between CeRhIn5 and CeCo(In1-xCdx)5 shows that CeRhIn5 at corresponds to CeCoIn5 at [16]. This is quite consistent with our argument in §3.2: Because is realized in CeRhIn5, if the above correspondence holds, that implies that on the slightly-negative pressure side in the - phase diagram of CeCoIn5, the QCEP or sharp Ce-valence crossover point, i.e., , exists, which is the same conclusion stated in §3.2.
The interplay of the magnetic order and enhanced valence fluctuations plays an important role not only in CeRhIn5 but also in other materials. One such example is YbAuCu4, which will be discussed in the next section.
4.2 YbAuCu4
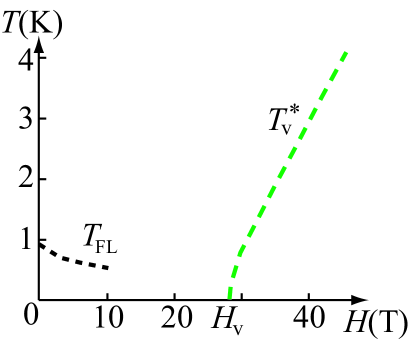
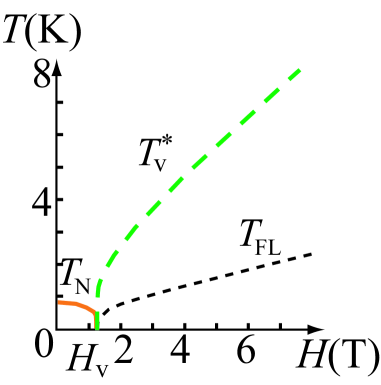
YbAuCu4 is a sister compound of YbInCu4, which exhibits the FOVT as noted in §1. We note that the phase diagram of YbAuCu4 shown in Fig. 8 is essentially the same as Fig. 1(c) or Fig. 7(b), if is replaced by [56]. The 63Cu-NQR measurement has detected that there exists a characteristic temperature in the - phase diagram, at which the Cu-NQR frequency changes sharply, strongly suggesting that the Yb-valence crossover occurs [57]. The Yb-valence crossover temperature becomes K at the field , which seems to coincide with the field at which the Nel temperature goes to K [56, 57] (see Fig. 8). Namely, occurs in the - phase diagram. As discussed in §3.1, the valence crossover temperature is induced by applying the magnetic field. If YbAuCu4 is located at the moderate regime indicated by the black star in Fig. 3(b), the appearance of in Fig. 8 is naturally explained [17]. Namely, YbAuCu4 seems to be in the Kondo regime at and by applying T, the valence crossover is induced, as shown in Fig. 8. This indicates that YbAuCu4 is close to the QCEP at with a distance of about T as indicated by the black star in Fig. 3(b). As explained in §4.1, when close to K meets , a suppression of the magnetic order by enhanced valence fluctuations occurs, which gives rise to the coincidence . In YbAuCu4, the cusp-like anomaly of the residual resistivity was observed at [57]. The mass enhancement of electrons estimated from the coefficient in the resistivity was also observed near [57]. These observations are naturally explained by the enhanced Yb-valence fluctuations [17].
5 Summary and outlook
In this article, the roles of critical valence fluctuations in Ce- and Yb-based heavy fermion metals are discussed. Recent development of theory and experiment has revealed that critical Ce- and Yb-valence fluctuations play a key role in several anomalies in this family of materials. Magnetic field is shown to be a useful control parameter to induce the quantum critical end point (QCEP) of the first-order valence transition (FOVT). As a prototypical material, metamagnetism and non-Fermi liquid behavior in CeIrIn5, YbAgCu4, and YbIr2Zn20 are shown to be naturally explained by the mechanism of the field-induced valence crossover. The interplay of the magnetic order and Ce- or Yb-valence fluctuations is a key mechanism for understanding anomalous behavior in Ce- and Yb-based heavy fermion systems. It is shown that the interplay resolves the outstanding puzzle in CeRhIn5. The origin of the transport anomalies and drastic change of the Fermi surfaces accompanied by the mass enhancement of electrons is naturally explained by the interplay in a unified way. A special emphasis is put on the fact that a small Fermi surface generally appears by the folding of the hybridized band in the AF phase in the periodic Anderson model. The unified explanation for CeInIn5 and CeRhIn5 strongly suggests that the viewpoint of the closeness to the QCEP of the FOVT is indispensable in understanding the Ce115 systems. As another prototypical material where the interplay occurs, the - phase diagram of YbAuCu4 is discussed. The proximity to the QCEP of the FOVT is a key concept for understanding Ce- and Yb-based heavy fermion systems as an underling mechanism.
For outlook, recently synthesized materials, YbIr2Zn20, YbCo2Zn20, and YbRh2Zn20 are promising materials, which are expected to show the properties caused by the Yb-valence fluctuations by tuning the control parameters of the magnetic field and pressure. Recently, in -YbAlB4, where the superconductivity was first discovered among Yb-based compounds [61], evidence of strong Yb-valence fluctuations has been reported [62]. Further study to clarify the role of the valence fluctuations in the unconventional criticality as well as the origin of the superconductivity is an interesting future problem. We point out that the - phase diagram in YbRh2Si2 [58], where unconventional criticality has attracted much attention in correlated electron systems [59], is closely similar to that in YbAuCu4 (see Fig. 8). Hence, there exists a possibility that the critical Yb-valence fluctuation plays a key role in the origin of the unconventional criticality in YbRh2Si2. Thus, it is quite important to examine the possibility of whether the Yb-valence change takes place at the crossover temperature whose origin has not yet been clarified experimentally in the - phase diagram. The experimental fact that YbRh2Si2 shows a huge mass enhancement even at such as J/(molK2) deep inside of the AF phase [60] indicates that heavy quasi particles form the AF-ordered state as in CeRhIn5. The Co-NQR measurement in Yb(Rh1-xCox)2Si2 and/or the direct observation of the Yb valence by X-ray adsorption measurement at the crossover temperature are highly desirable. As noted in §2.3, the magnitude of the valence change is expected to be of the order of in most of the Ce and Yb compounds. Hence, high accuracy measurement which can detect the tiny change of the valence is a challenging future problem, which will open new avenues of study in this field.
6 Acknowledgements
This work is supported by the Global COE program (G10) and a Grant-in-Aid for Scientific Research (No. 19340099) from the Japan Society for the Promotion of Science (JSPS), and a Grant-in Aid for Scientific Research on Innovative Areas “Heavy Electrons” @(No.20102008) from the Ministry of Education, Culture, Sports, Science and Technology of Japan. S. W. is supported by a Grant-in-Aid for Young Scientists (B) (No. 21740240) from JSPS.
References
References
- [1] Gschneidner K A and Eyring L, Handbook on the Physics and Chemistry of Rare Earths (North-Holland, Amsterdam, 1978)
- [2] Wohlleben D and Rohler J, 1984 J. Appl. Phys. 55 15
- [3] Felner I and Nowik I 1986 Phys. Rev. B 33 617
- [4] J. L. Sarrao, C. L. Benton, Z. Fisk, J. M. Lawrence, D. Mandrus, and J. D. Thompson 1996 Physica B 223&224 366
- [5] Matsuda Y H, Inami T, Ohwada K, Murata Y, Nojiri H, Murakami Y, Ohta H, Zhang W, and Yoshimura Y 2007 J. Phys. Soc. Japan 76 034702
- [6] Jaccard D, Wilhelm H, Alami-Yadri K, and Vargoz E 1999 Physica B 259-261 1
- [7] Holmes A T, Jaccard D, and Miyake K 2004 Phys. Rev. B 69 024508
- [8] Yuan H Q, Grosche F M, Deppe M, Geibel C, Sparn G, and Steglich F 2003 Science 302 2104
- [9] Miyake K, Narikiyo O, and Onishi Y 1999 Physica B 259-261 676
- [10] Onishi Y and Miyake K 2000 J. Phys. Soc. Japan 69 3955
- [11] Miyake K and Maebashi H 2001 J. Phys. Soc. Japan 71 1007
- [12] Watanabe S, Imada M, and Miyake K 2006 J. Phys. Soc. Japan 75 043710
- [13] Monthoux P and Lonzarich G G 2004 Phys. Rev. B 69 064517
- [14] Fujiwara K, Hata Y, Kobayashi K, Miyoshi K, Takeuchi J, Shimaoka Y, Kotegawa H, Kobayashi T C, Geibel C, and Steglich F 2008 J. Phys. Soc. Japan 77 123711
- [15] Lengyel E, Nicklas C M, Jeevan H S, Sparn G, Geibel C, Steglich F, Yoshioka Y, and Miyake K 2009 Phys. Rev. B 80 140513
- [16] Miyake K 2007 J. Phys.: Condens Matter 19 125201
- [17] Watanabe S and Miyake K 2010 Phys. Status Solidi B 247 490
- [18] Watanabe S, Tsuruta A, Miyake K, and Flouquet 2009 J. Phys. Soc. Japan 78 104706
- [19] Saiga Y, Sugibayashi T, and Hirashima D 2008 J. Phys. Soc. Japan 77 114710
- [20] We refer to spatially-uniform and quantum-mechanically valence-fluctuating state with as mixed valence. We refer to the state with larger than that in the mixed-valence state at the FOVT and valence crossover as the Kondo state. Note that in the intermediate-coupling regime, in the Kondo state is smaller than 1 [12, 18].
- [21] Watanabe S and Miyake K 2010 J. Phys. Soc. Japan 79 033707
- [22] Watanabe S, Tsuruta A, Miyake K, and Flouquet J 2008 Phys. Rev. Lett. 100 236401
- [23] Petrovic C, Movshovich R, Jaime M, Pagliuso P G, Hundley M F, Sarrao J L, Fisk Z, and Thompson J D 2001 Europhys. Lett. 53 354
- [24] Kawasaki S, Zheng G q, Kan H, Kitaoka Y, Shishido H, nuki 2005 Phys. Rev. Lett. 94 037007
- [25] Takeuchi T, Inoue T, Sugiyama K, Aoki D, Tokiwa Y, Haga Y, Kindo K, and nuki Y 2001 J. Phys. Soc. Japan 70 877
- [26] Kim J S, Alwood J, Kumar P, and Stewart G R 2002 Phys. Rev. B 65 174520
- [27] Palm E C, Murphy T P, Hall D, Tozer S W, Goodrich R G, and Sarrao J L 2003 Physica B 329-333 587
- [28] Capan C, Bianchi A, Ronning F, Lacerda A, Thompson J D, Hundley M F, Pagliuso P G, Sarrao J L, and Movshovich R 2004 Phys. Rev. B 70 180502
- [29] Capan C, Balicas L, Murphy T P, Palm E C, Movshovich R, Hall D, Tozer S W, Hundley M F, Bauer E D, Thompson J D, Sarrao J L, DiTusa J F, Goodrich R G and Fisk Z 2009 Phys. Rev. B 80 094518
- [30] Watanabe S and Miyake K 2010 Phys. Rev. Lett. 105 186403; see also Watanabe S and Miyake K, preprint(arXiv:0906.3986)
- [31] Haga Y, Inada Y, Harima H, Oikawa K, Murakawa M, Nakawaki H, Tokiwa Y, Aoki D, Shishido H, Ikeda S, Watanabe N, and nuki Y 2001 Phys. Rev. B 63 06503
- [32] Shishido H, Settai R, Aoki D, Ikeda S, Nakawaki H, Nakamura N, Iisuka T, Inada Y, Sugiyama K, Takeuchi T, Kindo K, Kobayashi T C, Haga Y, Harima H, Aoki Y, Namiki T, Sato H, and nuki Y 2002 J. Phys. Soc. Japan 71 162
- [33] A. D. Christianson, E. D. Bauer, J. M. Lawrence, P. S. Riseborough, N. O. Moreno, P. G. Pagliuso, J. L. Sarrao, J. D. Thompson, E. A. Goremychkin, F. R. Trouw, M. P. Hehlen, and R. J. McQueeney 2004 Phys. Rev. B 70 134505
- [34] Sidorov V A, Nicklas M, Pagliuso P G, Sarrao J L, Bang Y, Balatsky A V, and Thompson J D 2002 Phys. Rev. Lett. 89 157004
- [35] J. L. Sarrao, C. D. Immer, Z. Fisk, C. H. Booth, E. Figueroa, J. M. Lawrence, R. Modler, A. L. Cornelius, M. F. Hundley, G. H. Kwei, J. D. Thompson, and F. Bridges 1999 Phys. Rev. B 59 6855
- [36] Koyama T, Matsumoto M, Tanaka T, Ishida H, Mito T, Wada S, and Sarrao J L 2002 Phys. Rev. B 66 014420
- [37] Takeuchi T, Yasui S, Toda M, Matsushita M, Yoshiuchi S, Ohya M, Katayama K, Hirose Y, Yoshitani N, Honda F, Sugiyama K, Hagiwara M, Kindo K, Yamamoto E, Haga Y, Tanaka T, Kubo Y, Settai R, and nuki Y 2010 J. Phys. Soc. Japan 79 064609
- [38] We note that each material has different strength of c-f hybridization . Hence, the locus of the QCEP under the magnetic field depends on in Figs. 3(a) and 3(b), strictly speaking. To avoid confusion by drawing each locus (thick line with an arrow) for each material, we just drew one locus and schematic locations of CeIrIn5, YbAgCu4, and YbAuCu4, respectively, in Fig. 3(b).
- [39] Honda F, Yasui S, Yoshiuchi S, Takeuchi T, Settai R, and nuki Y 2010 J. Phys. Soc. Japan 79 in press
- [40] Ohya M, Matsushita M, Yoshiuchi S, Takeuchi T, Honda F, Settai R, Tanaka T, Kubo Y, nuki Y 2010 J. Phys. Soc. Japan 79 083601
- [41] Hegger H, Petrovic C, Moshopoulou E G, Hundley M F, Sarrao J L, Fisk Z, and Thompson J D 2000 Phys. Rev. Lett. 8 4986
- [42] Bao W, Pagliuso P G, Sarrao J L, Thompson J D, Fisk Z, Lynn J W, and Erwin R W 2003 Phys. Rev. B 67 099903
- [43] Knebel G, Aoki D, Brison J P, and Flouquet J 2008 J. Phys. Soc. Japan 77 114704
- [44] Park T, Sidorov V A, Ronning F, Zhu J-X, Tokiwa Y, Lee H, Bauer E D, Movshovich R, Sarrao J L, and Thompson J D 2008 Nature 456 366
- [45] Yashima M, Mukuda H, Kitaoka Y, Shishido H, Settai R, and nuki Y 2009 Phys. Rev. B 79 214528
- [46] Shishido H, Settai R, Harima H, and nuki Y 2005 J. Phys. Soc. Japan 74 1103
- [47] Muramatsu T, Tateiwa N, Kobayashi T C, Shimizu K, Amaya K, Aoki D, Shishido H, Haga Y, and nuki Y 2001 J. Phys. Soc. Japan 70 3362
- [48] Park T and Thompson J D 2009 New Jpurnal of Physics 11 05502
- [49] A slight difference for the value of exists in different samples: GPa in Ref. [44]
- [50] Si Q, Rabello S, Ingersent K, and Smith J L 2001 Nature 413 804
- [51] Coleman P, C, Si Q, and Ramazashvili R 2001 J. Phys.: Condens. Matter 13 R723
- [52] Kotliar G and Ruckenstein A E 1996 Phys. Rev. Lett. 57 1362
- [53] Miyake K, Matsuura T, and Varma C M 1989 Solid State Commun. 71 1149
- [54] Kuramoto Y and Miyake K 1990 J. Phys. Soc. Japan 59 2831
- [55] Pham L D, Park T, Maquilon S, Thompson J D, and Fisk Z 2006 Phys. Rev. Lett. 97 056404
- [56] Yamamoto A, Wada S, and Sarrao J L 2007 J. Phys. Soc. Japan 76 063709
- [57] Wada S, Yamamoto A, Ishida K, and Sarrao J L 2008 J. Phys.: Condens. Matter 20 175201
- [58] Gegenwart P, Westerkamp T, Krellner C, Tokiwa Y, Paschen S, Geibel C, Steglich F, Abrahams E, and Si Q 2007 Science 315 969
- [59] Gegenwart P, Steglich F, and Si Q, 2008 Nature Physics 4 186 and references therein.
- [60] Krellner C, Hartmann S, Pikul A, Oeschler N, Donath J G, Geibel C, Steglich F, and Wosnitza J 2009 Phys. Rev. Lett. 102 196402
- [61] Nakatsuji S, Kuga K, Machida Y, Tayama T, Sakakibara T, Karaki Y, Ishimoto H, Yonezawa S, Maeno Y, Pearson E, Lonzarich G G, Balicas L, Lee H, and Fisk Z 2008 Nature Physics 4 603
- [62] Okawa M, Matsunami M, Ishizaka K, Eguchi R, Taguchi M, Chainani A, Takata Y, Yabashi M, Tamasaku K, Nishino Y, Ishikawa T, Kuga K, Horie N, Nakatsuji S, and Shin S 2010 Phys. Rev. Lett. 104 247201