Kinematical and chemical vertical structure of the Galactic thick
disk††thanks: Based on observations collected at the European Organization for Astronomical Research in the Southern
Hemisphere, Chile (proposal IDs 075.B-0459(A), 077.B-0348(A)) ,††thanks: This paper includes data gathered with the
6.5-meter Magellan and the duPont Telescopes, located at Las Campanas Observatory, Chile.
I. Thick disk kinematics
Abstract
The variation of the kinematical properties of the Galactic thick disk with Galactic height are studied by means of 412 red giants observed in the direction of the south Galactic pole up to 4.5 kpc from the plane. We confirm the non-null mean radial motion toward the Galactic anticenter found by other authors, but we find that it changes sign at =3 kpc, and the proposed inward motion of the LSR alone cannot explain these observations. The rotational velocity decreases with by km s-1 kpc-1, but the data are better represented by a power-law with index 1.25, similar to that proposed from the analysis of SDSS data. All the velocity dispersions increase with , but the vertical gradients are small. The dispersions grow proportionally, with no significant variation of the anisotropy. The ratio /=2 suggests that the thick disk could have formed from a low-latitude merging event. The vertex deviation increases with Galactic height, reaching 20 degrees at =3.5 kpc. The tilt angle also increases, and the orientation of the ellipsoid in the radial-vertical plane is constantly intermediate between the alignment with the cylindrical and the spherical coordinate systems. The tilt angle at =2 kpc coincides with the expectations of MOND, but an extension of the calculations to higher is required to perform a conclusive test. Finally, between 2.5 and 3.5 kpc we detect deviations from the linear trend of many kinematical quantities, suggesting that some kinematical substructure could be present.
1 INTRODUCTION
The formation mechanism of the thick disk is one of the most noticeable grey points of our current understanding of the Galactic formation and evolution process. This uncertainty is particularly unfortunate because, being the thick disk a ubiquitous feature among spiral galaxies (Dalcanton & Bernstein, 2002; Seth et al., 2005), its formation must be a common stage in the early evolution of late-type galaxies. During the nearly three decades since its discovery (Gilmore & Reid, 1983), many models have been proposed. The merging scenario, in which the early merging of a small satellite galaxy heats a primordial Galactic disk producing an old, thick, and kinematically hot disk population (Quinn et al., 1993; Walker et al., 1996), has been the most favored model in the last decade, following the evidence that the thin and thick disks are chemically distinct (Fuhrmann, 1998; Gratton et al., 2001). Nevertheless, even this scenario is not free of problems (see, for example, Bournaud et al., 2009), and alternative models have recently been drawn to attention (e.g., Bournaud et al., 2009; Schönrich & Binney, 2009; Ros̆kar et al., 2008; Assmann et al., 2011).
It is clear that the general properties of the Galactic thick disk, such as its mean metallicity or mean kinematics, are not enough to distinguish between the models proposed for its formation. Moreover, the merging scenario has many free parameters, such as the mass of the merging satellite and the inclination of its orbit with respect to the Galactic disk, and the observations must constrain them if the quality of the model is to be finally assessed. In the last few years, theoretical simulations have started to cast predictions of the stellar distribution of stars in the multi-dimensional spatial-kinematical-chemical space (e.g., Loebman et al., 2011; Kobayashi & Nakasato, 2011). For example, Gómez et al. (2011) have shown that, within the merging scenario, the time of impact, and the mass and orbit of the infalling satellite can be deduced from the distribution of the expected kinematical clumps in the – plane, while Villalobos & Helmi (2008, 2009), Villalobos et al. (2010), and Purcell et al. (2009) find that the / ratio and its variation with Galactocentric distance are excellent indicators of the inclination angle of the merging event. Villalobos & Helmi (2008) and Bekki & Tsujimoto (2011) have also shown that the observed decrease of rotation velocity with distance from the plane points to a low-latitude merging. At the same time, the observations are gathering information about the spatial variations of the chemical composition and velocity distribution (e.g. Ivezic et al., 2008; Fuchs et al., 2009; Bond et al., 2010; Casetti-Dinescu et al., 2011). Detailed results of this kind are strongly needed because, through comparison with the expectations from the different models, they can be key to solve the puzzle of the Galactic thick disk formation.
We are undertaking an extensive survey aimed to reveal the kinematical and chemical vertical structure of the Galactic thick disk (Carraro et al., 2005). Preliminary kinematical results were presented by Moni Bidin et al. (2008) and Moni Bidin (2009), while the sample was also used to investigate the Galactic dark disk (Moni Bidin et al., 2010), and Lithium-rich stars in the Galactic thick disk (Monaco et al., 2011). In this paper, we focus on the kinematical results, studying the trend of kinematical quantities as a function of distance from the Galactic plane. In later papers of this series, the collected spectra will be used to measure the metallicity and chemical abundances of the sample, to study the variation of the thick disk chemistry with Galactic height.
2 THE SAMPLE
Our investigation is based on the sample of 1200 red giants defined by Girard et al. (2006), vertically distributed with respect to the Galactic plane in a cone of fifteen degrees radius centered on the South Galactic Pole. The sample covers a large range of Galactic heights, from the plane to 5 kpc, and it is volume-complete up to =3 kpc. All the objects have 2MASS photometry (Skrutskie et al., 2006), and absolute proper motions from the SPM3 catalog (Girard et al., 2004). The sample was defined by the color cut 0.71.1, to isolate intermediate-metallicity stars. Main Sequence (MS) dwarfs were excluded both by a sloped cut at fainter magnitudes, parallel to the MS, which excludes all but the nearest (d63 pc) dwarfs, and by conservative kinematical criteria imposing a stellar velocity lower than the local escape velocity (see Girard et al., 2006, for more details).
| Run | Date | N. nights | Instrument | N. stars |
|---|---|---|---|---|
| Coralie1 | 2005, September | 4 | Coralie@Euler | 39 |
| FEROS1 | 2005, September | 6 | FEROS@2.2 | 183 |
| duPont1 | 2005, October | 6 | Echelle@duPont | 168 |
| Coralie2 | 2005, October | 3 | Coralie@Euler | 25 |
| FEROS2 | 2006, August | 6 | FEROS@2.2 | 161 |
| duPont2 | 2006, September | 6 | Echelle@duPont | 119 |
| MIKE1 | 2006, Aug.–Nov. | 5x0.5 | MIKE@Magellan | 77 |
| MIKE2 | 2007, October | 2 | MIKE@Magellan | 52 |
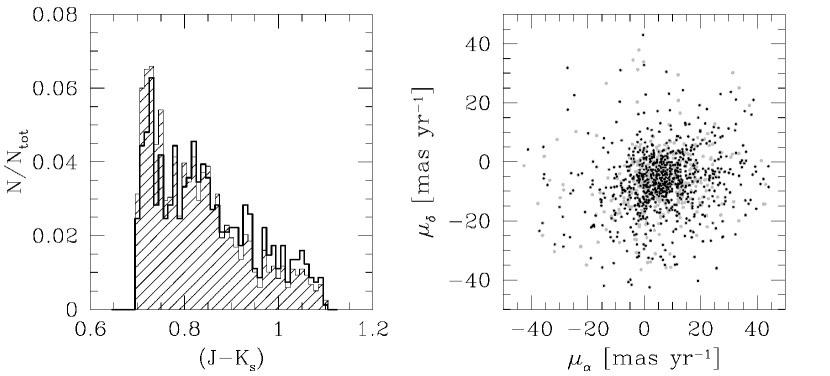
We collected high-resolution Echelle spectra for two-thirds of the Girard et al.’s sample (824 stars). All the stars in the brighter half of the sample were spectroscopically observed, while the completeness decreases with magnitude for fainter objects. We found a high contamination (35%) by nearby dwarf in the faintest end of the distribution, hence stars with were given lower priority after the first observations. The distribution of proper motions and colors of the observed sub-sample is shown in Figure 1. The comparison with the complete sample reveals that no selection effect was introduced: the slight overabundance of red stars in the observed sample is due to the higher completeness at brighter magnitudes, where stars are on average redder.
As discussed later, we will restrict our investigation to stars with Galactic height 1.3 kpc, to avoid a strong thin disk contamination. This reduced the sample under study to 514 stars. We visually inspected all the spectra, identifying 46 probable dwarf stars. As expected, they show on average low radial velocities but high U and V components, and only one is found at 9. We also found 22 stars with [Fe/H]1.5, as deduced from comparisons with synthetic spectra. They were considered probable halo contaminants and were excluded from further analysis. We note that the metal-poor tail of the thick disk extends to much lower metallicities (Beers & Sommer-Larsen, 1995), but below this limit thick disk stars are outnumbered by halo members by a factor of nearly ten (Chiba & Beers, 2000). Finally, we also excluded from analysis 34 stars that, in the Galactic cylindrical coordinate system, had velocity components (defined in Section 4.2) outside the range U300 km s-1, V300 km s-1, and W150 km s-1. The cut in was aimed to remove the residual halo contamination, while the other components were restricted to exclude stars with wrong distance or bad proper motion. The cut in was offset toward negative values to take into account the vertical shear (see Section 5.1). Our final sample thus comprised 412 stars.
2.1 Distances
The interstellar reddening E() was derived for each target from the Schlegel et al. (1998) maps, and the magnitude and () color were de-reddened by means of the transformations of Cardelli et al. (1989). The distance to each star was then estimated through a color-absolute magnitude relation calibrated on 47 Tucanae, a disk globular cluster (Zinn, 1985) whose stellar population is very similar to the Galactic thick disk both in age and metallicity (Wyse & Gilmore, 2005). The fit of the cluster red giant branch yields the relation (L. Miller 2008, priv. comm.):
| (1) |
which were translated into absolute magnitude and de-reddened color assuming =13.500.08 and E()=0.0240.004 for the cluster distance modulus and reddening, respectively (Gratton et al., 2003).
Inspecting the 2MASS photometric data of 47 Tuc used to derive Equation (1), we found that the uncertainty on is of the order of 0.2 magnitudes. This is only a marginal contribution to the final error in distance, because the main source of uncertainty is the relatively wide range of age and metallicity covered by thick disk stars. Indeed, the 2MASS photometric errors have only negligible impact, because they do not exceed 0.03 magnitudes for our fainter targets (10.6). We estimated the effect of the age and metallicity distribution on the derived absolute magnitudes by means of Yale-Yonsei isochrones (Yi et al., 2003). We assumed a scatter of 0.3 dex in metallicity, that should include the bulk of thick disk stars (Carney et al., 1989) when excluding the scarcely-populated low- and high- metallicity tails (Beers & Sommer-Larsen, 1995; Bensby et al., 2007), and a scatter of 2 Gyr in age (Bensby et al., 2003; Feltzing et al., 2003; Reddy et al., 2006). They were considered uncorrelated, because the age-metallicity relation for the thick disk is very weak (Bensby et al., 2007). We finally estimated the error on distance to be 20%, quadratically summing all the relevant contributions.
Thin disk stars do not follow the age and metallicity distribution assumed to derive Equation (1), and their distances should be systematically biased. Indeed, younger, more metal-rich red giants are intrinsically fainter than our estimate. Comparing the absolute magnitudes calculated from Equation (1) with Yale-Yonsei isochrones between 2 and 8 Gyr, and metallicity following the age-metallicity relation of Haywood (2001) and Rocha-Pinto et al. (2000), we found that the distance of thin disk stars would be overestimated by 10–20%. This systematic error is small, but it has a relevant consequence on the contamination of the sample, which is artificially stretched to larger heights from the plane.
2.2 Thin disk contamination

Our sample is contaminated by the thin disk, because the targets were selected through a color cut that efficiently eliminates low-metallicity stars, but which excludes only a small fraction of metal-rich objects, as it can be deduced from Figure 1 of Girard et al. (2006). In Figure 2 we plot an estimate of the fraction of thin disk stars in the sample, assuming 300 and 900 pc as thin and thick disk scale height, respectively, and a thick disk local normalization of 12% (Jurić et al., 2008). We also calculated the contamination in the case of a distance overestimate of 15% for thin disk objects. The curves can be considered an upper limit, because the color cut, unaccounted for in the calculation, could have removed part of the contamination. In the same figure we indicate the results of a rough empirical estimate, obtained fitting a double Gaussian to the distribution of the vertical velocity component () in five bins of 50 stars. The dispersions of the two Gaussian components were kept fixed, and the only free parameter of the fit was the number of thin disk stars in the bin. The error bars show the results when varying in the range 14-16 and 35-40 km s-1 for the thin and the thick disk, respectively. This test was performed only for 1-2 kpc, where both populations contribute by more than 20% of the objects, i.e. 10 stars in each bin. The empirical errorbars agree well with the curve obtained when the distance bias is considered, although the observed contamination fall-off with seems steeper than the modeled one.
In conclusion, our sample is contaminated by thin disk stars, whose distances are overestimated. This affects even the estimate of their kinematics, which is also biased. Therefore, we will not analyze the results for the thin disk, and we will limit our study to 1.3 kpc, to avoid the strong contamination (50%) of the nearest subsample.
2.3 Halo contamination
Girard et al. (2006) estimated that the halo contamination in the sample should be about 8%, hence we would expect 41 halo members among the 514 targets with 1.3 kpc. The cut in removed 10 probable halo contaminants and, according to the statistics of Chiba & Beers (2000), 18 of the excluded low-metallicity targets are expected to be halo stars. The cuts in and could also have removed some halo objects, but the effect of this cut is harder to quantify, because an unknown fraction of the outliers are probably objects with problematic proper motion or wrong distance. The residual halo contamination in our sample of 412 targets should therefore be lower than 3% (13 stars), and it can be safely neglected.
3 OBSERVATIONS AND DATA REDUCTION
The spectra were collected during six observing runs between 2005 and 2007, at La Silla and Las Campanas observatories. The details of the observations and data reduction were presented in Moni Bidin (2009), and we will outline here only the most relevant points. Four different telescopes were used, because the stars span a wide range in magnitude (=5–16), but the instruments had similar characteristics. The basic information of the runs is given in Table 1. The spectra covered the whole visual range from the atmospheric cutoff on the blue side to 9000 Å, except for Coralie data which only reached 6800 Å on the red edge. We did not reduce the spectra collected with the MIKE blue arm because of too low stellar flux, and MIKE data were thus limited to 4850 Å on the blue end. The spectral resolution varied between 32 000 and 50 000, depending on the spectrograph. In particular, the 07 slit was always used for MIKE runs (R=32 000), while at duPont both the 075 and 1 slits were used (R=40 000 and 30 000, respectively), depending on weather conditions. During each run we secured the spectra of up to seventeen bright stars with accurate parameters from the literature (radial and rotational velocities, temperature, gravity, metallicity). Exposure times were chosen according to weather conditions, to reach S/N=70–100 for all the targets. Comparison lamp arcs were acquired only during daytime calibrations for the fiber spectrographs Coralie and FEROS. The second fiber of these two instruments was allocated to the sky background, because the spectra were usually collected next to full moon. Lamp arcs were collected at intervals of about 2 hours during duPont and MIKE runs, and each spectrum was calibrated with the average of the two lamps temporally enclosing it, linearly weighted by the temporal distance between science and calibration frames.
Spectra were reduced with standard IRAF111IRAF is distributed by the National Optical Astronomy Observatories, which are operated by the Association of Universities for Research in Astronomy, Inc., under cooperative agreement with the National Science Foundation. tasks, and we kept the procedures as much as possible identical for all the data. We a posteriori verified that the reduced FEROS and Coralie spectra were of the same quality as the products of their dedicated pipelines. We analyzed the dark frames collected for all the runs, but we always found a negligible instrumental dark current and no clear 2D pattern, hence no dark correction was applied. The wavelength calibration lamp spectra were extracted in the same position on the CCD as science targets, to avoid systematics introduced by the curvature of the orders. The spectrum of a bright, well-exposed star was used to trace the orders on the CCD in each observing night, allowing only for rigid shifts among the frames. Then, the spectra were extracted with an optimum extraction algorithm (Horne, 1986), normalized, and finally merged.
4 MEASUREMENTS
4.1 Radial velocities
The radial velocity (RV) for all the targets was measured with a cross-correlation (CC) technique (Tonry & Davis, 1979) as implemented in the IRAF fxcor task. The procedure was described in detail in Moni Bidin (2009), and we give only a brief summary here. The spectrum of each star was cross-correlated with three template stars observed in the same run, namely HD 180540, HD 223559, and HD 213893 (this last replaced by HD 224834 for Coralie data), encompassing the temperature range of the targets. Their RV was fixed by a CC with a synthetic spectrum generated with the SPECTRUM222http://www.phys.appstate.edu/spectrum/spectrum.html code (Gray & Corbally, 1994), because we found poor agreement between the available literature sources. The analysis of the seventeen standard stars acquired during observations, and of the solar spectra collected each night, revealed that the RV zero-point thus defined was biased by 0.3-0.7 km s-1, depending on the instrument, and this offset was removed.
The three measurements were averaged, although they never differed by more than 0.2 km s-1. The CC was restricted to the range 4600-6800 Å (5000-6800 Å for MIKE data), to avoid the poor-quality blue section and the telluric bands at longer wavelengths. All RVs were corrected to heliocentric velocities, then the position of the telluric band at 6875 Å was used to correct the RVs for instrumental effects, mainly caused by a displacement on CCD between the lamp and science spectra, and an off-center position of the star inside the slit (see, for example, the analysis of Moni Bidin et al., 2006). Corrections of up to 2 km s-1 were applied, but with little scatter (0.5 km s-1) within each observing night.
The final RV errors were estimated as the quadratic sum of the five relevant uncertainties introduced in the procedure: the CC and wavelength calibration error, the uncertainty on the zero-point and its offset, and the error on the estimate of the correction for instrumental effects. The resulting errors were typically in the range 0.4-0.7 km s-1. The final RVs of all the 824 stars will be made available at the CDS website333http://cdsweb.u-strasbg.fr/.
| Reference | N. stars | |
|---|---|---|
| km s-1 | ||
| Flynn & Freeman (1993) | 145 | 0.82.5 |
| Zwitter et al. (2008) | 9 | 1.5 |
| Beers & Sommer-Larsen (1995) | 9 | 0.41.8 |
| Majewski et al. (2004) | 8 | 2.1 |
| Duflot et al. (1995) | 6 | 3.8 |
| Jones (1972) | 6 | 0.9 |
| Evans (1970) | 6 | 1.84.2 |
We found 211 previous RV measurements for the stars in our sample. Our results agree excellently with literature sources: the mean difference (in the sense oursliterature) is 0.42.7 km s-1, where the uncertainty is the rms of the differences. The comparison with the works that share with us more than five stars in common is given in Table 2. The mean RV difference is always of the order of 1 km s-1, except for Majewski et al. (2004), whose RVs are higher than ours by a non-negligible amount (5 km s-1). However, the number of stars in common is too small to conclude that this offset is significant.
4.2 Galactic velocities
The proper motion, radial velocity, and distance of each target were combined to derive its () velocity components in the Galactic cylindrical reference frame, where is positive toward the Galactic center, is directed in the sense of Galactic rotation, and points toward the North Galactic Pole. The error on these velocities was derived propagating the uncertainty on the observed quantities. We assumed a proper motion error of 3 mas yr-1 for all the stars, as this value is more realistic than the uncertainties quoted in the SPM3 catalog (T. Girard, 2009, priv. comm.; see also Girard et al. 2006). The velocities were corrected subtracting the solar peculiar motion ()=(10.0, 5.1, 7.2) km s-1 (Dehnen & Binney, 1998). Schönrich et al. (2010) recently proposed the revised values ()=(11.0, 12.2, 7.3) km s-1, but we preferred to adopt the older ones, for sake of continuity with previous works. In any case, the definition of the solar motion does not affect the velocity dispersions nor the off-diagonal terms of the dispersion matrix (Equation 2), while the effects on the mean values are discussed in Section 5.1.
The sample was then divided into several bins, in which we calculated the mean velocities, the dispersions (), and the non-diagonal terms of the dispersion matrix
| (2) |
where the sum is extended to all the stars in the bin, and . The results are given in Table 3. The bins were defined by the requirement that their centers were equally spaced by 0.1 kpc from =1.5 to 4.5 kpc, to uniformly sample the variation with of the kinematical quantities, while the width was imposed by the fixed number of stars per bin (see below). This implied a partial overlap of the bins, increasing with distance from the plane due to the decreasing density of observed stars. However, Moni Bidin et al. (2010) have shown that the binning definition does not alter the results, and in fact our results are very similar to that work, despite the very different binning schemes. The bins with 2.4 kpc comprised 50 stars each, while at lower heights, where the number of observed stars is larger, the bin size was increased to 80 targets for 2.12.4 kpc, and 100 targets for 2.1 kpc. We thus ensured a good statistic of thick disk stars in bins contaminated by the thin disk.

In each bin, the mean value and dispersion of each velocity component were measured by means of the analysis of the corresponding probability plot (Hamaker, 1978; Lutz & Hanson, 1992). This powerful tool is highly insensitive to outliers, and it can be employed even in case of poorly populated bins. The data are first ordered with increasing value of the velocity. Each point is then assigned a value , equal to the deviation from the mean expected for the point of a normal distribution, in units of the standard deviation. When the underlying distribution is Gaussian, the data follow a linear relation in the -velocity plane, whose intercept and slope are given by the mean value and the dispersion, respectively. The probability plots were fitted with a straight line, weighting each data point by its error, two examples are shown in Figure 3. The intrinsic velocity dispersions were then obtained quadratically subtracting the mean velocity error in the bin. The wings of the distribution showing any deviation from linearity were excluded from the fit, suspected to be affected by objects with wrong distance or problematic proper motion, or by residual halo members.
The analysis of artificial data samples, generated through Monte-Carlo simulations and analyzed as the real data, indicated that the velocity dispersion is underestimated by 1-2 km s-1 when the thin disk contamination approaches 10%. The contamination was therefore neglected for 2.5 kpc, where it is expected to be lower than 5% (i.e. two stars per bin, see Figure 2). Following Bochanski et al. (2007), in the presence of a non-negligible thin disk contamination (2.5 kpc) we derived the mean velocity and the dispersion of thick disk stars fitting only the wings of the probability plot, and only the negative one for . The cut excluded the ranges U50 km s-1, W30 km s-1, and 60 km s-1, approximatively 1.5 times the expected thin disk dispersion, thus removing about 90% of the contaminants. The two wings of the probability plot should have the same slope but a different intercept, and the mean velocity was obtained averaging the two intercepts obtained from the fit. Although the mean values thus derived agree well with the trends observed in the contamination-free bins at higher , we regard them as less reliable.
The formal errors of the least-square procedure used to obtain the intercept and the slope in the probability plots mainly indicate the deviations from Gaussianity of the observed distribution. Hence, they are not a good estimate of the real uncertainties. The errors were therefore derived by means of Monte-Carlo simulations. For each bin, we generated one thousand artificial samples of 50 stars, changing the proper motion, distance, and RV of each star assuming a Gaussian random noise with dispersion equal to the estimated errors (3 mas yr-1, 20%, and 0.4-0.7 km s-1, respectively). The measurements were repeated in each artificial bin as done for the real data, and the dispersion of these artificial measurements was assumed as an estimate of the observational errors. The final errors are given in Table 3.
The non-diagonal terms of the dispersion matrix, , , and , were calculated by means of Equation 2. The errors were estimated from Monte-Carlo simulations, as done for the velocity dispersions. For each bin, one thousand artificial data sets of 50 values were simulated, drawn from a distribution characterized by the same dispersion matrix as the real data. In each simulation, a Gaussian random noise with a dispersion equal to the observational errors was added, and the non-diagonal terms were estimated by means of Equation 2. The errors were defined by the scatter of these simulated measurements. With the same simulations we also evaluated the systematic error introduced by the observational uncertainties (e.g. Siebert et al., 2008), comparing the results when the random noise was considered or not. We found that the expected systematic thus introduced is negligible, being about one order of magnitude lower than the uncertainties on the measured values. Therefore, we did not correct the observed non-diagonal terms for observational errors.
| kpc | km s-1 | km s-1 | km s-1 | km s-1 | km s-1 | km s-1 | km2 s-2 | km2 s-2 | km2 s-2 |
|---|---|---|---|---|---|---|---|---|---|
| 1.5 | 314 | 464 | 171 | 815 | 575 | 381 | 570310 | 400470 | 10210 |
| 1.6 | 204 | 554 | 51 | 775 | 595 | 371 | 840290 | 180460 | 20220 |
| 1.7 | 284 | 615 | 31 | 795 | 645 | 381 | 930310 | 130510 | 40250 |
| 1.8 | 244 | 695 | 81 | 795 | 616 | 401 | 810330 | 760500 | 80240 |
| 1.9 | 164 | 775 | 31 | 785 | 605 | 401 | 850330 | 1060500 | 120240 |
| 2.0 | 105 | 854 | 41 | 836 | 556 | 391 | 940340 | 30460 | 90210 |
| 2.1 | 225 | 785 | 31 | 806 | 586 | 381 | 1060320 | 470470 | 130220 |
| 2.2 | 165 | 767 | 131 | 776 | 637 | 421 | 690330 | 0550 | 230260 |
| 2.3 | 16 | 815 | 91 | 817 | 586 | 401 | 750340 | 500470 | 10230 |
| 2.4 | 125 | 856 | 121 | 806 | 596 | 401 | 410330 | 710480 | 180240 |
| 2.5 | 186 | 856 | 21 | 787 | 637 | 421 | 630330 | 1870600 | 40270 |
| 2.6 | 256 | 906 | 11 | 717 | 667 | 421 | 530310 | 2390660 | 460290 |
| 2.7 | 236 | 986 | 71 | 727 | 627 | 391 | 870290 | 1150520 | 1360300 |
| 2.8 | 296 | 957 | 21 | 767 | 627 | 411 | 880320 | 1740580 | 1310300 |
| 2.9 | 176 | 1157 | 51 | 837 | 687 | 401 | 840340 | 820590 | 1230300 |
| 3.0 | 76 | 1267 | 81 | 907 | 678 | 421 | 1440410 | 50610 | 460280 |
| 3.1 | 67 | 1298 | 11 | 1018 | 678 | 431 | 1610450 | 1150690 | 650290 |
| 3.2 | 26 | 1318 | 11 | 998 | 638 | 421 | 1470440 | 1820650 | 440280 |
| 3.3 | 87 | 1408 | 01 | 1018 | 668 | 442 | 2180490 | 2610740 | 310300 |
| 3.4 | 127 | 1408 | 11 | 988 | 639 | 432 | 2100480 | 1880660 | 260280 |
| 3.5 | 187 | 1359 | 51 | 959 | 639 | 442 | 1950460 | 3390740 | 260280 |
| 3.6 | 297 | 1378 | 91 | 1019 | 649 | 442 | 2290510 | 2170700 | 360290 |
| 3.7 | 77 | 1329 | 02 | 919 | 6110 | 442 | 2180460 | 2150610 | 610280 |
| 3.8 | 157 | 13410 | 12 | 929 | 6810 | 432 | 1990450 | 2120700 | 30300 |
| 3.9 | 58 | 1399 | 62 | 9410 | 6610 | 432 | 1540430 | 520620 | 210280 |
| 4.0 | 78 | 14310 | 12 | 939 | 6611 | 412 | 1910420 | 100610 | 10280 |
| 4.1 | 178 | 14510 | 12 | 9210 | 6810 | 442 | 1570440 | 720640 | 30300 |
| 4.2 | 228 | 14211 | 22 | 9510 | 7211 | 452 | 1480460 | 880710 | 10320 |
| 4.3 | 129 | 14810 | 22 | 9410 | 6911 | 482 | 2320510 | 1170680 | 180330 |
| 4.4 | 179 | 15211 | 02 | 9610 | 7211 | 462 | 2330500 | 1370710 | 50330 |
| 4.5 | 1910 | 15811 | 22 | 9311 | 7611 | 462 | 2180480 | 3960930 | 240360 |
5 RESULTS
5.1 Mean velocities

The trend of the mean velocities with distance from the plane is shown in Figure 4. is consistent with no significant departure from zero in the whole range. Some deviations are observed for 2.5 kpc, but in this range the results are affected by large errors and, as already commented, not very trustworthy. This result agrees with previous studies, that found no net vertical motion up to various kpc from the Galactic plane (Bochanski et al., 2007; Bond et al., 2010; Casetti-Dinescu et al., 2011). On the contrary, has a more complex behavior: between =1.5 and 3 kpc we detect a non-null mean velocity directed toward the Galactic anticenter, with an average value =3 km s-1. Beyond 3 kpc from the plane abruptly increases and changes sign, and the net velocity between 3.5 and 4.5 kpc is 152 km s-1 toward the Galactic center. Another possible interpretation of the results is that linearly increases with , and a S-shaped feature is superimposed to this trend between 2.5 and 3.5 kpc, as observed for and other kinematical quantities (see Section 5.5). After the exclusion of this range, the fit returns a vertical increase of 15 km s-1 kpc-1. Adopting the new values of Schönrich et al. (2010) for the solar peculiar motion causes not a relevant change on the results, as would be higher by about 1 km s-1 only.
Previous studies have shown evidence that stars more distant than 1 kpc from the plane show a non-null net radial motion of the order of 9 km s-1 toward the Galactic anticenter (Smith et al., 2009; Rybka & Yatsenko, 2010; Casetti-Dinescu et al., 2011). Our results between =1.5 and 3 kpc agree with their conclusion, although our mean value is larger by about a factor of two. The sign flip observed at larger , on the contrary, has never been reported in the literature. Nevertheless, Smith et al. (2009) analyze halo stars, Rybka & Yatsenko (2010) do not reach these heights above the plane, and Casetti-Dinescu et al. (2011) have too few stars in this range. Very interestingly, Bond et al. (2010) detect a small positive mean radial component out to kpc, and a negative value in their more distant bins, although the authors conclude that these results are consistent, within errors, with a null net motion. Casetti-Dinescu et al. (2011) proposed that an inward motion of the Local Standard of Rest (LSR) of the order of 10 km s-1 is responsible for the observed non-null mean value of , as suggested by the fact that this is observed among both disk and halo stars more distant than 1 kpc from the sun. This hypothesis cannot account for any vertical trend of other than a constant non-zero value at any . Thus, while it is not contradicted by our results, at least another effect must be invoked. For example, an outward motion of 25 km s-1 of the stars between 3.5 and 4.5 kpc, coupled with the mentioned LSR motion, could explain our results. This clumpy kinematical distribution would not be surprising, because perturbations produced by the bar and the spiral arms are expected to form groups of stars with velocity offset as large as 50 km s-1 (Quillen et al., 2010).
Girard et al. (2006) studied the proper motions of our same stellar sample, and their results for are overplotted to ours in the upper panel of Figure 4, after correcting for the solar peculiar motion and changing the sign of to account for the different direction of the reference axis. The agreement with our results is poor: while their nearly flat profile roughly coincides with our mean value (7.7 km s-1), they did not detect any change of sign, nor a steep positive gradient. The different approach to the same data must have caused the different results. For example the features observed by us could have been masked in Girard et al. (2006) by their smoothed, statistical distance determination, or by dwarf stars and halo contaminants, removed in our work.

In the middle panel of Figure 4 we show the measured trend of , compared to other results from the literature. The mean rotational velocity of thick disk stars decreases with distance from the plane, due to the well-known vertical shear first detected by Majewski (1992). The fit of the data, after the exclusion of the less reliable bins at 2.5 kpc, yields (km s-1). As can be seen in Figure 4, this solution excellently matches the results of Girard et al. (2006), and even the data points of Chiba & Beers (2000), at kpc, are well aligned with the derived linear relation. Both these investigations measure a vertical shear of 30 km s-1 kpc-1, as also recently found by Brown et al. (2008), and Bond et al. (2010). Had we fitted all the data points down to =1.5 kpc, we would have found a steeper slope ( km s-1 kpc-1), at the upper limit of the range spanned by literature values, which vary from 4 (Allende Prieto et al., 2006) to 1 km s-1 (Carollo et al., 2010). The revised values for the solar peculiar motion proposed by Schönrich et al. (2010) cause an upward revision of the results by 7.1 km s-1.
Casetti-Dinescu et al. (2011) and Spagna et al. (2010) measured a shallower slope (2.1 and 2 km s-1 kpc-1, respectively) between 0.7 and 2.8 kpc. While our results are compatible with theirs in our nearest bins, we find a lower mean rotational velocity beyond =2 kpc. Nevertheless, the different vertical rotational gradient found by these studies is not necessarily a disagreement, because they sample a different -range, and the underlying shear is not required to be strictly linear. In fact, Ivezic et al. (2008) have proposed the non-linear relation km s-1 from the analysis of SDSS data. The combined data points of Chiba & Beers (2000), Spagna et al. (2010), Casetti-Dinescu et al. (2011), and of the present work, closely follow this equation (see Figure 5), and a fit in the form km s-1 returns a very similar solution, with km s-1, km s-1 kpc-1, and 1.23. Very noticeably, the results of four surveys finding a different linear relation are all well reproduced by a single non-linear curve proposed by an independent work. The underlying vertical trend of the thick disk rotational velocity is therefore most probably close to but not exactly linear, and better represented by a low-order power law.
5.2 Velocity dispersions

The vertical profile of the velocity dispersions is shown in Figure 6, compared to other works from the literature. We excluded from comparison the results of Bond et al. (2010), because they do not distinguish between different disk components, thus finding steeper gradients as a result of the mix of thin and thick disk stars. Caution must also be taken when comparing the results obtained in different ranges of , because the underlying trend of the dispersions is not necessarily linear, and the gradient can assume different values. For example, the models of Girard et al. (2006) indicate that the vertical profile should be progressively flatter at increasing .
The linear fit of the trends with yields:
| (3) |
| (4) |
| (5) |
where is in kpc. The quoted errors were obtained restricting the fit to a subset of eight non-overlapping bins, to avoid the underestimate induced by the correlation between the data points. The results are identical to those of Moni Bidin et al. (2010), despite the different binning scheme, except for for which we derive a slightly smaller gradient, but the difference is not significant (0.4 km s-1 kpc-1). The gradients are small, and the three dispersions increase by only 7% between 2.5 and 3.5 kpc. This explains why the change of the thick disk kinematics with distance from the plane has not been clearly detected for about two decades after its discovery.
The results for are the most precise and reliable, because 90% of the information on comes from RVs, whose errors are an order of magnitude smaller than those in proper motions. shows a small but clear and constant increase, with small scatter around the derived linear relation. The vertical gradient is smaller than the one found by Casetti-Dinescu et al. (2011) by about a factor of two, but the results are consistent at the 1 level. Yoss et al. (1987) propose an even steeper profile (10 km s-1 kpc-1) in the range =0–2 kpc, but the same authors suspect that this could be due to contamination by halo stars increasing with Galactic height.
The dispersion of the rotational velocity component, , also shows a clear increase with , although the data points are affected by larger errors and are more scattered. The vertical gradient is smaller than the results of both Casetti-Dinescu et al. (2011) and Girard et al. (2006), by a factor of three and two, respectively, and the difference is at the 2 level in both cases.
The vertical profile of shows a very peculiar behavior, with large deviations from linearity between 2.5 and 3.5 kpc. This feature will be discussed in Section 5.5. Outside this range, the data points closely follow a linear relation, and the solution given in Equation 3 was obtained excluding this interval from the fit. The derived vertical gradient of is very similar to that found by Girard et al. (2006), but their solution is offset toward higher values by about 10 km s-1, while the gradient measured by Casetti-Dinescu et al. (2011) is 4 times higher than ours.
In conclusion, we confirm that the velocity dispersions of the Galactic thick disk increase with distance from the plane, as suggested by previous investigations (Yoss et al., 1987; Yoss & Griffin, 1997; Soubiran et al., 2003; Girard et al., 2006; Ivezic et al., 2008; Casetti-Dinescu et al., 2011), but we derive vertical gradients that are in general smaller than other studies. The differences with Casetti-Dinescu et al. (2011) can be at least in part due to the aforementioned expected decrease of the gradient with distance from the plane, because the results for are consistent, and the solutions proposed for the other two components overlap in the -range in common (1.5–2.2 kpc). On the contrary, Girard et al. (2006) studied our same sample, and the different data analysis must be the cause of the disagreement. Since they measured both higher dispersions and steeper vertical gradients than us, their results could have been affected by the dwarf stars and halo contaminators removed by us, and/or the thin disk contamination, that they did not take into account.

The three dispersions increase with distance from the plane proportionally, and the anisotropy is approximatively constant at all . In Figure 7 the vertical profile of the ratios / and / is shown, where the errors come from propagation of the uncertainties on the dispersions.
The mean value of / is 2.080.06, where the error was estimated from the statistical error on the mean for eight uncorrelated bins, as before. The linear fit of the data points returns a negligible gradient (0.090.07 kpc-1), and the data are consistent with a flat profile. Literature values for / span a wide range from 1.1 (Veltz et al., 2008) to 1.9 (e.g., Vallenari et al., 2006), and our results are at the upper end of this distribution. As shown in the upper panel of Figure 7, the results of Casetti-Dinescu et al. (2011) agree with our measurements in the Z-range in common, but they deviate from our measurements if extrapolated to higher distance from the plane.
The results for / also show no significant gradient (0.060.05 kpc-1) and a mean value of 1.360.05. This is lower than the value predicted by the epicyclic approximation (1.49, cfr. Equation 3-76 of Binney & Merrifield, 1998), indicating that the population under analysis cannot be assumed in nearly circular orbits. Our results are well within the range spanned by literature values, which vary from 1 (e.g., Chiba & Beers, 2000; Carollo et al., 2010), to 1.6 (Soubiran et al., 2003). As in the case of /, the results of Casetti-Dinescu et al. (2011) overlap with our data points in the range in common, but their extrapolation to higher do not. The analytical expressions given by Girard et al. (2006) for and , on the contrary, return a value of their ratio much lower than our data points at any Galactic height. This is probably due to their much higher , as shown in the middle panel of Figure 6.
5.3 Orientation of the dispersion ellipsoid

The non-diagonal term of the dispersion matrix gives a measurement of the correlation between the -th and -th velocity components. In fact, if two principal axis of the dispersion ellipsoid are aligned with the -th and -th axis, we have =0, and the two velocity components are uncorrelated. The orientation of the dispersion ellipsoid of an old, dynamically relaxed population is related to the shape of the Galactic potential (Lynden-Bell, 1962; Ollongren, 1962; Hori & Liu, 1963), and can indicate the presence of non-axisymmetric structures in the disk (Kuijken & Tremaine, 1991). Moreover, Bienaymé (2009) and Siebert et al. (2008) have shown that the vertical tilt of the ellipsoid allows to estimate the flattening of the dark halo. However, calculating the expectation of a specific halo model through integration of orbits is beyond the scope of the paper, and here we will only present the observational results, for use of future works.
Our results for the three cross-terms are shown in Figure 8. The profile of closely follows a decreasing linear relation up to =4 kpc, but abruptly jumps to positive values at larger heights. This is probably due to the sign flip of analyzed in Section 5.5. In any case, the results indicate that the and velocity components are correlated, and the velocity ellipsoid is titled in the radial-longitudinal plane. The rotation angle, i.e. the vertex deviation , was calculated in each bin by means of the relation:
| (6) |
(Amendt & Cuddeford, 1991). The results are shown in the upper panel of Figure 9. We measure a non-negligible vertex deviation, increasing from nearly zero at =1.5 kpc to at 3.5 kpc. The linear fit in the range 1.5–4 kpc yields the relation . Our results agree with Casetti-Dinescu et al. (2011), who measured at =1.1 kpc. Previous investigations evidenced that the vertex deviation decreases from for young populations to nearly zero for old, metal-poor disk stars (Bienaymé, 1999; Dehnen & Binney, 1998; Soubiran et al., 2003; Fuchs et al., 2009). Our results are not at variance with this conclusion if the vertex deviation increases with , as suggested by our observations, because previous studies were limited to small Galactic heights.
shows no significant deviation from zero in the whole range of , except between 2.5 and 3.5 kpc, as discussed in Section 5.5. This indicates that the and velocity components are not correlated. On the contrary, is significantly different from zero, and steadily increases with . Proposing a reliable linear expression for is not straightforward, because it shows irregular fluctuations. As expected by Binney & Spergel (1983) and Binney & Merrifield (1998), is always bound between zero and , the value assumed when the velocity ellipsoid is aligned with the spherical coordinate system, because we find that km2 s-2 at any Galactic height. We also find that the expression proposed by Kuijken & Gilmore (1989), obtained under the assumption that the ellipsoid points toward the Galactic center and its axis ratio is constant in the spherical coordinate system, is a relatively good approximation of the measured value up to about 3 kpc from the plane, but the predicted slope is too shallow and the agreement with observations degrades with (see Figure 8).

The tilt angle in the - plane can be calculated, analogously to the vertex deviation, from the Equation:
| (7) |
and the results are shown in Figure 9. We measure a slight increase of with , and the linear fit of the data, after the exclusion of two deviating points, yields the relation . The results agree with previous works at =1–1.5 kpc (Siebert et al., 2008; Carollo et al., 2010; Casetti-Dinescu et al., 2011), but not with the measurements of Fuchs et al. (2009) at 1 kpc, whose sample is most probably dominated by thin disk stars. The dashed curve in Figure 9 indicates the value of when the dispersion ellipsoid points toward the Galactic center, assuming R⊙=8 kpc. The tilt angle is constantly lower than this in the range 1.5–4.5 kpc, and the ellipsoid thus is directed toward a point located behind the Galactic center, at a Galactocentric distance increasing with from Ro=2.3 to 9 kpc. Orbit integration studies indeed predict this result (Kuijken & Gilmore, 1989; Binney & Spergel, 1983; Kent & de Zeew, 1991; Shapiro et al., 2003), but the inclination is noticeably higher than the expectations, because theoretical calculations return Ro=5–10 kpc at =1.1 kpc. This could indicate that the Galactic potential used in these studies needs to be refined to match the observations. On the contrary, the increase of modeled by Bond et al. (2010) is too steep, and their expectation (3.5 kpc)=26 is at variance with our results.
5.4 MOdified Newtonian Dynamics
Bienaymé et al. (2009) showed that the vertical trend of the tilt angle is an excellent observational signature of the underlying gravity law, and it can be used as a test for the MOdified Newtonian Dynamics theory (MOND, Milgrom, 1983), because its expectation diverges from that of the Newtonian dynamics with distance from the plane. Unfortunately, the calculations of Bienaymé et al. (2009) are limited to 2 kpc, and the range of overlap with our data is very narrow. The value of expected by Bienaymé et al. (2009) at =2 kpc is 12 for Newtonian dynamics and 10 for MOND. We find (2 kpc)= and the mean of the five measurements in the range 1.8-2.2 kpc is , in excellent agreement with MOND expectations. The linear fit presented in Section 5.3 also implies (2 kpc)=. However, we derive a vertical gradient ( kpc-1) much shallower than the predictions of Bienaymé et al. (2009) for both MOND (5 kpc-1) and Newtonian dynamics (6 kpc-1). In conclusion, our observations agree better with the models that Bienaymé et al. (2009) derived for MOND than with those from Newtonian dynamics, but the extension of Bienaymé et al. (2009) calculations to higher , and to specific initial conditions for the thick disk, are required to perform a reliable test of the gravitational law.
5.5 Subtructures in the thick disk
The vertical profile of shows a puzzling behavior between 2.5 and 3.5 kpc from the Galactic plane (top panel, Figure 6), where the dispersion deviates from the linear trend. A similar feature is clearly observable in the trend of other quantities related to the radial velocity component , like and (as already noted by Moni Bidin et al., 2010), but deviations from the linear trend in the range =2.5–3 kpc could be present even in other profiles, such as , , , and . The origin of this behavior is unclear. It is possible that a group of comoving stars, forming a sub-structure in the Galactic thick disk, is affecting the measured kinematics between 2.5 and 3.5 kpc from the plane. In particular, the similarity of the profile of two totally unrelated quantity such as and is instructive, because it excludes the possibility that this behavior is only due to some bad measurements. In any case, the existence of a kinematical substructure among our stars cannot be claimed on the basis of these results only.
5.6 Radial behavior of

Our targets are distributed in a very narrow range of , and the data do not provide any direct information about the radial behavior of the kinematical quantities. Nevertheless, some indirect indication can be derived. Manipulating the radial Jeans equation in cylindrical coordinates in steady state, with the radial component of the force expressed as F, we obtain:
| (8) |
where we also assumed that , /=0, and that the density decays exponentially with both and , with scale length and scale height . Inserting the observed quantities in the right hand side of Equation 8 we can thus estimate, as an exercise, the radial behavior of . The large uncertainties involved prevent a precise measurement, but the comparison with the expectations provides a consistency check for the kinematical data here presented, because an unphysical result could indicate a problem with them. The results are shown in Figure 10, where we assumed =3.6 kpc and =0.9 kpc (Jurić et al., 2008), R⊙=8 kpc, and =220 km s-1. The data points are scattered around the mean value km s-1 kpc-1, following the behavior of discussed in Section 5.5, with no clear vertical trend. In the nearest bins the results are partially consistent, but more negative, than what found by Casetti-Dinescu et al. (2011) and Neese & Yoss (1988, km s-1 kpc-1), although Neese & Yoss refer to the thin disk. The observations show (van der Kruit & Searle, 1981, 1982) that should exponentially decay in the radial direction, with the same scale length of the mass density. This is often considered valid even for , under the assumption of a constant anisotropy, and Cuddeford & Amendt (1992) found that this should be the best approximation at the solar position. The results also roughly agree with the expectation of this model, as shown in Figure 10. In conclusion, the presented kinematics implies a radial behavior of consistent with both previous observations and with the expectations of theoretical predictions.
5.7 Comparison with models of thick disk formation
The presence of kinematical gradients in the Galactic thick disk is a powerful diagnostic to discriminate between the various models of its formation (Majewski, 1993), but unfortunately the model expectations concerning the vertical gradient have not been investigated so far. It would be interesting to compare, in the near future, the predictions of the various models with the observed trend with of the velocity dispersions. On the contrary, the radial gradient of the dispersions has been modeled in the context of thick disk formation through disk heating by the merging of minor satellites (Villalobos & Helmi, 2008; Bekki & Tsujimoto, 2011). The observations of Casetti-Dinescu et al. (2011) agree with the results of these simulations, provided that a low inclination orbit of the merging satellite is assumed. A similar conclusion is drawn comparing our measurements of / with the theoretical expectations of the merging scenario. In fact, the simulations showed that this ratio is strongly linked to the inclination angle of the orbit (Villalobos & Helmi, 2008; Purcell et al., 2009), and our result (/=2.08) favors a small inclination angle, 0–30 (see Figure 15 of Villalobos et al., 2010). A low inclination orbit of the infalling satellite is also required to reproduce the rather large vertical gradient of the rotational velocity, found in this work as in previous investigations (Villalobos & Helmi, 2008; Bekki & Tsujimoto, 2011). On the contrary, the radial migration model predicts a much shallower gradient (17 km s-1 kpc-1, Loebman et al., 2011), incompatible with the observations.
In conclusion, the models of thick disk formation have so far provided only fragmentary predictions about its kinematical properties, and our observations cannot still be used to fully discriminate between them. However, we find that our results are consistent with the scenario where the thick disk formed through dynamical heating of a pre-existing Galactic disk, induced by the merging of a minor satellite. Moreover, all the kinematical evidence shows that, if this is the correct model, a low-latitude () merging event is strongly preferred.
6 CONCLUSIONS
We have analyzed a sample of 400 thick disk stars, measuring the variation of their kinematical properties as a function of distance from the Galactic plane, from =1.5 to 4.5 kpc. Our results can be summarized as follows:
-
•
While the mean vertical velocity component shows no significant deviation from zero in the whole range, between 1.5 and 3 kpc, we find a net radial motion of about 20 km s-1 directed toward the Galactic anticenter. Other authors have recently found evidence for a similar behavior, proposing an inward motion of the LSR, although our mean velocity is larger than their proposed value by a factor of two. However, we find that changes sign for 3 kpc, and that a radial motion of the LSR, although not excluded, cannot alone explain this behavior.
-
•
The mean rotational velocity of the thick disk decreases with distance from the Galactic plane, as found by many previous investigations. The linear fit of our data returns a gradient of km s-1 kpc-1, our data points and the results of three other previous works are globally better represented by a power-law with index 1.25, very similar to what has recently been proposed by Bond et al. (2010).
-
•
All the velocity dispersions steadily increase with distance from the Galactic plane, closely following a linear relation. The gradients we found are, however, smaller than those proposed by previous works.
-
•
While the velocity dispersions increase with , the ratios and show no significant vertical trend. The observations thus indicate a substantial constancy with of the anisotropy.
-
•
We find a non-negligible vertex deviation, increasing with from values close to zero to at =3.5 kpc. This is consistent with previous investigations, which found a very small vertex deviation of old stellar population close to the Galactic plane.
-
•
The tilt angle steadily increases with distance from the Galactic plane. As expected, the orientation of the velocity ellipsoid in the - plane results, at any , intermediate between alignment with the cylindrical and spherical coordinate systems. According to calculations by Bienaymé et al. (2009), the tilt angle at =2 kpc coincides with the expectation of MOND, although the extension of their models to higher Galactic heights is required to perform a conclusive test of the underlying gravitational law.
-
•
The vertical trend of many kinematical quantities show deviations from linearity between 2.5 and 3.5 kpc. The origin of these features is unknown, but it could indicate the presence of a sub-structure at this Galactic height, such as a comoving group of stars.
-
•
The results are fully consistent with the model of thick disk formation through dynamical heating of a pre-existing Galactic disk. If this is the correct scenario, a low inclination angle of the merging event is strongly preferred. However, not all the models proposed so far could be tested by our observations, and more simulations are required to obtain a detailed comparison able to discriminate between them.
References
- Allende Prieto et al. (2006) Allende Prieto, C., Beers, T. C., Wilhelm, R., et al. 2006, ApJ, 636, 804
- Amendt & Cuddeford (1991) Amendt, P., & Cuddeford, P. 1991, ApJ, 368, 79
- Assmann et al. (2011) Assmann, P., Fellhauer, M., Kroupa, P., Brüns, R. C., & Smith, R. 2011, MNRAS, 415, 1280
- Beers & Sommer-Larsen (1995) Beers, T. C., & Sommer-Larsen, J. 1995, ApJS, 96, 175
- Bekki & Tsujimoto (2011) Bekki, K., & Tsujimoto, T. 2011, ApJ, 738, 4
- Bensby et al. (2003) Bensby, T., Feltzing, S., & Lundström, I. 2003, A&A, 410, 527
- Bensby et al. (2007) Bensby, T., Zenn, A. R., Oey, M. S., & Feltzing, S., 2007, ApJ, 663, L13
- Bienaymé (1999) Bienaymé, O. 1999, A&A, 341, 86
- Bienaymé (2009) Bienaymé, O. 2009, A&A, 500, 781
- Bienaymé et al. (2009) Bienaymé, O., Famaey, B., Wu, X., Zhao, H. S., & Aubert, D. 2009, A&A, 500, 801
- Binney & Merrifield (1998) Binney, J., & Merrifield, M. 1998, Galactic astronomy (Princeton, NJ: Princeton University Press), 1998
- Binney & Spergel (1983) Binney, J., & Spergel, D. 1983, The nearby stars and the stellar luminosity, ed. A.G.D. Philip, & U. Schenectady (N.Y.: Davis Press), IAU Col., 76, 259
- Bochanski et al. (2007) Bochanski, J. J., Munn, J. A., Hawley, S. L., et al. 2007, AJ, 134, 2418
- Bond et al. (2010) Bond, N. A., Ivezić, Z., Sesar, B., et al. 2010, ApJ, 716, 1
- Bournaud et al. (2009) Bournaud, F., Elmegreen, B. G., & Martig, M. 2009, ApJ, 707, L1
- Brown et al. (2008) Brown, W. R., Beers, T. C., Wilhelm, R., et al. 2008, AJ, 135, 564
- Cardelli et al. (1989) Cardelli, J. A., Geoffrey, C. C., & Mathis, J. S. 1989, ApJ, 345, 245
- Carney et al. (1989) Carney, B. W., Latham, D. W., & Laird, J. B. 1989, AJ, 97, 423
- Carollo et al. (2010) Carollo, D., Beers, T. C., Chiba, M., et al. 2010, ApJ, 712, 692
- Carraro et al. (2005) Carraro, G., van Altena, W. F., Moni Bidin, C., et al. 2005, AAS, 37, 1378
- Casetti-Dinescu et al. (2011) Casetti-Dinescu, D. I., Girard, T. M., Korchagin, V. I., & van Altena, W. F. 2011, ApJ, 728, 7
- Chiba & Beers (2000) Chiba, M., & Beers, T. C. 2000, AJ, 119, 2843
- Cuddeford & Amendt (1992) Cuddeford, P., & Amendt, P. 1992, MNRAS, 256, 166
- Dalcanton & Bernstein (2002) Dalcanton, J. J., & Bernstein, R. A. 2002, AJ, 124, 1328
- Dehnen & Binney (1998) Dehnen, W., & Binney, J. 1998, MNRAS, 298, 387
- Duflot et al. (1995) Duflot, M., Figon, P., & Meyssonnier, N. 1995, A&AS, 114, 269
- Evans (1970) Evans, L. T. 1970, MNRAS, 149, 311
- Feltzing et al. (2003) Feltzing, S., Bensby, T., & Lundström, I. 2003, A&A, 397, L1
- Fuchs et al. (2009) Fuchs, B., Dettbarn, C., Rix, H.-W., et al. 2009, AJ, 137, 4149
- Fuhrmann (1998) Fuhrmann, K. 1998, A&A, 338, 161
- Flynn & Freeman (1993) Flynn, C., & Freeman, K. C. 1993, A&AS, 97, 835
- Gilmore & Reid (1983) Gilmore, G., & Reid, N. 1983, MNRAS, 202, 1025
- Girard et al. (2004) Girard, T. M., Dinescu, D. I., van Altena, W. F., et al. 2004, AJ, 127, 3060
- Girard et al. (2006) Girard, T. M., Korchagin, V. I., Casetti-Dinescu, D. I., et al. 2006 AJ, 132, 1768
- Gómez et al. (2011) Gómez, F. A., Minchev, I., Villalobos, A., O’Shea, B. W., & Williams, M. E. K. 2011 (arXiv:1105.4231)
- Gratton et al. (2003) Gratton, R. G., Bragaglia, A., Carretta, E., et al. 2003, A&A, 408, 529
- Gratton et al. (2001) Gratton, R. G., Carretta, E., Matteucci, F., & Sneden, C. 2001, A&A, 358, 671
- Gray & Corbally (1994) Gray, R. O., & Corbally, C. J. 1994, AJ, 107, 742
- Hamaker (1978) Hamaker, H. C. 1978, Appl. Stat., 27, 7
- Haywood (2001) Haywood, M. 2001, MNRAS, 325, 1365
- Hori & Liu (1963) Hori, L., & Liu, T. 1963, PASJ, 15, 100
- Horne (1986) Horne, K. 1986, PASP, 98, 609
- Ivezic et al. (2008) Ivezić, Z., Sesar, B., Jurić, M., et al. 2008, ApJ, 684, 287
- Jones (1972) Jones, D. H. P. 1972, ApJ, 178, 467
- Jurić et al. (2008) Jurić, M., Ivezić, Z., Brooks, A., et al. 2008, ApJ, 673, 864
- Kent & de Zeew (1991) Kent, S., & de Zeew, T. 1991, AJ, 102, 1994
- Kobayashi & Nakasato (2011) Kobayashi, C., & Nakasato, N. 2011, ApJ, 729, 16
- Kuijken & Gilmore (1989) Kuijken, K., & Gilmore, G. 1989, MNRAS, 239, 571
- Kuijken & Tremaine (1991) Kuijken, K., & Tremaine, S. 1991, in Dynamics of disc galaxies, Varberg Castle, Sweden, 71
- Loebman et al. (2011) Loebman, S. R., Roskar, R., Debattista, V. P., et al. 2011, ApJ, 737, 8
- Lutz & Hanson (1992) Lutz, T. E., & Hanson, R. B. 1992, ASP Conf. Series, 25, 257
- Lynden-Bell (1962) Lynden-Bell, D. 1962, MNRAS, 124, 95
- Majewski (1992) Majewski, S. R. 1992, ApJS, 78, 87
- Majewski (1993) Majewski, S. R. 1993, ARA&A, 31, 575
- Majewski et al. (2004) Majewski, S. R., Kunkel, W. E., Law, D. R., et al. 2004, AJ, 128, 245
- Milgrom (1983) Milgrom, M. 1983, ApJ, 270, 371
- Monaco et al. (2011) Monaco, L., Villanova, S., Moni Bidin, C., et al. 2011, A&A, 529, A90
- Moni Bidin et al. (2006) Moni Bidin, C., Moehler, S., Piotto, G., et al. 2006, A&A, 451, 499
- Moni Bidin et al. (2008) Moni Bidin, C., Girard, T. M., Carraro, G., et al. 2009, RMxAC, 35, 109
- Moni Bidin (2009) Moni Bidin, C. 2009, PhD Thesis, Univ. de Chile, 1
- Moni Bidin et al. (2010) Moni Bidin, C., Carraro, G., Méndez, R. A., & van Altena, W. F. 2010, ApJ, 724, L122
- Neese & Yoss (1988) Neese, C. L., & Yoss, K. M. 1988, AJ, 95, 463
- Ollongren (1962) Ollongren, A. 1962, BAAS, 16, 561
- Purcell et al. (2009) Purcell, C. W., Bullock, J. S., & Kaplinghat, M. 2009, ApJ, 703, 2275
- Quillen et al. (2010) Quillen, A. C., Doughery, J., Bagley, M. B., Minchev, I., & Comparetta, J. 2010, MNRAS, submitted (arXiv:1010.5745)
- Quinn et al. (1993) Quinn, P. J., Hernquist, L., & Fullagar, D. P. 1993, ApJ, 403, 74
- Reddy et al. (2006) Reddy, B. E., Lambert, D. L., & Allende Prieto, C. 2006, MNRAS, 367, 1329
- Rocha-Pinto et al. (2000) Rocha-Pinto, H. J., Maciel, W. J., Scalo, J. & Flynn, C. 2000, A&A, 358, 850
- Ros̆kar et al. (2008) Ros̆kar, R., Debattista, V. P., Stinson, G. S., et al. 2008, ApJ, 675, L65
- Rybka & Yatsenko (2010) Rybka, S. P., & Yatsenko, A. I. 2010, KPCB, 25, 309
- Schlegel et al. (1998) Schlegel, D. J., Finkbeiner, D. P., & Davis, M. 1998, ApJ, 500, 525
- Schönrich & Binney (2009) Schönrich, R., & Binney, J. 2009, MNRAS, 396, 203
- Schönrich et al. (2010) Schönrich, R., Binney, J., & Dehnen, W. 2010, MNRAS, 403, 1829
- Seth et al. (2005) Seth, A. C., Dalcanton, J. J., & de Jong, R. S. 2005, AJ, 130, 1574
- Shapiro et al. (2003) Shapiro, K., Gerssen, J., & van der Marel, R. 2003, ApJ, 126, 2707
- Siebert et al. (2008) Siebert, A., Bienaymé, O., Binney, J., et al. 2008, MNRAS, 391, 793
- Soubiran et al. (2003) Soubiran, C., Bienaymé, O., & Siebert, A. 2003, A&A, 398, 141
- Spagna et al. (2010) Spagna, A., Lattanzi, M. G., Re Fiorentin, P., & Smart, R. L. 2010, A&A, 510, 4
- Skrutskie et al. (2006) Skrutskie, M. F., Cutri, R. M., Stiening, R., et al. 2006, AJ, 131, 1163
- Smith et al. (2009) Smith, M. C., Evans, N. W., Belokurov, V. et al. 2009, MNRAS, 399, 1223
- Tonry & Davis (1979) Tonry, J. & Davis, M. 1979, AJ, 84, 1511
- Vallenari et al. (2006) Vallenari, A., Pasetto, S., Bertelli, G., et al. 2006, A&A, 451, 125
- van der Kruit & Searle (1981) van der Kruit, P. C., & Searle, L. 1981, A&A, 95, 105
- van der Kruit & Searle (1982) van der Kruit, P. C., & Searle, L. 1982, A&A, 110, 61
- Veltz et al. (2008) Veltz, L., Bienaymé, O., Freeman, K. C., et al. 2008, A&A, 2008, 480, 753
- Villalobos & Helmi (2008) Villalobos, A.,& Helmi, A. 2008, MNRAS, 391, 1806
- Villalobos & Helmi (2009) Villalobos, A.,& Helmi, A. 2009, MNRAS, 399, 166
- Villalobos et al. (2010) Villalobos, A., Kazantzidis, S., & Helmi, A. 2010, ApJ, 718, 314
- Wyse & Gilmore (2005) Wyse, R. F. G. & Gilmore, G. 2005, astro-ph/0510025
- Yi et al. (2003) Yi, S. K., Kim, Y.-C., & Demarque, P. 2003, ApJS, 144, 259
- Yoss et al. (1987) Yoss, K. M., Neese, C. L., & Hartkopf, W. I. 1987, AJ, 94, 1600
- Yoss & Griffin (1997) Yoss, K. M., & Griffin, R. F. 1997, JApA, 18, 161
- Walker et al. (1996) Walker, I. R., Mihos, J. C., & Hernquist, L. 1996, ApJ, 460, 121
- Zinn (1985) Zinn, R. 1985, ApJ, 293, 424
- Zwitter et al. (2008) Zwitter, T., Siebert, A., Munari, U., et al. 2008, AJ, 136, 421