On the Unification of Active Galactic Nuclei
Abstract
The inevitable spread in properties of the toroidal obscuration of active galactic nuclei (AGNs) invalidates the widespread notion that type 1 and 2 AGNs are intrinsically the same objects, drawn randomly from the distribution of torus covering factors. Instead, AGNs are drawn preferentially from this distribution; type 2 are more likely drawn from the distribution higher end, type 1 from its lower end. Type 2 AGNs have a higher IR luminosity, lower narrow-line luminosity and a higher fraction of Compton thick X-ray obscuration than type 1. Meaningful studies of unification statistics cannot be conducted without first determining the intrinsic distribution function of torus covering factors.
Subject headings:
infrared: galaxies – galaxies: active – galaxies: nuclei – galaxies: Seyfert – quasars: general1. Introduction
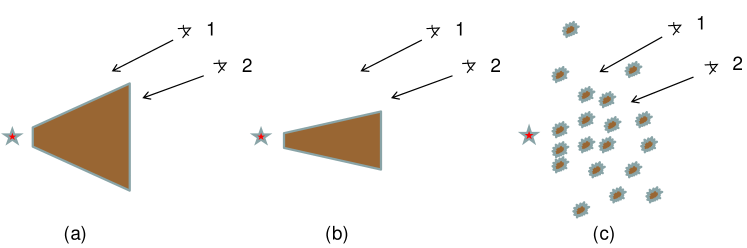
The basic premise of the unification scheme is that all AGNs are fundamentally the same: accreting supermassive black holes. The central engine is surrounded by a dusty toroidal structure so that the observed diversity simply reflects different viewing angles of an axisymmetric geometry (Antonucci, 1993; Urry & Padovani, 1995). The classification of AGNs into types 1 and 2 is based on the extent to which the nuclear region is visible (figure 1). Directions with clear sight of the central engine and the broad-line region (BLR) yield type 1 sources. Those blocked by the torus result in type 2 objects, where the existence of the hidden BLR is revealed only in polarized light. From basic considerations, Krolik & Begelman (1988) concluded that the torus likely consists of a large number of individually very optically thick dusty clouds. Indeed, VLTI interferometry of the Circinus AGN provide strong evidence for a clumpy or filamentary dust structure (Tristram et al., 2007).
In its most extreme form, dubbed the straw person model (SPM) by Antonucci (1993), unification posits the viewing angle as the sole factor in determining AGN classification; that is, (1) the classification of any AGN is determined uniquely by its viewing angle and (2) the torus is identical for all AGNs of the same luminosity.111Increasing luminosity tends to decrease the covering factor as first noted by Lawrence (1991) in the “receding torus” model. For subsequent observations see Maiolino et al. (2007) and references therein. Clumpiness invalidates the first assumption because it turns the difference between types 1 and 2 into the probability for direct view of the AGN (Elitzur, 2007, 2008; Nenkova et al., 2008b). Since this probability is always finite, type 1 sources can be detected from what are typically considered type 2 orientations, even through the torus equatorial plane. Conversely, if a cloud happens to obscure the AGN from an observer, that object would be classified as type 2 irrespective of the viewing angle (see figure 1c). In cases of such single cloud obscuration, on occasion the cloud may move out of the line of sight, creating a clear path to the nucleus and a transition to type 1 spectrum, as observed in a number of sources (see Aretxaga et al. 1999 and references therein).
The second assumption underlying SPM, about the torus sameness, obviously does not hold. All AGNs cannot be expected to have the exact same torus; there must be a spread in torus properties, even among AGNs with the same luminosity. Here I discuss some immediate, fundamental implications of this inevitable spread.
2. Realistic Unification
In panel (a) of figure 1, observer 1 will see the AGN as type 1, observer 2 as type 2. In panel (b) the AGN orientation is the same as in panel (a), only its torus has a smaller covering factor. Now both observers see a type 1 object even though their viewing angles have not changed. Evidently, the torus covering factor is as central to AGN classification as is the viewing angle because an AGN with a larger covering factor has a higher probability to be viewed as type 2 by a random observer. This is obvious also for the more realistic clumpy torus, shown in panel (c) of figure 1. Therefore, in a sample of AGNs with a distribution of covering factors, those with a larger will have a higher probability to be viewed as type-2 by a random observer, implying that
AGNs are drawn preferentially from the distribution of covering factors; type-1 are more likely drawn from the distribution lower end, type-2 from its higher end.
Contrary to the widespread notion that AGNs of types 1 and 2 are intrinsically the same objects, fundamental differences between their average properties do exist.
This is a more realistic formulation of the unification scheme than SPM, with profound implications for AGN studies. Realistic unification immediately explains the findings by Ramos Almeida et al. (2009, 2011), based on SED modeling of AGN IR emission, that the dusty tori tend to have larger covering factors in Seyfert 2 than in Seyfert 1. It also explains the seemingly puzzling results of the recent study by Ricci et al. (2011), who analyzed in detail stacked hard X-ray spectra (50–200 keV) of all Seyfert galaxies detected with INTEGRAL, the hard X-ray/soft -ray mission. In agreement with the basic tenets of unification, both Seyfert 1 and Seyfert 2 were found to have the same average nuclear continuum emission, with a photon index of = 1.8. But in apparent contradiction with unification, the reflection component was significantly stronger for the average spectrum of Compton thin Seyfert 2 than for Seyfert 1. Ricci et al find this discrepancy to arise from a further sub-division among the Seyfert 2 AGNs. The “lightly obscured” ones ( cm-2) have the same reflection component as Seyfert 1, , but those that are “mildly obscured” () display a much stronger reflection with . While this finding contradicts simplistic forms of unification, it is precisely the behavior expected from its realistic formulation: Seyfert 1 and lightly obscured Seyfert 2 correspond to different viewing angles of intrinsically similar AGNs, drawn from the low end of the covering factor distribution, thus they conform, on average, to simplistic unification. But in mildly obscured Seyfert 2 the absorber/reflector covers a larger fraction of the X-ray source, producing stronger reflection that is not seen in the average Seyfert 1 spectrum, where large covering factors are rare. The large difference between the average reflection spectra of Seyfert 1 and 2 arises from significant differences in their torus covering factors.
3. Covering Factors
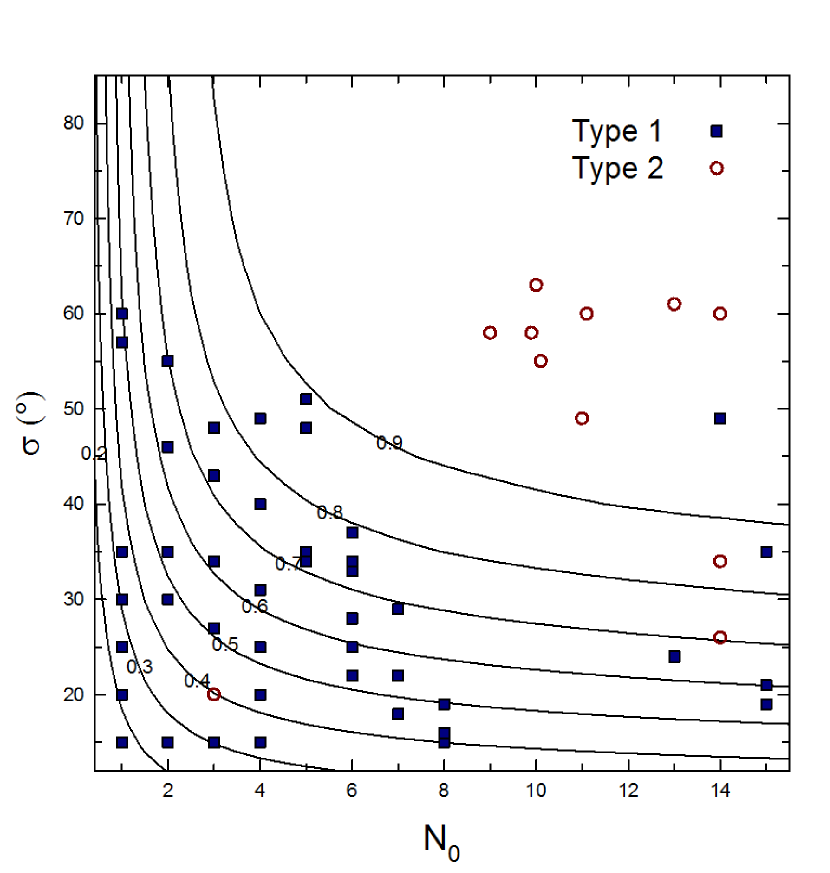
The sometime loosely invoked concept of “torus covering factor”, , can be rigorously defined as the fraction of the sky at the AGN center covered by obscuring material; it is the same as the fraction of randomly distributed observers whose view to the center is blocked, and thus see a type 2 AGN (Nenkova et al., 2008a). Denote by the overall number of clouds encountered, on average, along angle from the axis. Then the probability for direct viewing of the AGN from that direction is and the torus covering factor is . If is the average number of clouds along radial equatorial rays then , where . The cloud angular distribution function can be conveniently parametrized as Gaussian, , with the distribution angular width (Elitzur et al., 2004; Nenkova et al., 2008b). Fitting of IR observations with clumpy torus models with Gaussian angular distributions has been reported by a number of teams, and figure 2 shows the results of these modeling efforts in the – plane together with the contour plots of .222Earlier versions of this figure were presented in Elitzur (2009; accessible at www.mpe.mpg.de/events/pgn09/online_proceedings.html) and Ramos Almeida et al. (2011). The contour plots in both of these earlier figures are afflicted by the computer bug reported in Nenkova et al. (2010). As expected from realistic unification, and first noted by Ramos Almeida et al. (2009), type 1 and type 2 AGNs preferentially occupy different regions in the plane. The few sources with a “wrong” covering factor (large- type 1, small- type 2) merely reflect the probabilistic nature of clumpy obscuration. Although this ad-hoc collection of AGNs, which were selected by different, unrelated criteria, does not constitute a complete sample (only the Mor et al. 2009 analysis of PG quasars involved a complete sample), it does illustrate the point.
Since the covering factor measures the fraction of AGN luminosity captured by the torus and converted to infrared, the AGN IR luminosity is , where is its bolometric luminosity. Therefore type 2 AGNs have intrinsically higher IR luminosities than type 1. Contrary to earlier expectations of strong anisotropy at , Spitzer observations at this wavelength regime show a great similarity between the IR fluxes of AGNs 1 and 2 when normalized with either their X-ray fluxes (Lutz et al., 2004; Horst et al., 2006) or optically thin radio emission (Buchanan et al., 2006). Part of this puzzle was solved by clumpy torus calculations, which show much less anisotropy in IR emission than the earlier smooth-density models (Nenkova et al., 2008b). Realistic unification explains away the remainder.
While infrared arises from reprocessing of the AGN radiation captured by the torus, narrow line emission is generated by the radiation that has escaped the torus. The narrow line luminosity is proportional to . At the same bolometric luminosity, type 1 AGNs can be expected to have a higher narrow line luminosity than type 2.
4. Unification Statistics
Implicitly or explicitly, all studies of AGN statistics assume that type 1 and type 2 are intrinsically the same objects, drawn randomly from the distribution of torus covering factors. Realistic unification invalidates this assumption, implying that covering factors deduced from analysis of type 2 sources do not necessarily apply to type 1 and vice versa. This may contribute to discrepancies among studies of AGN statistics. Thus the fraction of Compton thick AGNs (X-ray obscuring column cm-2) was determined to be as high as 50% in a pre-selected sample of Seyfert 2 (Risaliti et al., 1999; Guainazzi et al., 2005) but only 20% in complete X-ray samples without spectroscopic pre-selection (Malizia et al., 2009; Burlon et al., 2011).
Schmitt et al. (2001) find that the type 2 fraction among Seyfert galaxies is 70%, while Hao et al. (2005) find it to be only 50%. This discrepancy can be attributed, at least in part, to different selection methods. Both studies based their selections on what they considered reliable isotropic properties: Schmitt et al used 60 m IR emission, Hao et al the narrow-line luminosity of [O iii] . However, as noted above, thanks to the larger covering factor of their torus, Seyfert 2 convert a larger fraction of their luminosity to IR, therefore IR-selection is biased in their favor. The opposite afflicts the line selection criterion of Hao et al, which introduces preference for smaller covering factors and type 1 AGNs. Even though the emission itself might be isotropic, in both cases it involves reprocessing of different fractions of the intrinsic UV/optical continuum, and these fractions introduced opposite biases in the two studies.
All previous findings involving unification statistics, including the synthesis of the cosmic X-ray background (e.g., Gilli et al. 2007; Treister et al. 2009), therefore need a critical reexamination and revision. One cannot draw statistical inferences from AGN populations without folding in the intrinsic distribution of torus covering factors, which is unknown. A reliable determination of this distribution function requires IR modeling of an unbiased, complete sample of AGNs. The only practical method to select AGNs with minimal classification bias is through hard X-ray surveys; although such selection still misses the most heavily obscured () Compton thick AGNs (Burlon et al., 2011; de Rosa et al., 2012), it is the least biased method of AGN selection. From the catalogue of INTEGRAL observations in the 20–40 keV band, Malizia et al. (2009) extracted a complete sample of 88 AGNs, including type classification. Using 0.3–195 keV data from Swift–BAT observations and the XMM-Newton archive, Burlon et al. (2011) have compiled another complete sample that contains 199 type-classified AGNs. Identifying Spitzer counterparts to AGNs in these samples and fitting their IR observations with clumpy torus models, as was done for the sources shown in figure 2, is the only feasible approach to determining the intrinsic distribution function of torus covering factors. Searching through the Spitzer archives shows that the Malizia et al sample has 54 matches (L. Bassani and A. Malizia, private communication); a similar search for the Swift–BAT sample can be expected to add significantly to the number of blindly selected AGNs with Spitzer counterparts. In a future publication we will report separately the results of clumpy torus modeling of the IR emission for each source in this expanded list to determine its torus covering factor from the fitted values of and , and construct from the entire sample the probability distribution function of .
5. Discussion
Introducing SPM, Antonucci (1993) suggested that “The true situation may be in some sense half way between the SPM and the hypothesis that orientation doesn’t affect classification at all,” ascribing classification to a single property of the system — orientation. However, quite apart from the indeterminism introduced by clumpiness, AGN classification involves a fundamental plane spanned by two independent axes — orientation and covering factor. Simply put, the true situation is not somewhere between SPM and no orientation effects; it involves an additional, independent variable.
Because the covering factor is an intrinsic, observer-independent property, it makes what has always been a difficult problem even more difficult. AGN selection by an isotropic emission indicator is insufficient for reliable statistics because most measured fluxes involve reprocessing of the intrinsic UV/optical radiation and the fraction captured for reprocessing may differ. The IR luminosity is while the narrow line luminosity is proportional to , introducing biases in favor of, respectively, types 2 and 1. Past studies of unification statistics cannot be fully trusted before they are repeated taking into account the, as yet unknown, distribution of covering factors.
References
- Alonso-Herrero et al. (2011) Alonso-Herrero, A. et al. 2011, ApJ, 736, 82
- Antonucci (1993) Antonucci, R. 1993, ARA&A, 31, 473
- Aretxaga et al. (1999) Aretxaga, I., Joguet, B., Kunth, D., Melnick, J., & Terlevich, R. J. 1999, ApJ, 519, L123
- Buchanan et al. (2006) Buchanan, C. L., Gallimore, J. F., O’Dea, C. P., Baum, S. A., Axon, D. J., Robinson, A., Elitzur, M., & Elvis, M. 2006, AJ, 132, 401
- Burlon et al. (2011) Burlon, D., Ajello, M., Greiner, J., Comastri, A., Merloni, A., & Gehrels, N. 2011, ApJ, 728, 58
- de Rosa et al. (2012) de Rosa, A. et al. 2012, MNRAS, 420, 2087
- Deo et al. (2011) Deo, R. P., Richards, G. T., Nikutta, R., Elitzur, M., Gallagher, S. C., Ivezić, Ž., & Hines, D. 2011, ApJ, 729, 108
- Elitzur (2007) Elitzur, M. 2007, in ASP Conf. Ser. 373: The Central Engine of Active Galactic Nuclei, ed. L. C. Ho & J.-M. Wang, 415–424
- Elitzur (2008) Elitzur, M. 2008, New Astronomy Review, 52, 274
- Elitzur (2009) Elitzur, M. 2009, in Physics of Galactic Nuclei, Ringberg Castle Workshop
- Elitzur et al. (2004) Elitzur, M., Nenkova, M., & Ivezić, Ž. 2004, in ASP Conf. Ser. 320: The Neutral ISM in Starburst Galaxies, ed. S. Aalto, S. Huttemeister, & A. Pedlar, 242–252
- Gilli et al. (2007) Gilli, R., Comastri, A., & Hasinger, G. 2007, A&A, 463, 79
- Guainazzi et al. (2005) Guainazzi, M., Matt, G., & Perola, G. C. 2005, A&A, 444, 119
- Hao et al. (2005) Hao, L. et al. 2005, AJ, 129, 1795
- Horst et al. (2006) Horst, H., Smette, A., Gandhi, P., & Duschl, W. J. 2006, A&A, 457, L17
- Krolik & Begelman (1988) Krolik, J. H., & Begelman, M. C. 1988, ApJ, 329, 702
- Lawrence (1991) Lawrence, A. 1991, MNRAS, 252, 586
- Lutz et al. (2004) Lutz, D., Maiolino, R., Spoon, H. W. W., & Moorwood, A. F. M. 2004, A&A, 418, 465
- Maiolino et al. (2007) Maiolino, R., Shemmer, O., Imanishi, M., Netzer, H., Oliva, E., Lutz, D., & Sturm, E. 2007, A&A, 468, 979
- Malizia et al. (2009) Malizia, A., Stephen, J. B., Bassani, L., Bird, A. J., Panessa, F., & Ubertini, P. 2009, MNRAS, 399, 944
- Mor et al. (2009) Mor, R., Netzer, H., & Elitzur, M. 2009, ApJ, 705, 298
- Nenkova et al. (2008a) Nenkova, M., Sirocky, M. M., Ivezić, Ž., & Elitzur, M. 2008a, ApJ, 685, 147
- Nenkova et al. (2008b) Nenkova, M., Sirocky, M. M., Nikutta, R., Ivezić, Ž., & Elitzur, M. 2008b, ApJ, 685, 160
- Nenkova et al. (2010) —. 2010, ApJ, 723, 1827
- Nikutta et al. (2009) Nikutta, R., Elitzur, M., & Lacy, M. 2009, ApJ, 707, 1550
- Ramos Almeida et al. (2011) Ramos Almeida, C. et al. 2011, ApJ, 731, 92
- Ramos Almeida et al. (2009) —. 2009, ApJ, 702, 1127
- Ricci et al. (2011) Ricci, C., Walter, R., Courvoisier, T. J.-L., & Paltani, S. 2011, A&A, 532, A102+
- Risaliti et al. (1999) Risaliti, G., Maiolino, R., & Salvati, M. 1999, ApJ, 522, 157
- Schmitt et al. (2001) Schmitt, H. R., Antonucci, R. R. J., Ulvestad, J. S., Kinney, A. L., Clarke, C. J., & Pringle, J. E. 2001, ApJ, 555, 663
- Treister et al. (2009) Treister, E., Urry, C. M., & Virani, S. 2009, ApJ, 696, 110
- Tristram et al. (2007) Tristram, K. R. W. et al. 2007, A&A, 474, 837
- Urry & Padovani (1995) Urry, C. M., & Padovani, P. 1995, PASP, 107, 803