Yan et al.The estimate of emission region locations of Fermi FSRQs
galaxies: active – radiation mechanisms: nonthermal – quasars: general – -rays: observations
The estimate of emission region locations of Fermi flat spectrum radio quasars
Abstract
We study the locations of emission regions through modelling the quasi-simultaneous multi-frequency spectral energy distributions of 21 Fermi flat spectrum radio quasars (FSRQs) in the frame of a multi-component one-zone leptonic model. In our calculations, we take the detailed broad line region (BLR) structure into account and discuss the effect of the uncertainty of the BLR structure on constraining the location of the emission regions for each FSQR, meanwhile we also include both the internal and external absorptions. Our results indicate that (1) the contribution of external Compton-BLR component is important to -ray emission, and the energy density of external target photon fields depends on the location of the emission region, which can be derived through reproducing the observed -ray emission, and (2) the emission regions of FSRQs with relative low accretion disk luminosity lie in the region of – cm (300 – 4300 Schwarzschild radii) from central black hole, and for FSRQs with high accretion disk luminosity, the emission regions locate in the larger region of – cm (300 – 5600 Schwarzschild radii).
1 Introduction
Blazars are the most extreme class of active galactic nuclei (AGNs). Their spectral energy distributions (SEDs) are characterized by two distinct bumps: the first bump located at low-energy band is dominated by the synchrotron emission of relativistic electrons which originates in a relativistic jet, and the second bump located at high-energy band could be produced by inverse Compton (IC) scattering (e.g., Böttcher 2007). Various soft photon sources seed the synchrotron self-Compton (SSC) process (e.g., Rees 1967; Maraschi et al. 1992) and external Compton (EC) process (e.g., Dermer & Schlickeiser 1993; Sikora et al. 1994) in the jet to produce -rays. It should be noted that hadronic models have also been proposed to explain the multi-band emissions of blazars (e.g., Mannheim 1993; Mücke et al. 2003). At present, the detectors including the ground-based and satellite-based ones can provide us the high quality data to construct SEDs. Therefore, the simultaneous and quasi-simultaneous SEDs become the basic tools to study the physics properties of blazars, such as magnetic field, the size of emission region, Doppler factor and so on.
The Large Area Telescope (LAT) onboard the Fermi satellite provides unprecedented sensitivity in the -ray band. In its two years operations, 987 blazars were detected, including 360 flat spectrum radio quasars (FSRQs), 423 BL Lacs and 204 unknown type blazars (Ackerman et al., 2011). With Fermi, Swift and other observatories, Abdo et al. (2010a) assembled high quality data of 48 blazars in the first three months LAT sample (LAT Bright AGN Sample: LBAS) to build quasi-simultaneous SEDs. The data from Swift were collected in one day or several days, however, the Fermi-LAT data have been averaged over a three months period. Therefore, the multi-frequency data are quasi-simultaneous but not really simultaneous. Very recently, Giommi et al. (2011) built the SEDs for 105 blazars with the simultaneous Planck, Swift, Fermi, and ground-based data. The data of the 105 blazars are obtained between 2009 Dec. and 2010 Oct., which were all collected in one day or several days, and the multi-frequency data are really simultaneous.
Since the Fermi data are publicly available, many authors have studied the physical properties of blazars with multi-frequency data from radio-X-ray to -ray bands. Ghisellini et al. (2010) constructed the SEDs for 85 blazars in LBAS, and found that there is a positive correlation between the jet power and the luminosity of the accretion disk in FSRQs. Later, Ghisellini et al. (2011) also analyzed the physical properties of blazars with high redshifts in the 11 months Fermi AGN sample (the First LAT AGN Catalog: 1LAC) by using the multi-frequency data. However, most of the multi-frequency data used by these authors are not simultaneous or quasi-simultaneous.
In the study of -ray emissions of blazars, one of important physical properties is the locations of the -ray emission regions. Many authors studied the locations of emission regions in different ways. For example, observed time lag of the -ray emission relative to broad emission lines for 3C 273 is used to constrain the -ray emission region Liu et al. (2011), the -ray absorptions by internal photons of AGNs can be used to constrain the locations of the -ray emission regions (Sitarek & Bednarek, 2008; Bai et al., 2009; Poutanen et al., 2010), and the -ray flux variability of a blazar can infer its location of -ray emission (Tavecchio et al., 2010). In this paper, we study the locations of the emission regions of 21 blazars whose simultaneous and quasi-simultaneous multi-frequency SEDs have been given by Giommi et al. (2011) and Abdo et al. (2010a) in the frame of the multi-component model described in Dermer et al. (2009).
In this study, we use cosmological parameters () = (70 km s-1 Mpc-1, 0.3, 0.7).
2 Photon Emission and Absorption of FSRQs
2.1 Photon Emission
Broad band emission from blazars can be usually described in the framework of leptonic models. Since there is difficulty to explain SEDs of FRSQs in a simple one-zone SSC model (Abdo et al., 2010a), we study the photon emission properties of FSRQs in the frame of one-zone, homogeneous synchrotron and inverse Compton model given by Dermer et al. (2009). There are three soft photon seeds in this model: synchrotron photons, accretion disk photons, and broad line region (BLR) photons.
Nonthermal photon emission is assumed to be produced by both the synchrotron radiation and IC scattering of relativistic electrons in a spherical blob of the jet which is moving relativistically at a small angle to our line of sight, and the observed radiation is strongly boosted by a relativistic Doppler factor . The relativistic electron distribution which we used here is the same as that given by Dermer et al. (2009), i.e.
| (1) |
where is the normalization factor, is the Heaviside function: for and everywhere else; as well as for and for . In the co-moving frame, this distribution is a double power law with two energy cutoffs: and . The spectrum is smoothly connected with indices and below and above the electrons’ break energy . Note that here and throughout the paper, unprimed quantities refer to the distant observer’s frame on Earth and primed ones refer to the co-moving frame.
After giving the electron distribution, the synchrotron flux can be given by Finke et al. (2008)
| (2) |
where is the electron charge, is the magnetic field strength, is the Planck constant, and is the distance to the source with a redshift . Here is synchrotron photons energy in the co-moving frame, where is the rest mass of electron and is the speed of light. In equation (2), , where , is the angle between magnetic field and velocity of high energy electrons, and is the modified Bessel function of the second kind of order 5/3. Here we use an approximation for given by Finke et al. (2008). The synchrotron photons with have following spectral energy density
| (3) |
where is blob’s radius and is minimum variability timescale.
For the IC scattering, there are two kinds of soft photon fields: non-thermal and thermal. The non-thermal field is the synchrotron photons field and high energy peak is created in the SSC process. For isotropic and homogeneous photon and electron distributions, the SSC flux, , is given by Finke et al. (2008)
where is the Thomson cross section, is the energy of IC scattered photons in the co-moving frame, , , , and .
The thermal soft photon field includes soft photon direct from accretion disk and broad line region (BLR) photon components and the IC process is called external Compton (EC) process. Here, we do not take the BLR line radiation into account but only consider the BLR Thomson scattered photon field. Assuming a standard accretion disk with a central black hole mass and an accretion disk luminosity , its mean photon energy in units of at radius is (Finke & Dermer, 2010a), where with , is the accretion efficiency, , , , and for the Schwarzschild metric. Therefore, the differential energy density per one solid angle of photon direct from accretion disk is
where , the normalization factor , and is the temperature of accretion disk at radius , and is Boltzmann energy density constant (Dermer et al., 2009; Inoue & Takahara, 1996).
For the BLR photon field, its specific energy density depends on the BLR structure and the radiation feature of accretion disk. Here, two assumptions are made: (1) the BLR is a spherically symmetric shell with inner radius and outer radius . In general, the radius of BLR can be roughly estimated by using the relationship between some emission lines luminosity and the radius of BLR (e.g., Kaspi et al. 2005; Bentz et al. 2009), and the method of straight-forward reverberation mapping (e.g., Paltani & Turler 2005), but as discussed in Ghisellini & Tavecchio (2008), these methods also lead to large uncertainties on the radius of BLR. Fortunately, it has been found that the BLR radius can scale roughly as (e.g., Wandel et al. 1999) or (e.g., Kaspi et al. 2000). Here, we assume the simplest hypothesis that the BLR radius scales with the square root of the disk luminosity (Ghisellini & Tavecchio, 2008), i.e., , consider the as the outer radius of the shell BLR, and assume with representing a moderate width; and (2) the gas density of the BLR has the power-law distribution for , it has been suggested that the particle density of the BLR in quasars scales as or (e.g., Kaspi & Netzer 1999), here we use . Since the gas of BLR will also Thomson scatter the central accretion disk radiation to form the diffuse radiation from the BLR, the density can be estimated by using the radial Thomson depth (Dermer et al., 2009), where is the Thomson cross section and is the distance from the central black hole, here we use which is the typical value (e.g., Donea & Protheroe 2003; Finke & Dermer 2010a). For the radiation field of standard accretion disk described by the multi-color blackbody spectrum, its luminosity in the stationary frame is
| (6) |
where is the electron Compton wavelength and is the outer radius of the accretion disk. Therefore, the differential energy density per one solid angle of BLR-scattered photon field is
| (7) |
where is classic electron radius, is the distance from the emission blob to the central black hole, and is the function given by Dermer et al. (2009) (their Eq.(97)). From equation (7), the specific energy density of BLR-scattered photon field depends on the angle, , between the directions of the photons and the electrons, where .
The spectrum of the EC process is given by
where and . The inverse Compton kernel is , , and (Dermer et al., 2009).
For a FSRQ, the thermal emission may be significant, so we also take the thermal contribution from the standard accretion disk into account. Therefore, the local spectrum for total emission from a FSRQ is
| (9) |
2.2 Photon Absorption
In above descriptions, we did not considered the absorption of high energy photons. In fact, there are two possible absorption processes: internal and external. For the internal absorption, since the photons from BLR and accretion disk not only provide target radiation fields for IC process to produce -ray emission, but also attenuate -rays through the pair-production process, the internal absorption should be taken into account. The internal absorption optical depth in the radiation fields of the disk and the BLR. is given by Dermer et al. (2009)
where is the pair-production cross section (e.g., Gould & Schréder 1967; Dermer et al. 2009). On the other hand, there is also the absorption in the blob itself, i.e., the absorption due to the interaction with the internal synchrotron radiation field (e.g. Sitarek & Bednarek 2007). In this case, the internal absorption optical depth is given by Finke et al. (2008)
| (11) |
where Hz and is given by Eq. 2.
| Name | ||||||||||||
|---|---|---|---|---|---|---|---|---|---|---|---|---|
| 0.86 | 0.15 | 400 | 3.2E3 | 5.0E4 | 2.0 | 4.0 | 25 | 8.13E16 | 16.1 | 0.03 | 4.07E17 | |
| 1.0 | 0.18 | 720 | 3.3E3 | 5.0E4 | 2.0 | 3.8 | 24 | 1.0E16 | 8.29 | 0.06 | 3.25E17 | |
| 2.12 | 0.2 | 980 | 3.1E3 | 5.0E4 | 2.0 | 4.5 | 25 | 4.79E15 | 10 | 0.02 | 2.03E17 | |
| 2.94 | 0.22 | 1.86E3 | 3.5E3 | 5.0E4 | 2.0 | 4.8 | 23 | 2.1E16 | 10 | 0.06 | 3.99E17 | |
| 0.92 | 0.18 | 400 | 3.0E3 | 1.5E4 | 2.0 | 5.0 | 26 | 1.23E16 | 32.4 | 0.01 | 3.01E17 | |
| 1.0 | 0.2 | 810 | 3.1E3 | 4.0E4 | 2.0 | 5.0 | 26 | 4.37E15 | 25.1 | 0.01 | 2.22E17 | |
| 2.07 | 0.24 | 1.3E3 | 2.0E3 | 2.2E4 | 2.0 | 5.0 | 23 | 4.27E15 | 45 | 0.02 | 8.99E17 | |
| 1.42 | 0.24 | 1.1E3 | 2.oE3 | 2.2E4 | 2.0 | 5.0 | 23 | 1.58E16 | 20 | 0.02 | 2.72E17 | |
| 4C 01.28 | 0.89 | 0.24 | 380 | 2.0E3 | 9.0E3 | 2.0 | 4.0 | 23 | 2.0E16 | 17.8 | 0.02 | 2.84E17 |
| 4C 28.07 | 1.21 | 0.24 | 920 | 2.0E3 | 9.0E3 | 2.0 | 4.0 | 23 | 3.47E15 | 10 | 0.03 | 2.29E17 |
| 2.19 | 0.25 | 760 | 2.0E3 | 9.0E3 | 2.13 | 4.0 | 32 | 8.71E15 | 75.8 | 0.05 | 9.81E17 | |
| 4C 29.45 | 0.73 | 0.22 | 760 | 2.0E3 | 3.0E4 | 2.13 | 4.0 | 22 | 4.57E15 | 12.9 | 0.02 | 2.42E17 |
| 3C 273 | 0.16 | 0.22 | 210 | 800 | 1.25E3 | 2.0 | 5.0 | 16 | 1.7E16 | 10 | 0.4 | 7.6E17 |
| 0.36 | 0.22 | 355 | 850 | 1.7E3 | 2.05 | 5.0 | 16 | 3.16E16 | 13.5 | 0.02 | 1.7E17 | |
| 1.0 | 0.18 | 550 | 3.3E3 | 1.2E5 | 2.0 | 3.8 | 24 | 1.38E16 | 3.98 | 0.03 | 1.61E17 | |
| 1.84 | 0.18 | 1.15E3 | 3.3E3 | 1.5E5 | 2.0 | 3.8 | 26 | 1.32E16 | 31.6 | 0.02 | 3.13E17 | |
| 1.49 | 0.22 | 355 | 850 | 3.7E3 | 2.0 | 5.0 | 16 | 3.47E16 | 50 | 0.01 | 1.38E17 | |
| 4C 66.20 | 0.66 | 0.18 | 430 | 3.3E3 | 7.0E4 | 2.0 | 3.8 | 26 | 1.17E16 | 41.5 | 0.01 | 3.09E17 |
| OX 169 | 0.21 | 0.18 | 370 | 3.3E3 | 6.3E4 | 2.0 | 3.8 | 26 | 1.48E16 | 9.54 | 0.01 | 2.2E17 |
| 1.84 | 0.15 | 1.4E3 | 2.0E3 | 2.2E4 | 2.0 | 5.0 | 23 | 5.37E15 | 20 | 0.03 | 3.3E17 | |
| 0.62 | 0.15 | 1.23E3 | 2.0E3 | 2.2E4 | 2.0 | 4.0 | 23 | 2.14E15 | 10 | 0.01 | 1.52E17 |
For the external absorption, because high energy photons emitted from any FSRQ will interact with extragalactic background light (EBL) in the propagation in the extragalactic space and then are absorbed through the pair-production process (e.g., Stecker et al. 1992; Finke et al. 2010b), such an absorption should be taken into account. Here we adopt the EBL model of Finke et al. (2010b) to get the optical depth of a -ray photon with energy at redshift , .
Therefore the photons flux observed at the Earth is
where is given by Eq. (9).
3 Applications
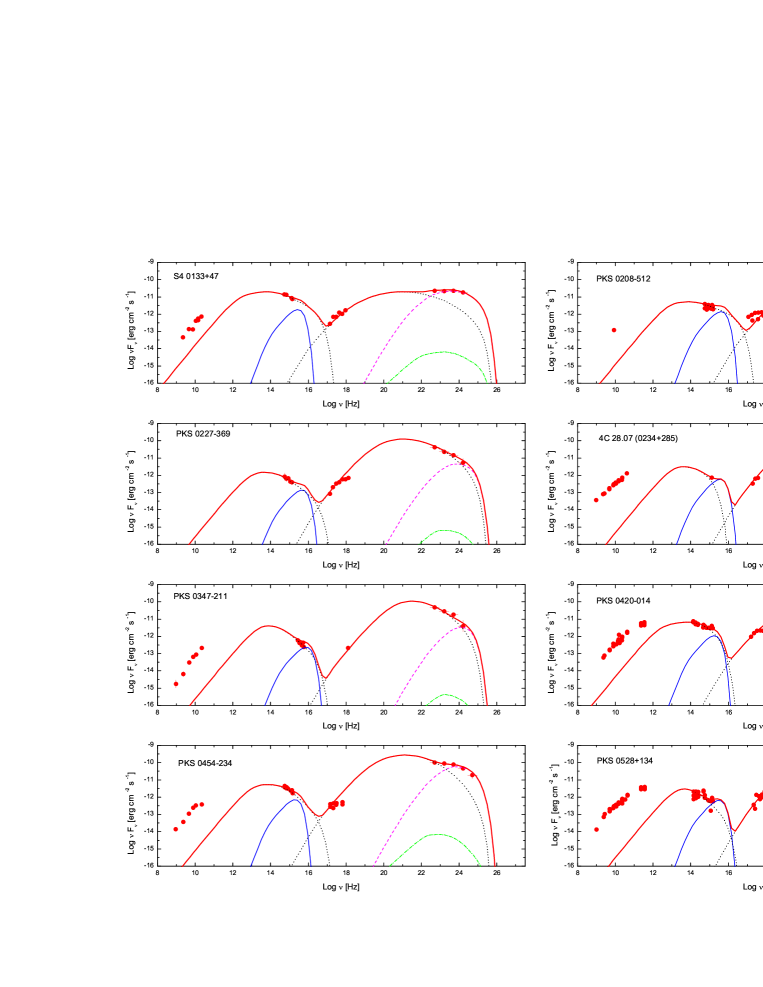
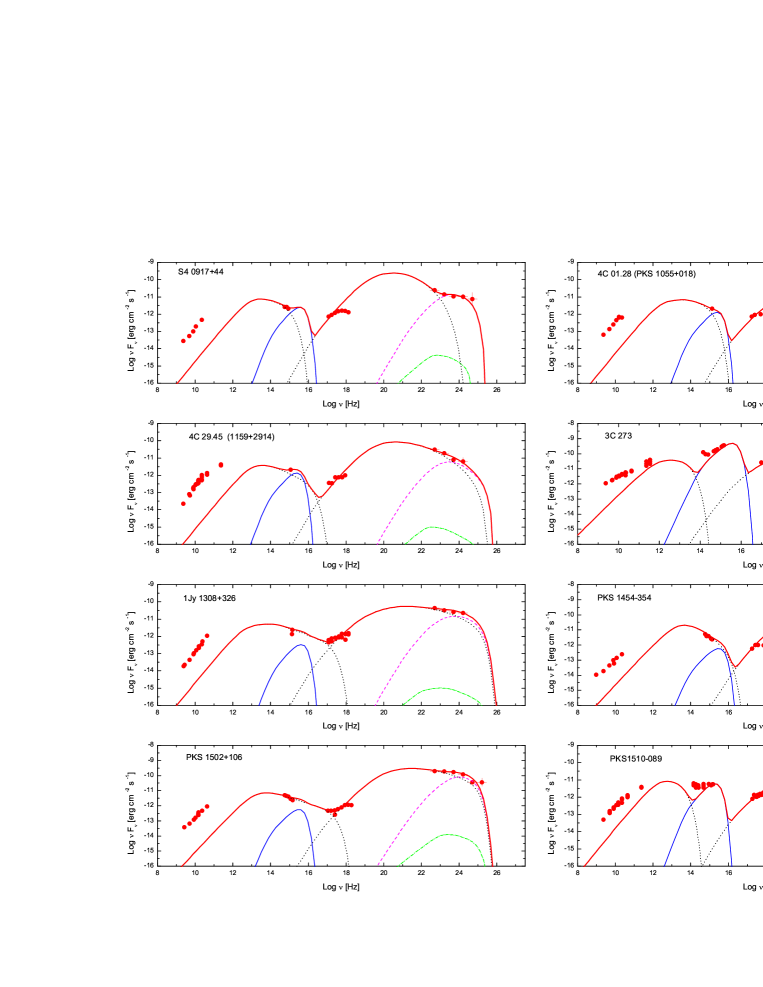
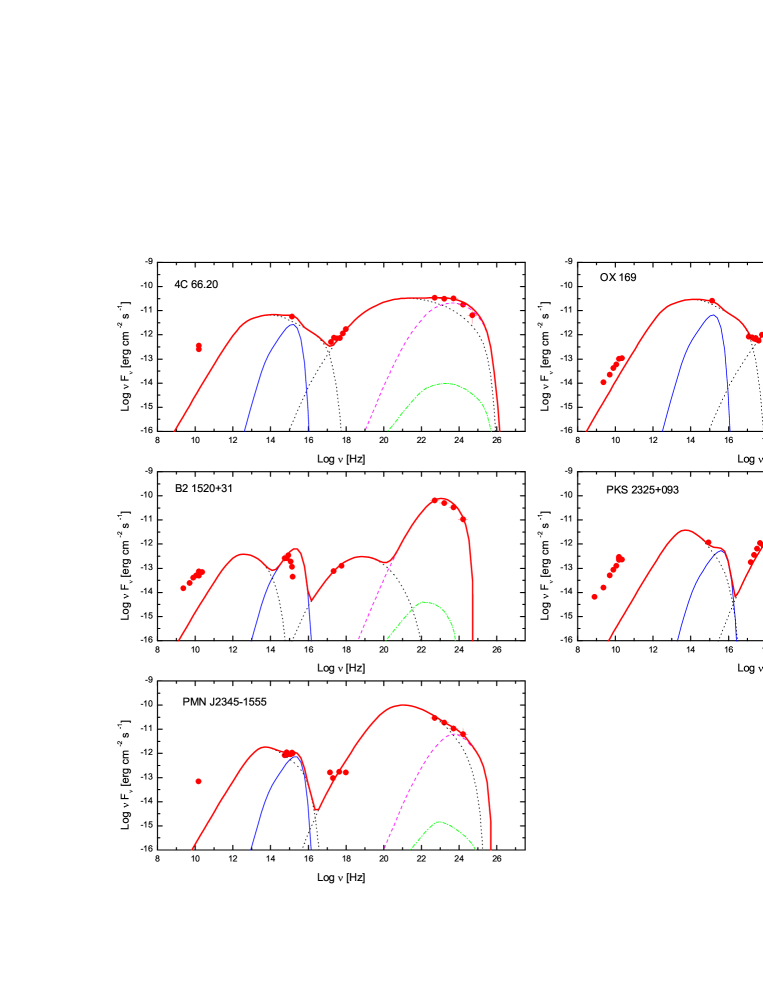
We now apply the model describes in Section 2 to reproduce the quasi-simultaneous multi-frequency SEDs of 21 FSRQs. The observed data of these 21 FSRQs are taken from Abdo et al. (2010a). In fact, Giommi et al. (2011) construct simultaneous multi-frequency SED of 105 blazars, however, most of these blazars were observed for short time, and the numbers of collected high energy photons are small. Hence, most of these blazars only have upper limit of the GeV flux, which are not helpful for our goal. Six FSRQs in the sample of Giommi et al. (2011) having three or four GeV data points are 0420-01, 0454-234, 4C 29.45, 3C 273, 1308+326 and 1502+106, which are also presented in the sample of Abdo et al. (2010a).
The modelling results are shown in Figs. 1– 3. It can be found that our models can reproduce well the quasi-simultaneous emission from optical–X-ray to GeV band of most FSRQs. Our model can not reproduce very well the optical or X-ray spectrum of several sources (marked with in Table 1). We believe that the bad reproduction at optical band of PKS 1510-089 is caused by the fact that the observed optical data are contaminated by the emission from its host galaxy. For the source B2 1520+31, it seems that the standard accretion disk model we used here does not adapt to describe its UV emission. The observed X-ray spectrum of these sources 0208-512, 0227-369, 0420-014, 0454-234, 0917+449, and 2345-1555 become flat at several keV band, which can not be reproduced by our model. In fact, the relativistic electron distribution with a large can possibly explain such a spectrum (Tavecchio et al., 2009). The model parameters are listed in Table 1. The same values of , , and are used for all sources in our sample, which are not listed in Table 1. The black hole masses of 0420-014, 1510-089 and 4C 66.20 (1849+64) are taken from Gu, Cao, & Jiang (2001). The black hole masses of 4C 01.28 (1055+018), 0917+449, 4C 29.45, 1308+32, 1502-106 and OX 169 are taken from Chen et al. (2009). The black hole masses of the other sources are derived through modelling SEDs. It should be noted that the thermal emission of PKS 1510-089, 3C 273 and B2 1520+31 are so significant that the optical-UV emission are purely from the thermal emission. Meanwhile, they have the smallest value of and . This indicates that the environment around the blob have a significant effect on the distribution of electrons in blob and the cooling of the electrons are dominated by EC process for these sources.
From Table 1, we can find that the black hole masses are in the range (1–6), the accretion luminosity of most of our sources are in the range 0.01 – 0.05 (only one source 3C 273 requires the accretion luminosity larger than 0.1), and the disk luminosity cluster around . For the high energy electron’s distribution, we find that the values of the are in the range 400–1500, which are quite larger than the results derived by Ghisellini et al. (2010), indicating some clues to the acceleration and cooling processes of the electrons (Tavecchio et al., 2009; Katarzyński et al., 2006). From Table 1, it’s found that clusters around , and besides three sources with , 8 sources have and 10 sources have . For the magnetic field of radiation region, their values are distributed in a narrow range 0.15 – 0.25 G, which are far smaller than the results found by Ghisellini et al. (2010). The small magnetic field means inefficient synchrotron cooling, which are consistent with the results of large and . The values of Doppler factor we derived range from 16 to 32, which is in the range reported by Savolainen et al. (2010).
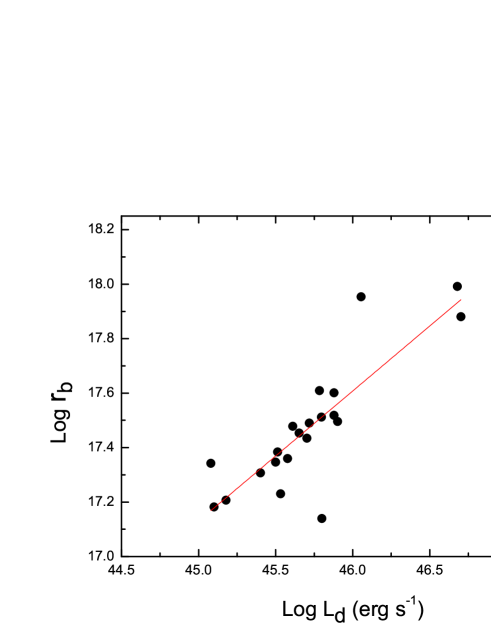
We now consider the relationships among size of the blob, , and the location of the blob. It is expected that relates to by , where is the opening angle of jet. However, we find that there is no correlation between and (see Fig. 4). The possible large distribution of in our sample would disturb the expected correlation. On the other hand, this fact may support either the scenario of the -ray produced in a more compact region embedded in jet (Giannios, Uzdensky, & Begelman, 2009; Tavecchio et al., 2011) or the re-collimation of the flow (Bromberg & Levinson, 2009). In our sample, we find that there is a strong correlation between and with correlation coefficient and a chance probability (Fig. 5). This correlation is caused by the fact that cluster around (top panel in Fig. 6).
Our results confirm the well known cognitive that EC process is important for -ray emissions of the FSRQs. The contribution of EC component to -ray emission of the FSRQ is dominated by BLR component, which is determined by the location of the emission region (blob) and BLR structure. Therefore, -ray emission of the FSRQ can be used to constrain the location of emission blob. In Fig. 6, we present the distribution of the locations of emission regions of 21 FSRQs. We find that all these sources have and the emission region of 19 out of 21 are outside of the BLR with the typical assumptions of BLR structure, i.e., their blobs are located in the distance range of .


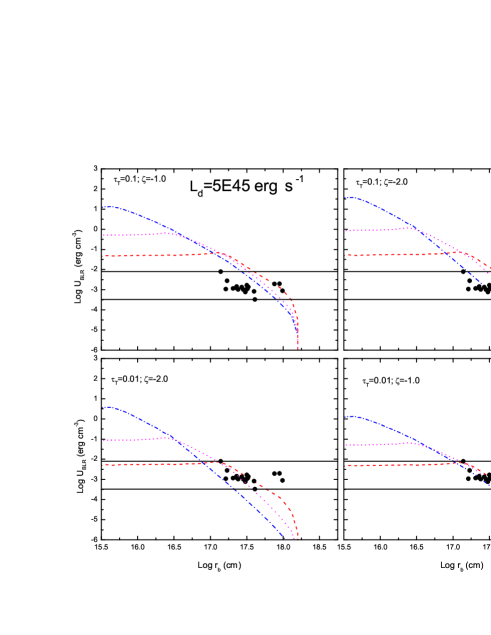
Since the EC component relates to the differential energy density per one solid angle of BLR photon field and depends on the BLR structure. We now discuss the uncertainty due to the parameters (, , and ) describing the BLR structure. For these three parameters, there is little observed information. Except for the typical values of BLR structure we used, there are alternative values for these parameters. In a wind model for BLR suggested by Murray & Chiang (1995) and Elvis (2000), the value of should be -2. The alternative extreme values of is 0.1 (Dermer et al., 2009). The width of the BLR is poorly known, we will consider the cases of , which are corresponding to a very thin BLR shell, a moderate thin BLR shell and a thick BLR shell, respectively. From the observed -ray flux, the energy density of BLR photon field required to reproduce the SEDs can be derived,
| (13) |
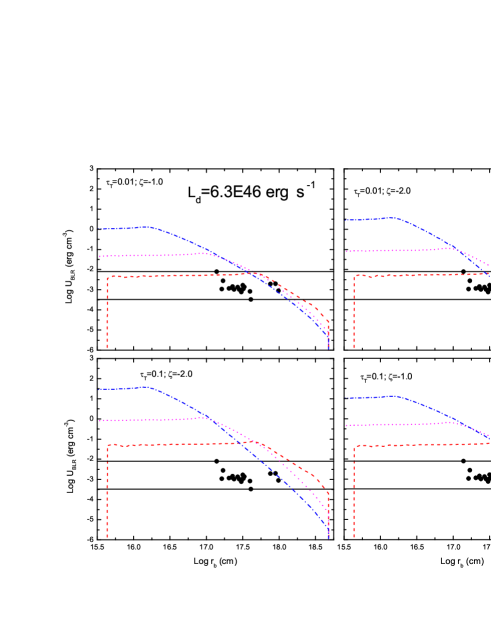
We find that the values of are restricted in the range of – in our sample. Hence, no matter what assumption about the BLR structure we make, the allowed location of emission region would make the value of in the above range. In Fig. 7, we show the relationship between energy densities of BLR-scattered photon field with different parameters for the BLR structure and the locations of emission regions with typical values in our sample, where we assume that and (i.e. ). We find that the smallest allowed value of cm is derived when , and . With , and , the largest allowed value of cm is obtained. Since there are three sources with high accretion disk luminosity () in our sample, and the accretion disk luminosity has a affect on constraining the location of blob, we also discuss the case of high accretion disk luminosity with and . The results are shown in Fig. 8. It is found that the allowed value of is in the range – cm.
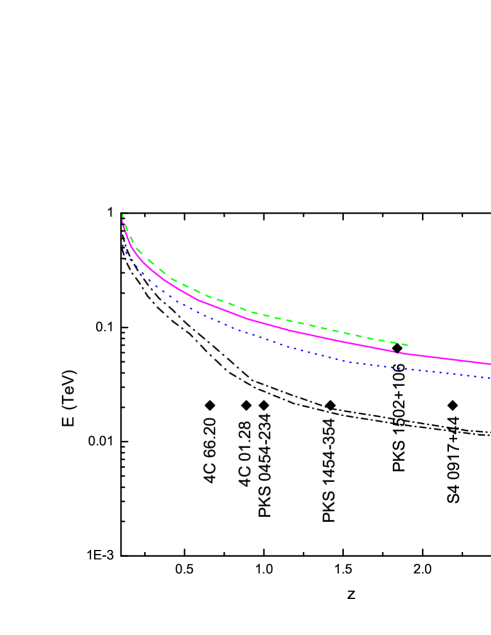
Finally, we consider the roles of both internal and external absorptions. For the internal absorptions in our sample, we find that they are negligible in reproducing the SEDs. As examples, in Fig. 9, we show the internal optical depths in the radiation fields of the disk and the BLR for three sources (B2 1520+31, PKS 0528+134, and OX 169) and those in the synchrotron radiation fields for PKS 0528+134, PKS 0347-211, and PKS 0227-369. From Fig. 9, B2 1520+31 has a largest value of due to its high energy density of external photon field, , which becomes significant for photons with Hz. As to PKS 0528+134 and OX 169 in Fig. 9, the former has the intermediate optical depth and the latter has the lowest optical depth in our sample. We expect that the -ray spectrum between 0.1 – 10 GeV could not be reproduced well if the energy density of BLR photon field exceeds . For the absorption in blob itself, we show largest values of the optical depths, , in our sample, it can be seen that these absorptions are negligible in our sample. On the other hand, the fact that there is no significant spectral cutoff between 10 - 100 GeV for FSRQs (Costamante, 2011; Ackerman et al., 2011) also supports the minimum value of we derived. For the external absorption, it depends on the EBL models, so different models will make some differences, in particular, for higher redshifts. We found that 15 sources have the maximum gamma-ray energy GeV, 5 sources have GeV, and 1 source has GeV in our sample. Therefore, we calculate the external optical depths for six sources (4C 66.20, 4C 01.28, PKS 0454-234, PKS 1454-354, PKS 1502+106, and S4 0917+44 ) with GeV using four kinds of the EBL models given by Kneiske et al. (2004), Stecker et al. (2006), Franceschini et al. (2008), and Finke et al. (2010), respectively, and show the results in Fig. 10. It can be seen that our modelled SEDs for three sources with are not affected by the EBL models, but the SEDs for the sources (PKS 1454-354, PKS 1502+106, and S4 0917+44 ) with will be different for different EBL models, particularly, for the EBL model given by Stecker et al. (2006). However, the EBL model given by Stecker et al. (2006) has been ruled out by Fermi-LAT observations (Abdo et al. 2010c). For PKS 1502+106, the optical depth given by Kneiske et al. (2004) could be slightly larger than that expected by Finke model, which would lead to slightly difference for modeling the SED of PKS 1502+106. Considering the specific SED of PKS 1502+106, we expect that this difference has no effect on our results.
4 Conclusions

In this paper, we have modeled the quasi-simultaneous multi-band spectra of 21 Fermi FSRQs in the frame of a multi-component one-zone leptonic emission model, and studied the locations of emission regions of the FSRQs in particular. We have found that the emission regions lie in the region of – cm (300 – 4300 Schwarzschild radii) for FSRQs with low accretion disk luminosity, and the emission regions locate in the larger region of – cm (300 – 5600 Schwarzschild radii) for ones with high accretion disk luminosity. Our results are consistent with the results of Tavecchio et al. (2010) derived by analyzing the variability timescale and that of Liu, Bai, & Ma (2008) and Bai et al. (2009) obtained by discussing internal absorption. Our results disfavor the far dissipation scenario suggested by e.g., Marscher et al. (2010), in which -rays are produced at larger distance (10 pc) from black hole. At such large distance, the external radiation field for IC process are dominated by the emission from the dusty torus with Hz and (Ghisellini & Tavecchio, 2008). As we discussed above, the observed -ray flux requires that the energy density of external radiation field for IC process should be larger than with the moderate Doppler factor, which is inconsistent with the far dissipation scenario. Moreover, the observed variability on timescale of 10 min of PKS 1222+216 (Aleksić et al., 2011; Tavecchio et al., 2011) requires quite fast IC cooling, which also challenges the far dissipation scenario considering lower energy infrared photons as seed photons.
We did not consider the target photons from BLR emission line in this work. Luminosity of the BLR emission line is comparable with or larger than that of the BLR Thomson scatted photons radiation between - Hz in the BLR zone (Tavecchio & Ghisellini, 2008; Sbarrato et al., 2011), which would make the locations of the emission regions we derived closer to the central black hole than the real ones. Based on the above discussion, we can roughly estimate that how much the emission line radiation affect our results. From our results, we can see that when the energy density of BLR-scattered photons field increases by 10 times (corresponding to varying from to , Figs. 7 and 8), the range of the emission region locations increases by 3 times. Therefore, if the energy density of the BLR emission line photon field is 10 times that of the BLR Thomson scatted photons field, we expect the locations of the emission regions possibly will locate in the range – cm and – cm for low and high accretion luminosity FSRQs, respectively. The detail contribution of BLR emission line will be studied in the future work.
Acknowledgments
This work is partially supported by a 973 Program (2009CB824800), the National Natural Science Foundation of China (NSFC 10963004, 11063003), and Yunnan Province under a grant 2009 OC.
References
- Abdo et al. (2010a) Abdo, A. A. et al. 2010a, ApJ, 716, 30
- Abdo et al. (2010b) Abdo, A. A. et al. 2010b, ApJ, 710, 1271
- Abdo et al. (2010c) Abdo, A. A. et al. 2010c, ApJ, 723, 1082
- Ackerman et al. (2011) Ackerman, M. et al. 2011, ApJ, 743, 171
- Aleksić et al. (2011) Aleksić, J. et al., 2011, ApJL, 730, L8
- Bai et al. (2009) Bai, J. M., Liu, H. T., & Ma, L. 2009, ApJ, 699, 2002
- Bentz et al. (2009) Bentz, M. C. et al. 2009, ApJ, 697, 160
- Böttcher (2007) Böttcher, M. 2007, Ap&SS, 309, 95
- Bromberg & Levinson (2009) Bromberg, O.,& Levinson, A. 2009, ApJ, 699, 1274
- Chen et al. (2009) Chen, Z., Gu, M., Fan, Z., Cao, X. 2009, Res. Astron. Astrophys., 9, 1192
- Costamante (2011) Costamante, L. 2011 Fermi Symposium, Roma.
- Dermer & Schlickeiser (1993) Dermer, C. D., & Schlickeiser, R. 1993, ApJ, 416, 458
- Dermer et al. (2009) Dermer, C. D., Finke, J. D., Krug, H., & Böttcher, M. 2009, ApJ, 692, 32
- Donea & Protheroe (2003) Donea, A. C., & Protheroe, R. J. 2003, APh, 18, 377
- Elvis (2000) Elvis, M. 2000, ApJ, 545, 63
- Finke et al. (2008) Finke, J. D., Dermer, C. D., & Böttcher, M. 2008, ApJ, 686, 181
- Finke & Dermer (2010a) Finke, J. D., & Dermer, C. D., 2010a, ApJ, 714, 303
- Finke et al. (2010b) Finke, J. D., Razzaque, S., & Dermer, C. D. 2010b, ApJ, 712, 238
- Franceschini et al. (2008) Franceschini, A., Rodighiero, G., & Vaccari, M. 2008, A&A, 487, 837
- Inoue & Takahara (1996) Inoue, S., & Takahara, F., 1996, ApJ, 463, 555
- Ghisellini & Tavecchio (2008) Ghisellini, G., & Tavecchio, F., 2008, MNRAS, 387, 1669
- Ghisellini & Tavecchio (2009) Ghisellini, G., & Tavecchio, F. 2009, MNRAS, 397, 985
- Ghisellini et al. (2010) Ghisellini, G., Tavecchio, F., & Foschini, L. et al. 2010, MNRAS, 402, 497
- Ghisellini et al. (2011) Ghisellini, G., Tagliaferri, G., &Foschini, L. et al. 2011, MNRAS, 411, 901
- Giannios, Uzdensky, & Begelman (2009) Giannios, D., Uzdensky, D. A., Begelman, M. C. 2009, MNRAS, 395, L29
- Giommi et al. (2011) Giommi, P. et al., 2011, arxiv:1108.1114
- Gould & Schréder (1967) Gould, R. J., & Schréder, G. P. 1967, Phys.Rev., 155,1404
- Gu, Cao, & Jiang (2001) Gu, M. F., Cao, X. W., & Jiang, D. R. 2001, MNRAS, 327, 1111
- Kaspi & Netzer (1999) Kaspi, S., & Netzer, H. 1999, ApJ, 524, 71
- Kaspi et al. (2000) Kaspi, S., Smith, P. S., Netzer, H., et al. 2000, ApJ, 533, 631
- Kaspi et al. (2005) Kaspi, S., Maoz, D., Netxer, H., Peterson, B. M., Vestergaard, M., Jannuzzi, B. T. 2005, ApJ, 629, 61
- Katarzyński et al. (2006) Katarzyński, K., Ghisellini, G., Tavecchio, F., Gracia, J., & Maraschi, L. 2006, MNRAS, 368, L52
- Kneiske et al. (2004) Kneiske, T. M., Bretz, T., Mannheim, K., & Hartmann, D. H. 2004, A&A, 413, 807
- Liu, Bai, & Ma (2008) Liu, H. T., Bai, J. M., Ma, L. 2008, ApJ, 688, 148
- Liu et al. (2011) Liu, H. T., Bai, J. M., & Wang, J. M. 2011, MNRAS, 414, 155L
- Mannheim (1993) Mannheim K., 1993, A&A, 269, 67
- Maraschi et al. (1992) Maraschi, L., Ghisellini, G., & Celotti, A. 1992, ApJL, 397, L5
- Marscher et al. (2010) Marscher, A. P. et al. 2010, ApJ, 710, L126
- Murray & Chiang (1995) Murray, N., & Chiang, J. 1995, ApJ, 454, L105
- Mücke et al. (2003) Mücke, A., Protheroe, R. J., Engel, R. et al. 2003, APh, 18, 593
- Paltani & Turler (2005) Paltani, S., & Turler, M. 2005, A&A, 435, 811
- Poutanen et al. (2010) Poutanen, J, & Stern, B. 2010, ApJ, 717, 118
- Rees (1967) Rees, M. J. 1967, MNRAS, 137, 429
- Savolainen et al. (2010) Savolainen, T. et al. 2010, A&A, 512A, 24
- Sbarrato et al. (2011) Sbarrato, T. 2011, arxiv: 1108.0927
- Stecker et al. (1992) Stecker, F. W., de Jager, O. C., & Salamon, M. H. 1992, ApJ, 390, L49
- Stecker et al. (2006) Stecker, F. W., Malkan, M. A., & Scully, S. T. 2006, ApJ, 648, 774 ( Erratum, ApJ, 658, 1392 [2007])
- Sitarek & Bednarek (2007) Sitarek, J., & Bednarek, W. 2007, Ap&SS, 309, 105
- Sitarek & Bednarek (2008) Sitarek, J., & Bednarek, W. 2008, MNRAS, 391, 624
- Sikora et al. (1994) Sikora, M., Begelman, M. C., & Rees, M. J. 1994, ApJ, 421, 153
- Sikora et al. (2008) Sikora, M., Moderski, R., & Madejski, G. M. 2008, ApJ, 675, 71
- Tavecchio & Ghisellini (2008) Tavecchio, F., Ghisellini, G. 2008, MNRAS, 386, 945
- Tavecchio et al. (2009) Tavecchio, F., Ghisellini, G., Ghirlanda, G., Costamante, L., & Franceschini, A. 2009, MNRAS, 399, 59
- Tavecchio et al. (2010) Tavecchio, F., Ghisellini, G., Bonnoli G., Ghirlanda, G. 2010, MNRAS, 405, 94
- Tavecchio et al. (2011) Tavecchio, F., et al. 2011, A&A, 534, 86
- Wandel et al. (1999) Wandel, A., Peterson, B. M., & Malkan, M. A. 1999, ApJ, 526, 579