Coexisting pseudogap, charge transfer gap, and Mott gap energy scales in the resonant inelastic x-ray scattering spectra of electron-doped cuprates
Abstract
We present a computation of Cu K-edge resonant inelastic x-ray scattering (RIXS) spectra for electron-doped cuprates which includes coupling to bosonic fluctuations. Comparison with experiment over a wide range of energy and momentum transfers allows us to identify the signatures of three key normal-state energy scales: the pseudogap, charge transfer gap, and Mott gap. The calculations involve a three band Hubbard Hamiltonian based on Cu and O , orbitals, with a self-energy correction which arises due to spin and charge fluctuations. Our theory reproduces characteristic features e.g., gap collapse, large spectral weight broadening, and spectral weight transfer as a function of doping, as seen in experiments.
Cuprates are widely believed to be charge-transfer insulatorsZSA , with a Mott gap between Cu- orbitals much larger than the charge transfer gap between Cu- and O- orbitals. The upper (UHB) and lower Hubbard band (LHB) of the Cu orbitals are intimately related to the antibonding and bonding bands of the three band model, and it is important to understand how the strong correlations of Mott physics modify these bands from the conventional LDA-based picture. Meanwhile, a third energy scale, the pseudogap scale, has been found experimentally, and its origin and relation to the other two scales continues to be a matter of intense debate. Here we model electron-doped (NCCO), for which the pseudogap is well described as a competing antiferromagnetic (AF) order.
Experimental access to the LHB and/or the bonding band has proven difficult and the corresponding optical interband transitions have not been observed. Moreover, while the antibonding band lies at the top of the -bands, the bonding band is found in LDA to lie at the bottom of a veritable ‘spaghetti’ of -bands and their associated oxygen orbitals, nearly eV below the Fermi level as seen in Fig. 1. Therefore, it is difficult to extract this band from ARPES data. On the other hand, RIXS is a local probe directly rearranging the Cu and O orbitals, and as such can provide selective access to the bonding bands. Indeed, RIXS experiments report a strong feature in most cuprates in the - eV range which has been associated with this band x0higherEcuts ; Hasan2 ; Kim ; Ishii2 ; Hasan3 ; simon . In this article we show that by incorporating strong renormalization of the near Fermi energy bands by magnon fluctuations water3 ; tanmoysw , the high-energy RIXS features are indeed consistent with transitions from the LHB to the UHB. This resolves a puzzling discrepancy in earlier calculations bobrixs which were unable to fit both the low and high energy parts of the spectrum. We also capture another important feature of the spectrum, the realistic broadening, which arises due to the strong coupling to bosonic quasiparticles.
Remarkably, we find that all three energy scales are strongly influenced by the Hubbard . The three energy scales are the following: 1) the Mott gap scale which is the result of transitions from LHB to UHB, 2) the charge transfer gap scale which persists as a residual feature into the overdoped regime and 3) the pseudogap or AF gap scale which collapses in a quantum critical point near optimal doping. For convenience, we label the AF-split subbands of the antibonding bands as the lower (LMB) and upper ( UMB) magnetic bands. Cuprate magnetism naturally separates into two regimes: at high energies Mott physics produces localized spin singlets on each copper site, splitting the Cu dispersion by an energy into upper and lower Hubbard bands. In the presence of hybridization with oxygens, the LHB [UHB] becomes identified with the bonding [antibonding] band of the three-band model. At lower energies, these singlets interact on different sites, leading to magnetic gaps in both UHB and LHB of magnitude via more conventional Slater physics associated with AF order, where is the magnetization on Cu. The Mott physics arises as an emergent phenomenon. When the AF gaps open at half filling, hybridization between Cu and O is mostly lost. For instance, in the antibonding band electrons in the UMB have mainly Cu character, while the opposite happens in the bonding band bobrixs . Consequently, the states near the top of the lower magnetic band are of nearly pure oxygen character bobrixs .Thus, due to strong correlations, the ‘charge-transfer’ gap at half filling coincides with the AF gap. At finite doping, these two features separate in energy: the AF gap collapses rapidly foot1 , while a residual charge-transfer gap persists in optical spectra at high energies, due to strong magnetic fluctuations, closely related to the high energy kink (HEK), or ‘waterfall’ effect seen in photoemission water3 ; basak . Here we show that this residual charge-transfer gap is also present in RIXS.
In K-edge RIXS the incident x-ray excites a Cu transition with an intermediate state shakeup involving mainly Cu and O states. Within the RPA framework, the RIXS cross section for this process is Igarashi ; bobrixs ; LiHasan
| (1) | |||||
Here is the initial photon energy (taken to be -5 eV) and , q are the energy and the momentum, respectively, which are transferred in the RIXS process. contains all the matrix-element information of the initial and final state transition probabilities bobrixs , is the total number of Cu atoms and is the position of the orbital present in the intermediate state. The nearest neighbor (NN) O excitations and second NN Cu excitations are included via and , respectively. We assume small values of , in this study, whereas is equal to 1. The transferred momentum and energy are then shared by the electron-hole pair created in the intermediate state from Cu and O bands, . In the Keldysh formalism it takes the form of a charge correlation function or the joint density of states (JDOS) (in real time) as with representing the charge operator. It is straightforward to show that can be calculated as the convolution between the spectral weights () of the filled and empty states Igarashi ; allen as
| (2) | |||||
where is Fermi function and is the spin index. The prime in the summation means that the summation is restricted to the AF zone.
RIXS spectra are calculated using Eq. 2 in which the spectral weight is computed using a three-band Hubbard model with the Hamiltonian:
| (3) | |||||
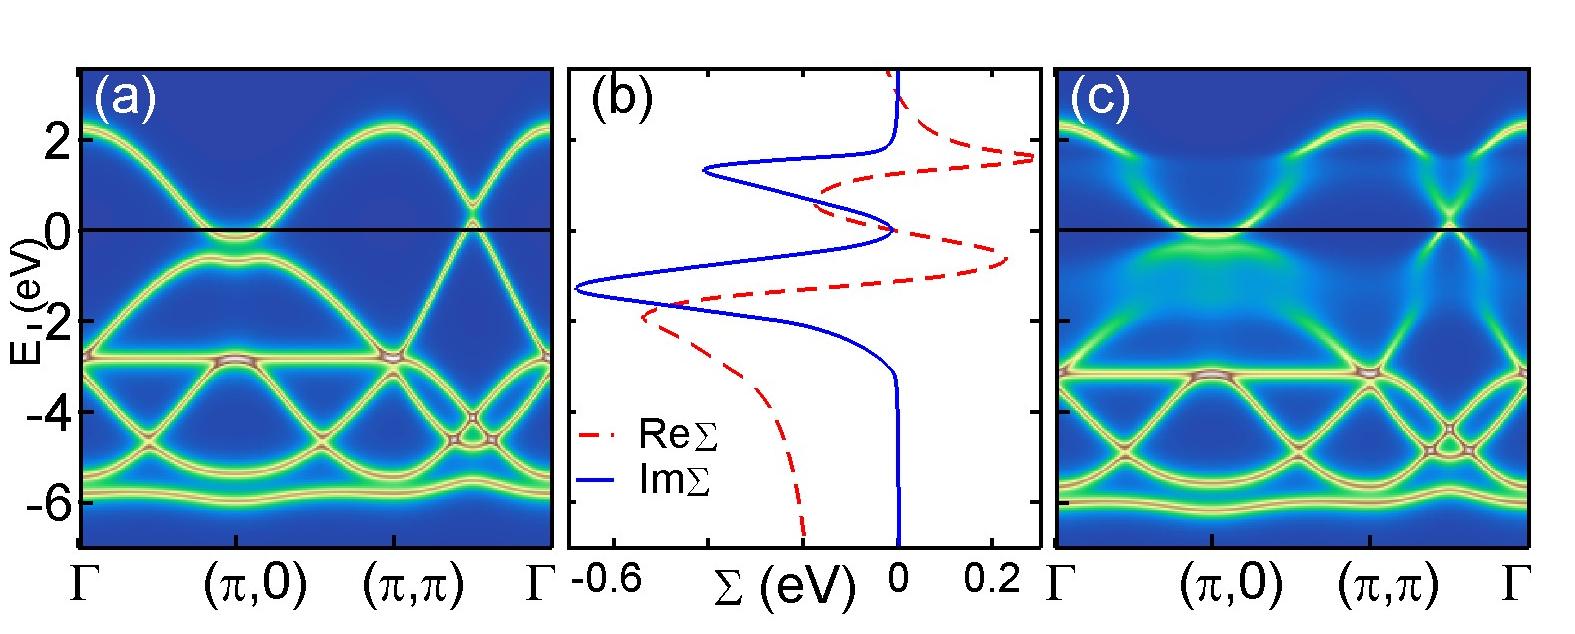
where is the (bare) difference between the onsite energy levels of Cu and O , the copper-d oxygen-p hopping parameter, the oxygen-oxygen hopping parameter and () the Hubbard interaction parameter on Cu (O). and are the number operators for Cu-d and O-p electrons, respectively. The equations were solved at Hartree-Fock (HF) level to obtain a self-consistent mean-field solution. Hartree corrections lead to a renormalized Cu-O splitting parameter where () is the average electron density on Cu(O) foot2 . The AF order splits the three bands into six bands as seen in Fig. 1(a). Since self-energy corrections are explicitly included, we use bare LDA-like dispersions foot2 in the three-band model rather than the dressed, experimental dispersions bobrixs . Thus hopping parameters are taken from LDA while interaction parameters and are adjusted to optimize agreement between the antibonding band splitting and earlier one band results bobrixs ; foot2 ; footAB2 ; footAB3 ; OKA . When this is done, we find that is small and negative while has a very weak doping dependence foot3 .
The renormalization of the antibonding band due to bosonic fluctuations is calculated via a self-energy based on the QP-GW formalism SEtd ,
| (4) |
Here is the vertex correction and is the interaction term which includes both spin and charge fluctuations. AF order in included along the lines of Ref. basak, where the effective AF gap is kept the same as in the one band model. Finally the self-energy () is incorporated into the three band dispersion via Dyson’s equation and is computed from the dressed . Our calculation includes only fluctuations associated with the band closest to the Fermi level, which produces negligible broadening for eV. Therefore for higher energy bands we include a constant broadening, eV, consistent with the ARPES data lanzara .
Figure 1 shows how self energy effects modify the dispersion of the various bands of the three-band AF model for , comparing bare (a) and dressed (c) bands. The imaginary part of the self-energy, plotted in Fig. 1(b), attains a maximum around to eV, which leads to a strong broadening of the spectral weight in this energy range, both below and above the Fermi level (denoted by the black line), producing a characteristic kink or ‘waterfall’ effect in the dispersion. We will see in connection with Fig. 2 below that this ‘waterfall’ effect leads to a significant broadening in the RIXS spectrum since the spectrum of Eq. 2 involves a convolution of the filled and empty states. Fig. 1(c) also shows that the self-energy softens the low energy bands nearest the Fermi level. This renormalization should also show up in the lowest branch of the RIXS spectrum, but this is restricted to very low energies and does not appear prominently in Fig. 2.
Figure 2 shows the calculated RIXS spectra of NCCO for and , reflecting the modulation of the spectral intensities of Fig. 1 via matrix element effects, which are well known to be important in various highly resolved spectroscopies.footAB5 ; footAB7 ; footAB8 Frames (a) and (d) include AF order but without self energy corrections, whereas the calculations in frames (b) and (e) include the self energy. The high intensities at energies around eV involve the transition from the lower Hubbard band to the unoccupied states of the antibonding band, reflecting the Mott gap feature. This ‘6 eV’ feature is present for all dopings. At half filling, in frames (a) and (b), the high intensities around eV occur due to the transition within the antibonding Cu-O band across the AF gap. This gap collapses with doping and as a result we find a smaller AF gap at electron doping in frames (d) and (e), close to the QCP, consistent with earlier results LiHasan . A key result is that the self energy produces a realistic broadening comparable to that observed experimentally.
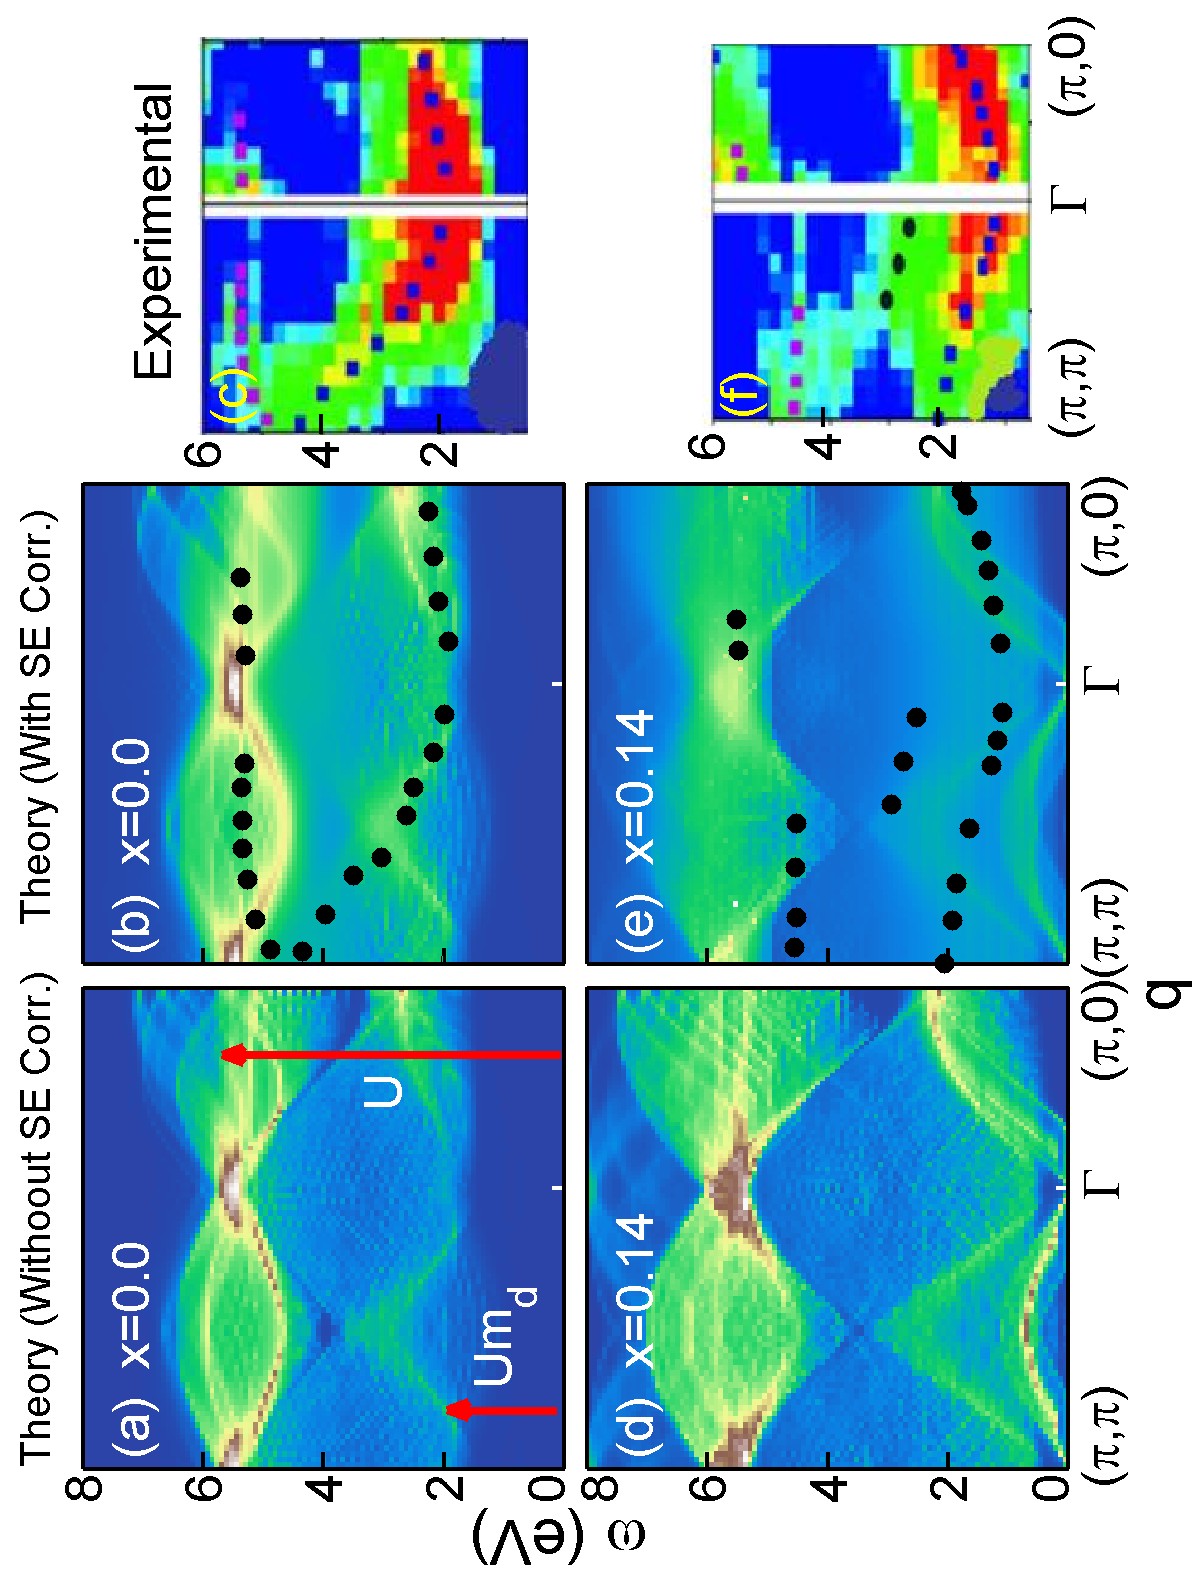
In the RIXS calculations, the 6 eV feature is the most intense in the spectrum, consistent with most early experiments on a variety of cuprates hill ; Abbamonte ; x0higherEcuts ; Hasan ; Ishii ; Lu , but more recent experimentsHill2 , including those of Figs. 2(c,f)Li , employ a range of where the 6 eV feature is suppressed and the lower energy features can be more easily probed. Except for this feature, most features in the calculated RIXS intensities follow the experimental trends. In the undoped cuprate in Fig. 2 (b), we observe a broad peak at around eV, with the intensity decreasing around the zone corner while it remains strong around . A similar level of agreement is found in the case of electron doping in Fig. 2 in panels (d)-(f) foot4 . The black dots in panels (b) and (e) represent the peaks of the experimental spectra, reproducing the blue, black, and purple dots of panels (c) and (f). The agreement is remarkable for both dopings, in frames (b) and (c) and in frames (e) and (f) foot8 . Results for =0.09 are similar, and are omitted for brevity.
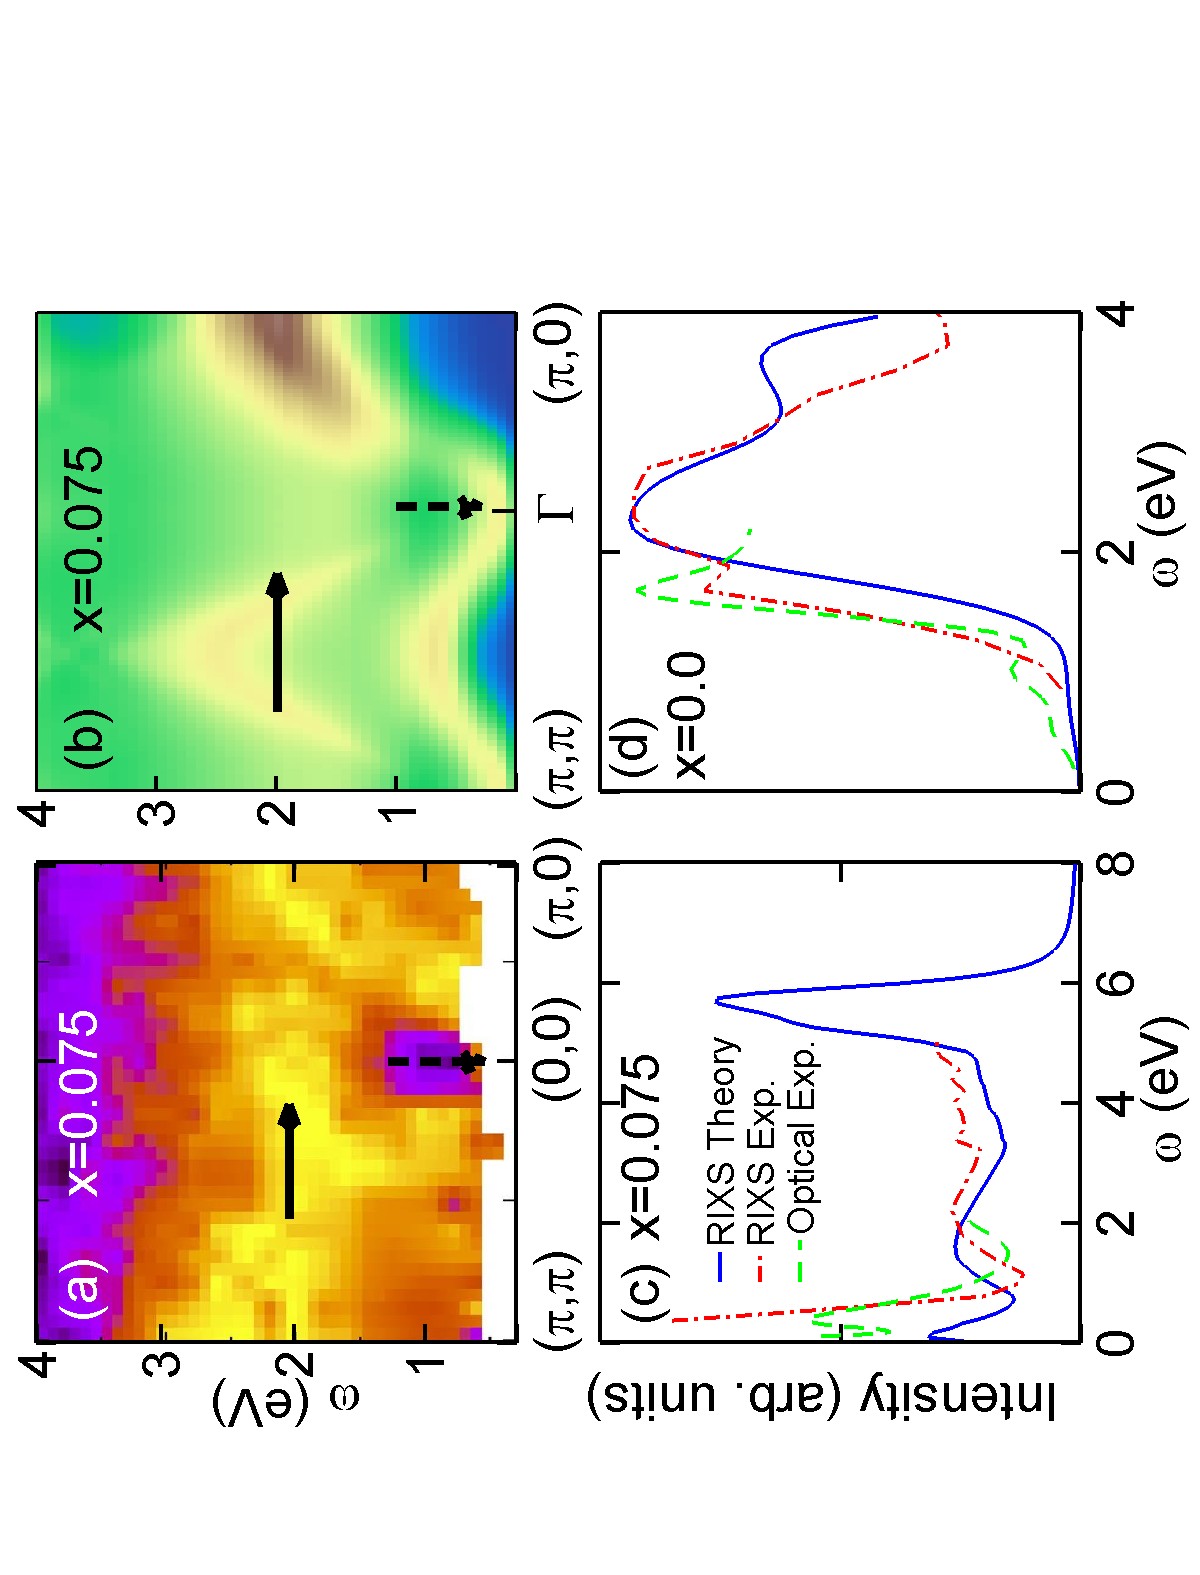
We comment here on the three energy scales. While the dispersions which follow from Eq. 3 are rather complicated, we find numerically that the Mott gap is approximately equal to and the AF gap to , as illustrated by arrows in Fig. 2(a). Also, the charge transfer energy is the difference between the average oxygen energy and the upper Cu band ZSA , which we find to be . Thus all three energy scales are controlled by . In our calculation the eV feature represents transitions across the true Mott gap, and the good agreement with experiment indicates that RIXS can be used to probe this important scale and how it is modified by hybridization with oxygens – is the bonding band split as our calculations suggest? This feature will be discussed further below when we describe fits to individual -cuts of the RIXS spectra. In optical spectra at half filling the 2 eV charge transfer gap is indistinguishable from the AF gaptanmoysw . At finite doping these two features separate, with the AF gap reflected as a midinfrared peak which collapses rapidly with doping, while a residual charge transfer gap persists as a weak feature near eV in the strongly doped regime. A similar evolution is found in RIXS. The RIXS leading edge follows the doping dependence of the AF gap bobrixs ; LiHasan , while in Fig. 3 we show that a residual charge transfer gap feature can be seen in the RIXS spectra near the point. Our three band calculation successfully reproduces the experimental finding that the magnetization scales with the AF gap Mang ; MarkieAF . Our calculated three-band RIXS spectrum modified by self-energy beautifully displays the broad feature around eV at in panel (b), in good agreement with experimental results in panel (a). Panels (c) and (d) display RIXS intensities obtained from theory (blue) as well as experiment (red dots) as a function of energy at , compared with the optical spectra onoseprb (green dashes) for and , respectively. The peak of experimental intensity is shifted towards slightly higher energy than the theoretical intensity, but the broadening is comparable in both cases.
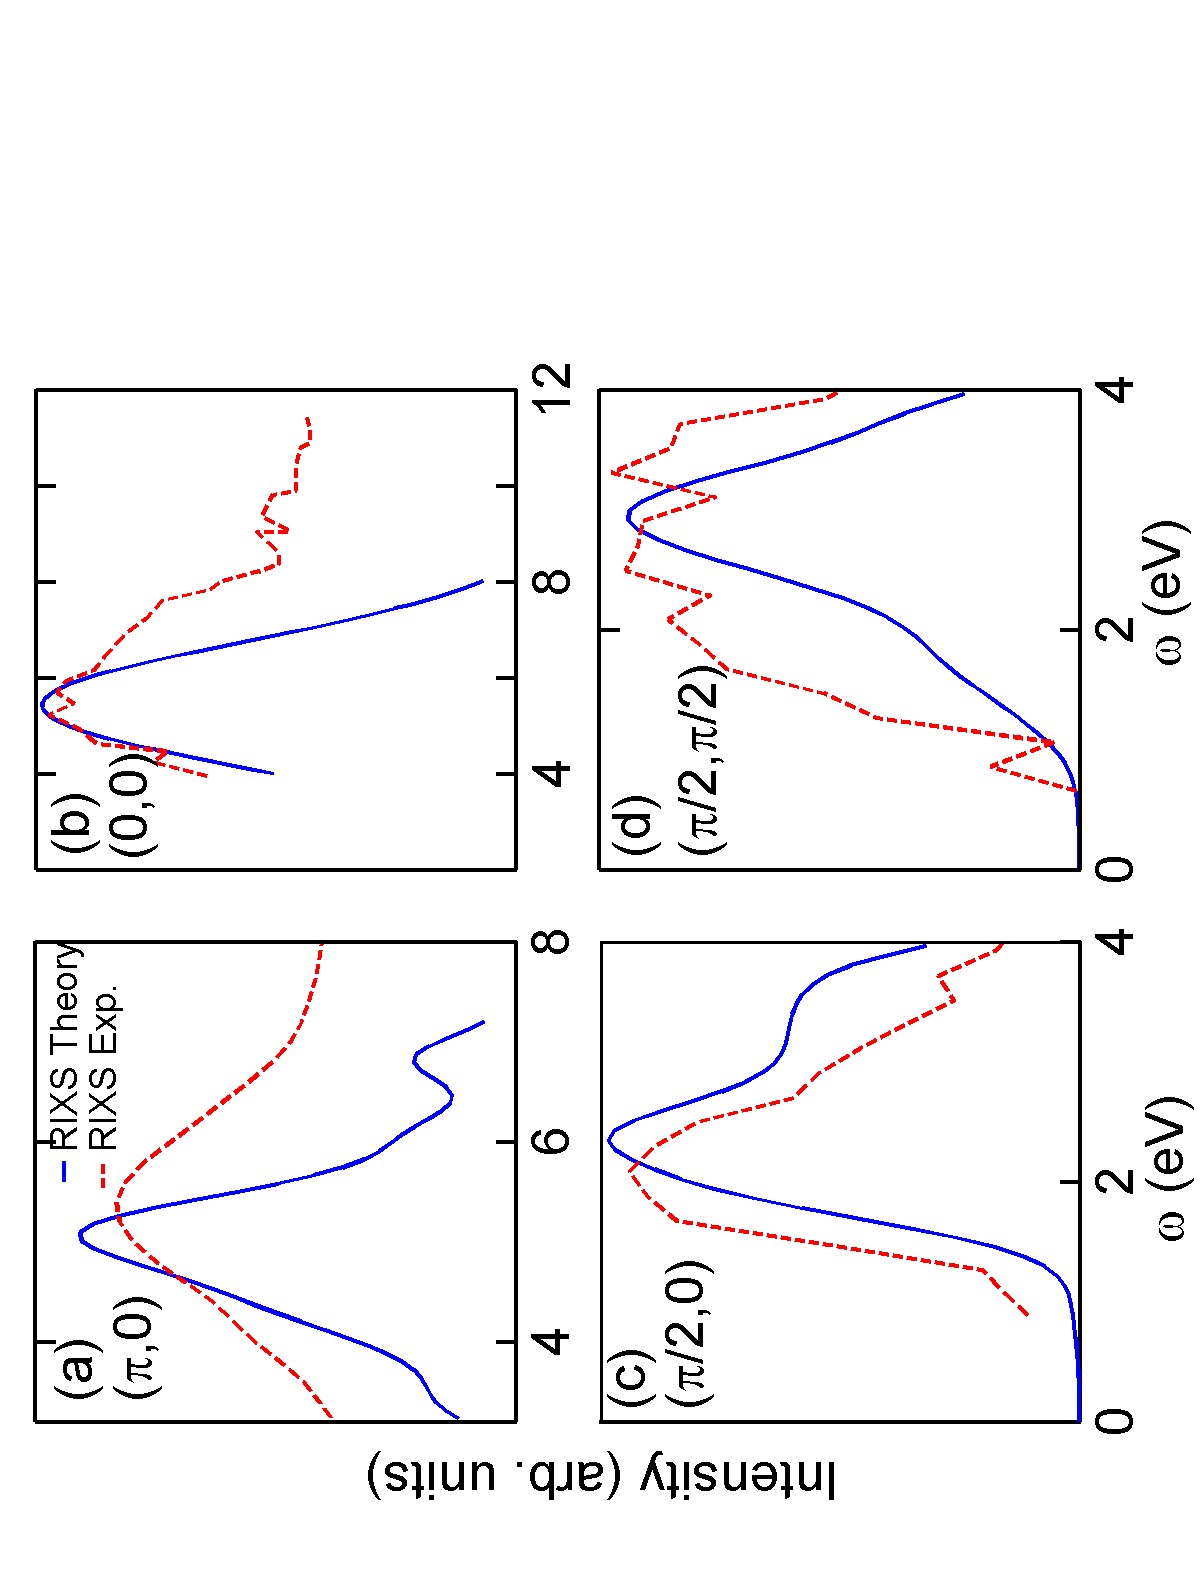
For more quantitative estimates of the broadening, Fig. 4 compares theoretical (blue solid) and experimental (red dashed line) RIXS intensities as a function of for several constant -cuts. There is an overall good agreement in peak positions as well as lineshapes and broadening for all momenta. In particular, panel (b) shows the high energy RIXS feature from Ref. x0higherEcuts . The good agreement with theory strongly suggests the identification of this feature with the LHB in NCCO. A similar peak is found in all cuprates, as would be expected for Mott physics.
In conclusion, we find that RIXS is a suitable probe across all energy scales, including AF gap, charge-transfer, and Mott physics. We provide a three-band model that is capable of explaining the experimental RIXS spectra over the entire energy and doping range. We find a good correspondence between the RIXS spectra at and the optical spectrum, but RIXS has the additional advantage of full momentum-space resolution. While we have concentrated on the electron doped cuprates, our model should apply equally well to the hole doped case.
Acknowledgements.
We thank A. Lanzara and A. Tremblay for very useful conversations. This work is supported by the U.S. Department of Energy, Office of Science, Division of Materials Science and Engineering grants DE-FG02-07ER46352 and DE-AC03-76SF00098, and benefited from the collaboration supported by the Computational Materials Science Network (CMSN) program under grant number DE-FG02-08ER46540, and from the allocation of supercomputer time at NERSC and Northeastern University’s Advanced Scientific Computation Center (ASCC).References
- (1) J. Zaanen et al., Phys. Rev. Lett. 55, 418 (1985).
- (2) K. Hämäläinen et al., Phys. Rev. B 61, 1836 (2000).
- (3) M. Z. Hasan et al., Science 288, 1811 (2000).
- (4) Y. J. Kim et al., Phys. Rev. B 70, 094524 (2004).
- (5) K. Ishii et al., Phys. Rev. Lett. 94, 207003 (2005).
- (6) M. Z. Hasan et al., J. Electron Spectrosc. Relat. Phenom. 114, 705 (2001).
- (7) M. E. Simon et al., Phys. Rev. B 54, R3780 (1996)
- (8) R.S. Markiewicz et al., Phys. Rev. B 76, 174514 (2007).
- (9) Tanmoy Das, R. S. Markiewicz, and A. Bansil, Phys. Rev. B 81, 174504 (2010).
- (10) R.S. Markiewicz and A. Bansil, Phys. Rev. Lett. 96 107005 (2006).
- (11) For finite hole doping, the AF order can equally well be modeled by a competing magnetic, charge, or flux phase order.
- (12) Susmita Basak et al., Phys. Rev. B 80, 214520 (2009).
- (13) J. C. Igarashi, T. Nomura, and M. Takahashi, Phys. Rev. B. 74, 245122 (2006).
- (14) Y.W. Li et al., Phys. Rev. B 78, 073104 (2008).
- (15) P.B. Allen, arXiv: 0407777.
- (16) The values of the three-band model parameters used in our calculations are as follows. eV, eV, eV and for , respectively. We have chosen eV which is doping independent. The hopping parameters are obtained by using a tight-binding fitting to ab-initio results, and are taken to be doping independent assuming a rigid band picturefootAB2 . It will be interesting to examine doping effects via first principles approaches footAB3 . The magnetization is found self-consistently. The small value of is consistent with Ref. OKA, .
- (17) A. Bansil, Zeits. für Natur. 48 A, 165 (1993); Hsin Lin et al., Phys. Rev. Lett. 96, 097001 (2006); H. Asonen et al., Phys. Rev. B 25, 7075 (1982).
- (18) S. Kaprzyk and A. Bansil, Phys. Rev. B 42, 7358(1990); L. Schwartz and A. Bansil, Phys. Rev. B 10, 3261(1974); R. Prasad and A. Bansil, Phys. Rev. B21, 496 (1980).
- (19) P.R.C. Kent, T. Saha-Dasgupta, O. Jepsen, O.K. Andersen, A. Macridin, T.A. Maier, M. Jarrell, and T.C. Schulthess, Phys. Rev. B 78, 035132 (2008).
- (20) We find that a smaller value of the effective Hubbard parameter ( eV instead of eV) leads to better agreement with experiments at half-filling. For 14% doping, however, we use the same renormalized eV as Ref. bobrixs .
- (21) Tanmoy Das, R. S. Markiewicz, and A. Bansil, Phys. Rev. B 81, 184515 (2010).
- (22) A. Lanzara, personal communication.
- (23) M. C. Asensio et al., Phys. Rev. B 67, 014519(2003); A. Bansil et al., Phys. Rev. B 71, 012503 (2005); M. Lindroos and A. Bansil, Phys. Rev. Lett. 77, 2985 (1996).
- (24) A. Bansil et al., Phys. Rev. B 23, 3608 (1981); G. Stutz et al., Phys. Rev. B 60, 7099 (1999).
- (25) L. C. Smedskjaer et al., J. Phys. Chem. Solids 52, 1541(1991); J. C. Campuzano et al., Phys. Rev. B 43, 2788 (1991); J. Mader et al., Phys. Rev. Lett. 37, 1232(1976).
- (26) J. P. Hill et al., Phys. Rev. Lett. 80, 4967 (1998).
- (27) P. Abbamonte et al., Phys. Rev. Lett. 83, 860 (1999).
- (28) M. Z. Hasan et al., cond-mat/0406654.
- (29) K. Ishii et al., Low Temperature Physics: 24th International Conference on Low Temperature Physics, edited by Y. Takano, S.P. Hershfield, S.O. Hill, P.J. Hirschfeld, and A.M. Goldman (A.I.P., 2006), p. 403.
- (30) L. Lu et al., Phys. Rev. Lett. 95, 217003 (2005).
- (31) J. P. Hill et al., Phys. Rev. Lett. 100, 097001 (2008).
- (32) Y.W. Li et al., unpublished (2006).
- (33) We note that the intensity is sensitive to ‘matrix element’ effects not included in the present formalism, including strong core hole effects. See R.S. Markiewicz and A. Bansil, unpublished.
- (34) We note two slight disagreements: (1) along the theoretical curves show a reflection symmetry about associated with long range AF order, which is weaker or absent in experiment, suggestive of a fluctuating pseudogap. (2) While the high-energy feature near 5 eV, associated with transitions to the LHB, is in good agreement with experiment in the undoped sample in Figs. 2 (a)-(c) and along in the sample in Figs. 2 (d)-(f), experiments in the latter sample along show an anomalous softening not captured in the present calculation.
- (35) P.K. Mang, O.P. Vajk, A. Arvanitaki, J.W. Lynn, and M. Greven, Phys. Rev. Lett. 93, 027002 (2004).
- (36) R.S. Markiewicz, Phys. Rev. B70, 174518 (2004).
- (37) Y. Onose et al., Phys. Rev. B 69, 024504 (2004).