Moiré Patterns on STM images of graphite from surface and subsurface rotated layer
Abstract
We have observed with STM moiré patterns corresponding to the rotation of one graphene layer on HOPG surface. The moiré patterns were characterized by rotation angle and extension in the plane. Additionally, by identifying border domains and defects we can discriminate between moiré patterns due to rotation on the surface or subsurface layer. For a better understanding of moiré patterns formation we have studied by first principles an array of three graphene layers where the top or the middle layer appears rotated around the stacking axis. We compare the experimental and theoretical results and we show the strong influence of rotations both in surface and subsurface layers for moiré patterns formation in corresponding STM images.
pacs:
68.37.Ef, 71.15.Mb, 73.22.PrI Introduction
Graphitic surfaces have attracted considerable interest from several scientific groups. At first, a few decades ago and from a fundamental point of view, atomic resolved STM images were obtained from the highly oriented pyrolitic graphite (HOPG) surface. As at atomic scale such STM images show triangular and/or honeycomb lattices, even under different experimental conditions binning1986 ; park1986 ; sonnenfeld1986 , several efforts have been done to understand this behavior hembacher2003 ; khara2009 ; cisternas2009 ; ondracek2011 , but only recently a conclusive explanation has been reached WD2012 . In the nineties the research on graphitic surfaces shifted the attention to the STM observation of superstructures kuwabara1990 ; rong1993 ; xhie1993 , and thereafter to the interaction between such superstructures and grain boundaries in graphite gan2003 . These fields has been recently reactivated by the possibility of getting single and multi graphene layer islands onto different substrates such as: Palladium oshima1997 , Iridium diaye2006 , Ruthenium sutter2008 , Copper li2009 , or Platinum otero2010 .
In particular, the STM observation of superstructures on graphitic surfaces can be explained in the frame of the well known Moiré Patterns: interference patterns caused by a misalignment between two periodic lattices. Thus, a relative rotation between the top graphene layer and the underlying graphite crystal leads regions with characteristic stacking sequences: AA stacking regions, having a high concentration of atoms with a neighbor directly below; and AB stacking regions, having a high concentration of atoms without a neighbor directly below. These regions appear forming a lattice whose periodicity depends of the mis-rotation angle by , where Å is the graphene lattice constant. This explanation, first proposed by Kuwabara et al. kuwabara1990 , became stronger when Xhie et al. xhie1993 showed experimental evidence in its favour. However, a controversy arose about which stacking region appears brighter in the STM images xhie1993 ; rong1993 . On the other hand, as line profiles for moiré patterns present large oscillation amplitudes (which is known as giant corrugation), it was suggested that superstructures originate from surface deformations induced by STM tip pong2005 . In this context, recently we have obtained theoretical constant height mode STM images for twisted bilayer graphene (), which reproduce quite well the experimental observations: moiré patterns and giant corrugation CC2012 . Besides, these theoretical results point that: (a) current intensity maxima are over AA stacking regions, as previously reported rong1993 ; CSS07 ; and (b) giant corrugation has a strong electronic origin, as also was quoted recently Brihuega2012 .
In this paper we present experimental evidence of the observation of moiré patterns induced by the rotation of both: top surface and subsurface graphene layers. Thus, by identifying border domains and defects, we can discriminate between superstructures resulting from layer rotation on the top surface from those caused by a subsurface layer rotation. Also, we can compare the oscillation amplitude of the associated line profiles. These experimental results are complemented by theoretical STM images obtained from first-principles calculations performed on trilayer graphene which presents relative rotation among them.
II Experimental setup and results
The experiments were performed using an STM from Omicron running at atmospheric pressure. The samples were peeled off using an adhesive tape in air. The STM images were collected at room temperature in both constant current and constant height mode using PtIr tips. The bias voltages refer to the applied sample bias, which corresponds to the filled-states. Every image was scanned from bottom-to-top. The images were flattened to correct the sample tilting and filtered with smooth filters.
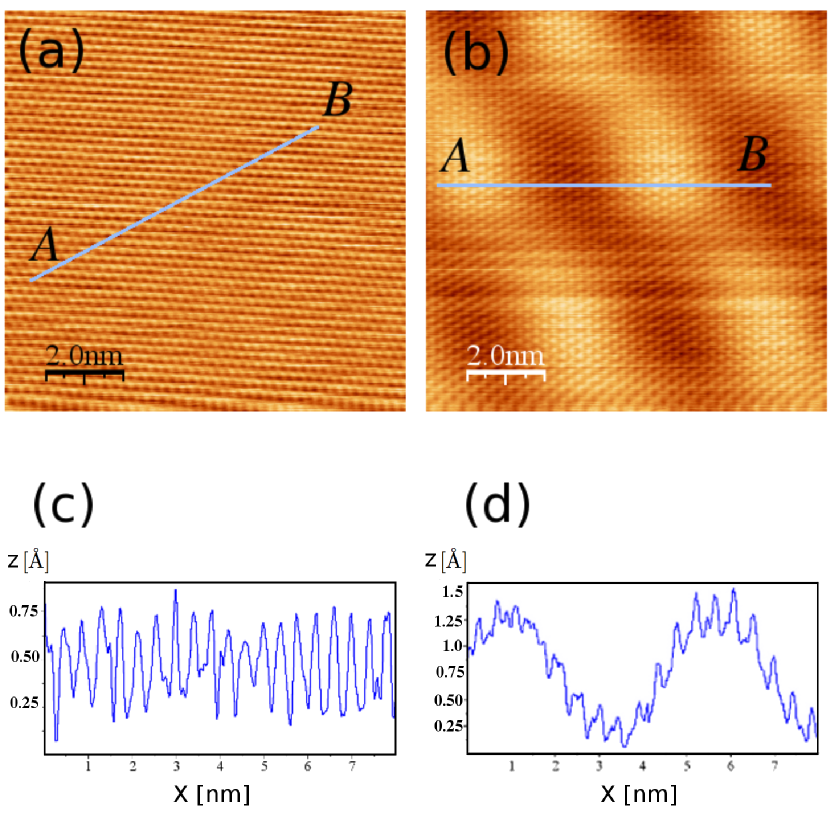
In Fig. 1 we show two topographic-STM images with atomic resolution taken on two different regions of the same sample: in (a) no moiré pattern is observed, while in (b) it appears clearly. In the region without the superstructure the standard HOPG image is reproduced, where only one lattice site is observed. The corresponding line profile along , Figure 1(c), shows an oscillation amplitude around 0.8 Å. On the other hand, in the region with the superstructure a triangular pattern superimposed at the atomic resolution is easily identifiable. This resembles giant atoms ordered in a triangular superlattice, with a corresponding line profile that has an amplitude of oscillation of around 1.3 Å [See Figure 1(d)]. Also, in these oscillations we can observe the small peaks associated to the atomic positions.
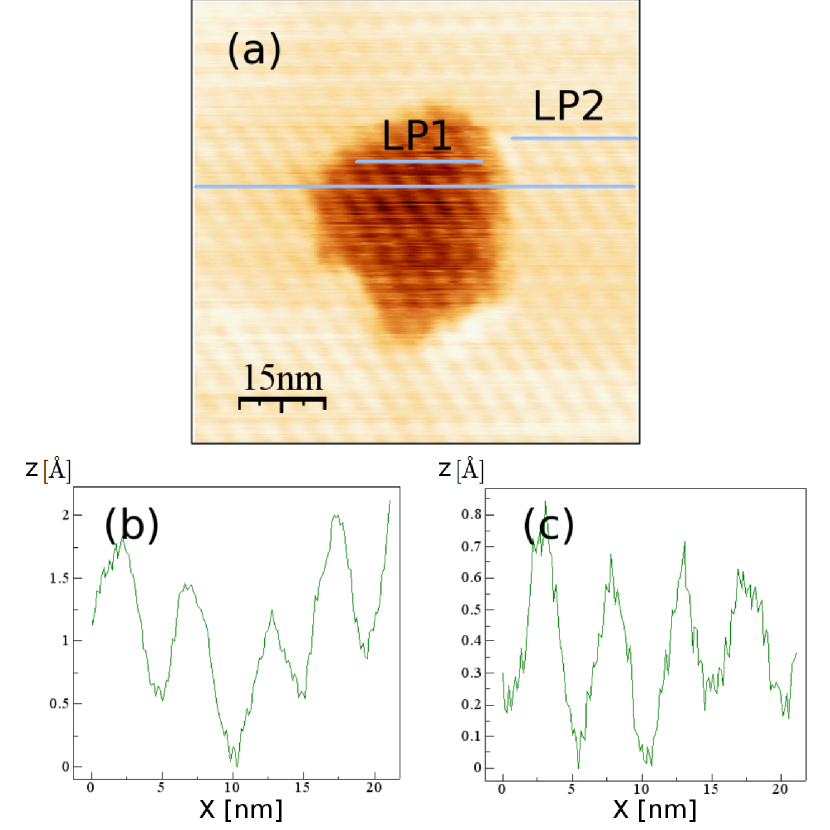
In a given zone in the region with the moiré pattern, we also identified a defect, a void, which provides the chance to observe the subsurface layer (see Fig. 2). Inside this void we also observe the moiré pattern, wich indicates that the subsurface graphene layer is probably rotated with respect to the HOPG, while the surface layer is not. Additionally, other experimental evidence comes from comparing line profiles inside the void (LP1) with those and on the top surface (LP2): the line profile amplitude is higher inside the void.
III Theoretical results
In order to probe the idea that a rotated subsurface layer can also produce moiré patterns, we calculated STM images for a surface model presenting a rotation in a top surface or in a subsurface layer. Specifically, the model consists of a repeating three layer graphene (TLG) slab, with enough separation between adjacent slabs to avoid mutual interaction. Starting from a Bernal stacking sequence, three cases were analyzed: no rotation (NR), top surface layer rotation (SR) and middle layer rotation (MR). The rotation angle for the two last cases was . This particular angle produces a commensurable superstructure composed of 222 carbon atoms, which is tractable from the computational point of view, while the periodicity ( nm) is representative of experimental data CC2012 . For this model we have performed Density Functional Theory calculations using the SIESTA ab initio package SAG2002 which employ norm-conserving pseudo-potentials and localized atomic orbitals as basis set. Double- plus polarization functions were used under the local density approximation CA1980 . All structures were fully relaxed until the atomic forces are smaller than 0.02 eV/Å. We consider super-cells with periodic boundary conditions. The Brillouin zone was sampled using a Monkhorst-Pack mesh of .
The images were obtained using the code STM 1.0.1 (included in the SIESTA package). This code uses the wave functions generated by SIESTA and computed on a reference plane and extrapolates the values of these waves into vacuum. Such reference plane must be sufficiently close to the surface so that charge density is large and well described. The images were generated under the Tersoff-Hamann theory tersoff-hamann , which means that the states contributing to the tunneling current lies in the energy window []. Data visualization was possible using the WSxM 5.0 freeware HFG2007 . A Gaussian smoothing was performed to obtain the final STM images.
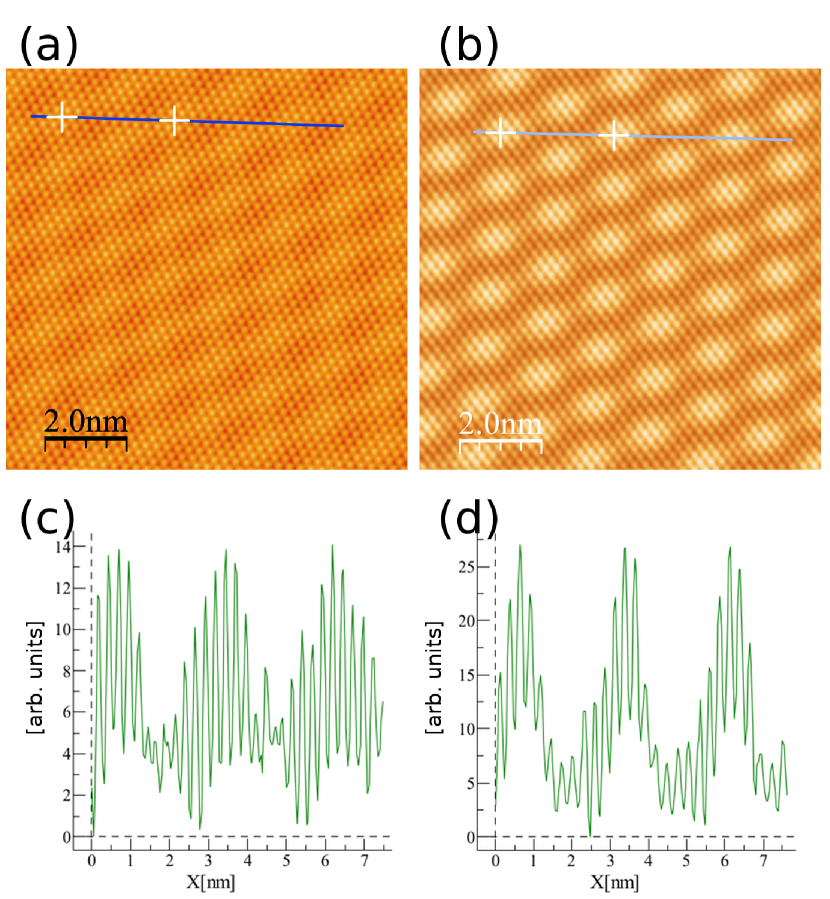
By considering a bias voltage V, and a tip-to-surface distance Å, we calculated STM images for our TLG model. Figure 3 shows these theoretical results for a supercell which presents a rotation in: the middle layer (a), and in the top layer (b). Brilliant (dark) regions represent high (low) tunneling current density. In both images we can identify a moiré with a periodicity of 1.5 nm. We have plotted the profiles along the highlighted lines in Figs. 3(a) and 3(b). Clearly, the oscillation amplitude associated to the surface layer rotation [see Fig. 3(d)] is larger than that associated to a subsurface layer rotation [see Fig. 3(c)], thus coinciding with the experimental findings.
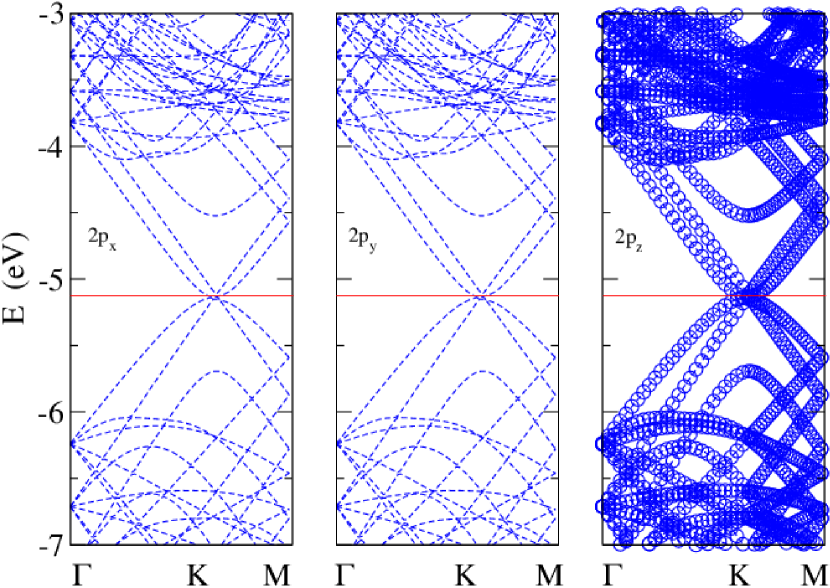
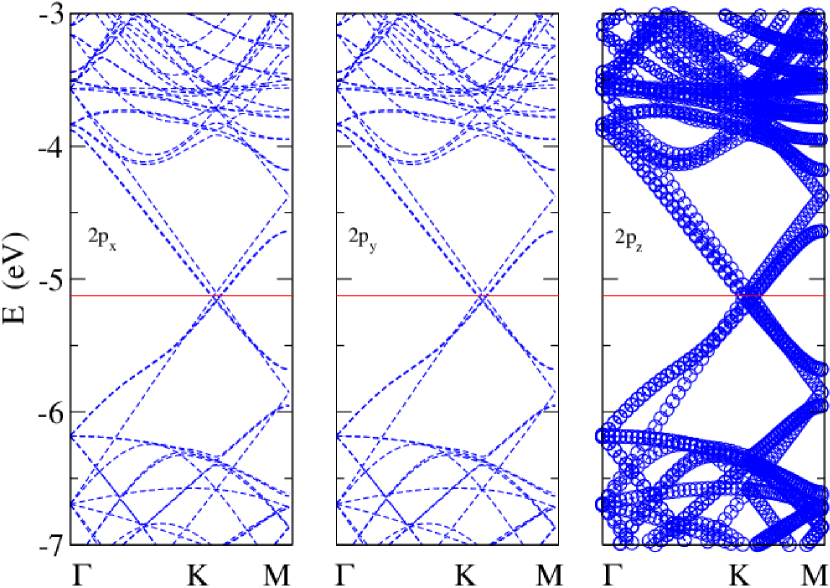
A Fat-Band Analysis give us additional elements to understand the moiré pattern formation. Figure 4 shows, from left to right, the contribution to the band structure of the orbitals , and in the case TLG with no rotation (TLG-NR). As the orbitals and do not contribute to the band structure around the Fermi Level (indicated by the horizontal red line), it is possible to recognize in their corresponding graphics the band structure of TLG reported previously PP2006 ; Latil2007 ; T2011 . In the case of a top surface rotated layer, Fig. 5 shows the different orbitals contributions. Again only the orbital contributes near the Fermi Level, although the band structure suffers an important modification respect the TLG-NR case: near the point and for energies range eV, four saddle points appear in the band structure. Four Van Hove Singularities (VHS) then appear in the density of states, which explain the current density maxima detected by the STM tip CC2012 ; Li2010 ; Luican2011 .
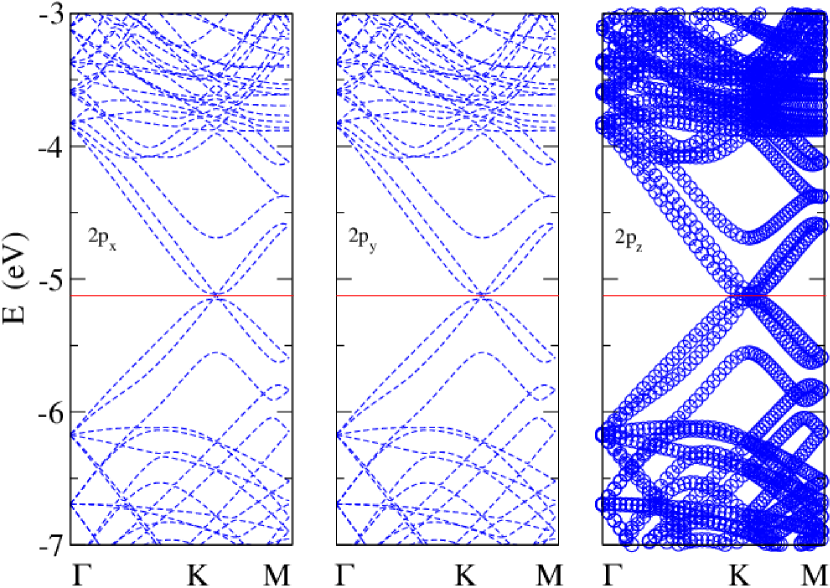
A rotation in the middle layer produces notorious modifications respect the preceding cases. Even though the contribution to the band structure around the Fermi Level comes again from the orbitals (see Fig. 6), at the bands dispersion is linear. On the other hand, at the point and for the same energy window considered before ( eV), two saddle points appear in the band structure. Two VHS then appear in the density of states which explain the current intensity maxima revealed in the STM image.
IV Comments and conclusions
As the states that contribute to the STM images lie in the energy window [, ], the following observations become interesting. Firstly and as was expected, for only the orbitals contribute to the STM image. Secondly, for a TLG array without rotation (see Fig. 4), we reproduce the band structure reported prevously PP2006 ; Latil2007 ; T2011 , providing us a checkpoint for our theoretical calculations. Thirdly, a rotation performed in the surface layer (see Fig. 5) produces four VHS which contribute to the STM image and which explains the large corrugation amplitude of the corresponding line profile. Fourthly, if the middle layer has experienced the rotation, only two VHS appear and, although the corresponding STM image shows a moiré pattern, its associated line profile presents a softer corrugation amplitude. In fact, as experimental and theoretical results shows (see Figs. 2 and 3), the line profile amplitude associated with a rotation in the surface layer is twice the amplitude associated to a rotation in the subsurface layer.
Summarizing, we experimentally observed the formation of moiré patterns on HOPG surfaces, which originate from rotation on a graphene layer. We identified zones where the rotated layer is the surface layer and zones where the rotated layer is a subsurface one. This is evidenced by comparing the oscillation amplitude, which is lower when a subsurface layer rotates. The calculation of the corresponding STM images agrees with the experimental observation and gives additional evidence of the important role of VHS to explain the moiré patterns.
V Acknowledgements
This work was partially supported by Universidad de La Frontera, Project DI11-0012. M.F. thanks to the PSD53 project. P.V. acknowledges the financial help from Fondecyt, grant: 1100508 and from USM, internal grant. This research was partially supported by the supercomputing infrastructure of the NLHPC (ECM-02) at CMCC-UFRO.
References
- (1) G. Binning, H. Fuchs, Ch. Gerber, H. Rohrer, E. Stoll, and E. Tosatti, Europhys. Lett. 1, 31 (1986).
- (2) S.-I. Park and C. F. Quate, Appl. Phys. Lett. 46, 832 (1986).
- (3) R. Sonnenfeld and P. K. Hansma, Science 232, 211 (1986).
- (4) S. Hembacher, F. J. Giessibl, J. Mannhart, and C.F. Quate, Proc. Natl. Acad. Sci. U.S.A. 100, 12539 (2003).
- (5) G. S. Khara and J. Choi, J. Phys.: Condens. Matter 21, 195402 (2009).
- (6) E. Cisternas, F. Stavale, M. Flores, C.A. Achete, and P. Vargas, Phys. Rev. B 79, 205431 (2009).
- (7) M. Ondráček, P. Pou, V. Rozsíval, C. González, P. Jelínek, and R. Pérez, Phys. Rev. Lett. 106, 176101 (2011).
- (8) H. S. Wong and C. Durkan, Nanotechnology 23, 185703 (2012).
- (9) M. Kuwabara, D. R. Clarke, and D. A. Smith, Appl. Phys. Lett. 56, 2396 (1990).
- (10) Z. Y. Rong and P. Kuiper, Phys. Rev. B 48, 17427 (1993).
- (11) J. Xhie, K. Sattler, M. Ge, and N. Venkateswaran, Phys. Rev. B 47, 15835 (1993).
- (12) Y. Gan, W. Chu, and L. Qiao, Surf. Sci. 539, 120 (2003).
- (13) C. Oshima, J. Phys.: Condens. Mater. 9, 1 (1997).
- (14) A. T. N’ Diaye, S. Bleikamp, P.J. Feibelman, and T. Michely, Phys. Rev. Lett. 97, 215501 (2006).
- (15) P. W. Sutter, J. I. Flege, and E. A. Sutter, Nat. Mater. 7, 406 (2008).
- (16) X. S. Li, W. W. Cai, J. A. An et al., Science 324, 1312 (2009).
- (17) G. Otero, C. González, A. Pinardi et al., Phys. Rev. Lett. 105, 216102 (2010).
- (18) W.-T. Pong and C. Durkan, J. Phys. D: Appl. Phys. 38, R329 (2005)
- (19) E. Cisternas and J. D. Correa, Chem. Phys. 409, 74 (2012).
- (20) J. M. Campanera, G. Savini, I. Suarez-Martinez, and M. I. Heggie, Phys. Rev. B 75, 235449 (2007).
- (21) I. Brihuega, P. Mallet, H. González-Herrero et al., Phys. Rev. Lett. 109, 196802 (2012).
- (22) J. M. Soler, E. Artacho, J. D. Gale, A. Garcia, J. Junquera, P. Ordejón, and J. D. Sánches-Portal, J. Phys. Condens. Matter. 14 2745 (2002).
- (23) D. M. Ceperley and B. J. Alder, Phys. Rev. Lett. 45 566 (1980).
- (24) J. Tersoff and D. R. Hamann, Phys. Rev. Lett. 50, 1998 (1983).
- (25) I. Horcas, R. Fernandez, J. M. Gomez-Rodriguez, J. Colchero, J. Gomez-Herrero, and A. M. Baro, Rev. Sci. Instr. 78 013705 (2007).
- (26) B. Partoens and F. M. Peeters, Phys. Rev. B 74, 075404 (2006).
- (27) S. Latil, V. Meunier, and L. Henrard, Phys. Rev. B 76, 201402(R) (2007).
- (28) T. Taychatanapat, K. Watanabe, T. Taniguchi et al., Nat. Phys. 7, 621 (2011).
- (29) G. Li, A. Luican, J.M.B. lopez dos Santos et al., Nat. Phys. 6, 109 (2010).
- (30) A. Luican, G. Li, A. Reina et al., Phys. Rev. Lett 106, 126802 (2011).