Slippage and Nanorheology of Thin Liquid Polymer Films
Abstract
Thin liquid films on surfaces are part of our everyday life, they serve e.g. as coatings or lubricants. The stability of a thin layer is governed by interfacial forces, described by the effective interface potential, and has been subject of many studies in the last decades. In recent years, the dynamics of thin liquid films came into focus since results on the reduction of the glass transition temperature raised new questions on the behavior of especially polymeric liquids in confined geometries. The new focus was fired by theoretical models that proposed significant implication of the boundary condition at the solid/liquid interface on the dynamics of dewetting and the form of a liquid front. Our study reflects these recent developments and adds new experimental data to corroborate the theoretical models. To probe the solid/liquid boundary condition experimentally, different ways are possible, each bearing advantages and disadvantages, which will be discussed. Studying liquid flow on a variety of different substrates entails a view on the direct implications of the substrate, the experimental focus of this study is the variation of the polymer chain length: The results demonstrate that inter-chain entanglements and in particular their density close to the interface, originating from non-bulk conformations, govern liquid slip of a polymer.
pacs:
68.15.+e, 83.50.Lh, 83.80.Sg, 47.15.gm1 Introduction
Confining a material often induces new phenomena that cannot be found in bulk. Prominent examples are the physics of a quantum dot or the surface reconstructions of many crystalline materials. Confinement in liquid flow geometries, however, came into focus with the rise of the field of nano- and microfluidics and with its application in lab-on-a-chip devices for transporting, mixing, separating or analyzing minute amounts of liquids [1, 2, 3, 4]. Recent developments tend to avoid huge external features such as pumps to control the flow by designing analogues to capacitors, resistors or diodes that are capable to control currents in electronic circuits [5]. Controlling the flow also involves a control of the solid/liquid boundary condition. In recent years, various experimental methods have been developed in order to characterize the boundary condition to more than ”no slip” and ”full slip” [6, 7, 8]. At the same time, theoretical descriptions have advanced to include slip effects into the classical thin film equations [9, 10, 11], which now enable a prediction of the influence of slippage to various other situations, e.g. to the Rayleigh-Plateau instability [12, 13, 14] or to spinodal dewetting [15]. Combining the experiments with those theories now allows for new insights into confinement effects in liquids, some of which will be reported in this study.
Liquid slip is characterized by the slip length and is defined as the extrapolation length of the velocity gradient to zero velocity [16]. Studies of published data of can roughly be divided into two groups, the ones reporting on slip effects in the tens of nm-range [17, 18, 19, 20, 21, 22] and the ones observing large slip effects in the micron or the ’plug flow’ range [23, 24, 25, 26, 27, 28, 29, 30]. Especially for high molecular weight (entangled) polymer melts, large slip lengths were expected according to de Gennes’ prediction [31]. Moreover, de Gennes proposes the slip length to increase proportional to the third power of the chain length (or the molecular weight, respectively), i.e. , where denotes the molecular size and the entanglement length of the polymer. For this study, we especially took care that we will be able to probe the entire range of slippage, from no to full slip, and designed the experiments accordingly.
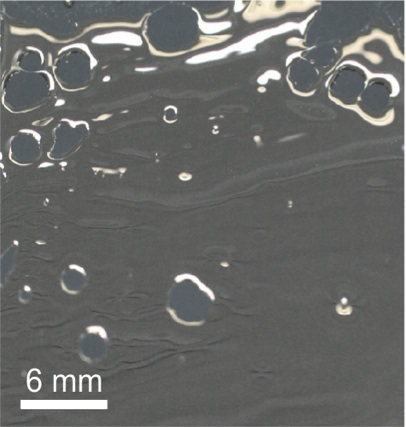
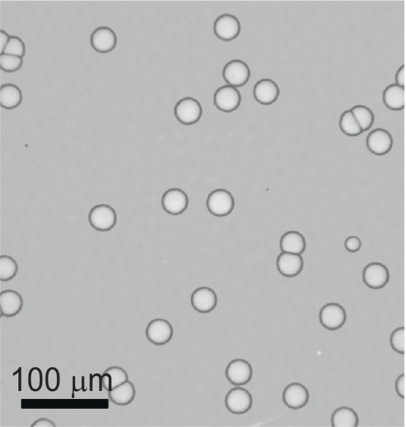
To probe slip effects in confined fluids, thin films of polymer melts were prepared on extremely smooth, well-controlled substrates, typically Si wafers with various hydrophobic coatings. To illustrate dewetting, Fig. 1 depicts on the left side a snapshot of honey dewetting from a hydrophobic surface and on the right side the lab situation, a thin liquid polystyrene film dewetting from a hydrophobized Si wafer. For both situations, mass conservation is valid and all liquid that once was inside the holes is now accumulated in a rim around the holes. As time proceeds, the holes grow. If two holes meet, they share a common rim (visible as a straight ridge) that later decays into a row of droplets via a Rayleigh-Plateau instability. The stability conditions and the dewetting pathways can be characterized according to standard methods [32, 33, 34, 35, 36]. Details for the dewetting morphologies, such as nucleation and spinodal dewetting, can be found in our recent publications [36, 37] and references therein. For the characterization of the boundary condition in the way it will be presented in the following, the type of dewetting scenario is not relevant; the only precondition is that the liquid does not wet the substrate. For all experiments shown in the following, holes in the film were initiated by nucleation.
The aim of the paper is to present the most recent results in a consistent way in order to sharpen the conception for slippage phenomena. We therefore concentrate on the experimental results and for most of the theoretical details behind the analysis, the reader is referred to earlier studies.
2 Preparation
As polymers, mostly atactic polystyrene (PS) was used (purchased from PSS, Mainz, Germany), but in some cases also block-copolymers are utilized as specified later (c.f. section 5). Atactic PS is preferred as it does not crystallize, the water uptake is negligible and it can be purchased with very low polydispersity and high purity. The molecular weight of PS ranged from 5.61 kg/mol (termed ’PS(5.61k)’) to 390 kg/mol. Polymers are spin-cast onto mica out of a good solvent, which is toluene (Selectipur® or LiChrosolv® Line by Merck, Darmstadt, Germany) for PS. The resulting film thicknesses are in the range of 100 to 140 nm, unless otherwise noted. Aside from single experiments presented in sections 3.2.2 and 3.2.3, PS films exhibiting molecular weights k were pre-annealed on mica. For the choice of appropriate pre-annealing conditions, we made use of experiments presented in Ref. [38], where above the entanglement length of PS the density of nucleated holes was found to decrease as the annealing time increased. Sites of especially high stress might act as nuclei for the generation of holes and their relaxation is correlated to the significant reduction of the hole density. For the largest molecular weight that was used for dewetting experiments, i.e. PS(390k), annealing for 3 h at 140∘C did not lead to a further reduction of the hole density, as a plateau value is reached. To safely exclude the presence of internal stresses, the aforementioned pre-annealing parameters (3 h at 140∘C on mica) were chosen in a consistent manner prior to dewetting. The thin film was then floated onto a MilliQ™ water surface from where it could be picked up with the sample surface of choice.
Si wafers (Wacker Siltronic AG, Burghausen, Germany and Si-Mat Silicon Materials, Kaufering, Germany) have been carefully cleaned using standard procedures [39] and hydrophobized by octadecyl-trichlorosilane (OTS), hexadecyl-trichlorosilane (HTS) or dodecyl-trichlorosilane (DTS) self-assembled monolayers (SAMs) using standard silanization methods [40, 41, 42]. To achieve a hydrophobic coating which is not based on silanes, thin Teflon® films were prepared by spin coating a solution of AF 1600 (Poly[4,5-difluoro-2,2-bis(trifluoromethyl)-1,3-dioxide-co-tetrafluoroethylene], Aldrich) in a perfluorinated solvent (FC-75®, Acros Organics). Heating the samples above the glass transition temperature of the PS film initiates dewetting.
| layer | (PS) | (PS) | |||||
|---|---|---|---|---|---|---|---|
| (nm) | (nm) | (∘) | (∘) | (mN/m) | (∘) | (mN/m) | |
| AF 1600 | 20(2) | 0.30(3) | 128(2) | 10 | 15.0 | 88(2) | 29.7(11) |
| OTS | 2.3(2) | 0.09(1) | 116(1) | 6 | 23.9 | 67(3) | 18.8(15) |
| HTS | 2.0(1) | 0.16(2) | 109(1) | 10 | 24.5 | 62(2) | 16.4(10) |
| DTS | 1.5(2) | 0.13(2) | 114(1) | 5 | 26.4 | 67(3) | 18.8(15) |
Tab. 1 gives details of the substrate properties: roughness (taken from a 1 m2 atomic force microscopy scan), water contact angles, static PS contact angle (PS) and the surface energies . The latter was calculated from contact angle measurements of apolar liquids. Using these parameters together with the dielectric constants and refractive indices of all contributing materials, the van-der-Waals (vdW) part of the effective interface potential can be inferred [43] for each of the hydrophobized wafers (see Ref. [37]). Alternatively, experimental access to can be gained recording the spinodal wavelength as function of film thickness, as shown in previous studies [33, 34, 35, 36]. The effective interface potential summarizes all interfacial forces and describes the energy needed (or gained) to bring two interfaces to a certain distance. In our case, the distance between the two interfaces is the thickness of the liquid film. At values of where the second derivative of with respect to , , is negative, spinodal dewetting can take place [32, 33, 34].
3 Dewetting as a Probe to Analyze Slippage and Nanorheology
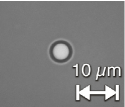
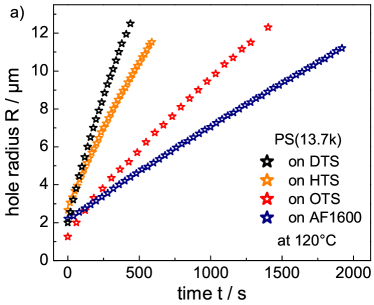
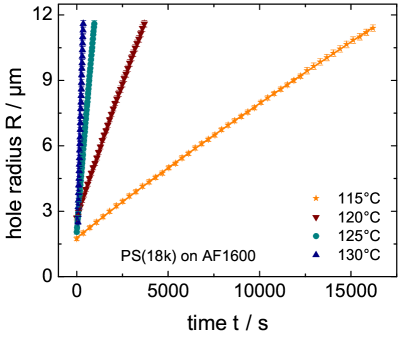
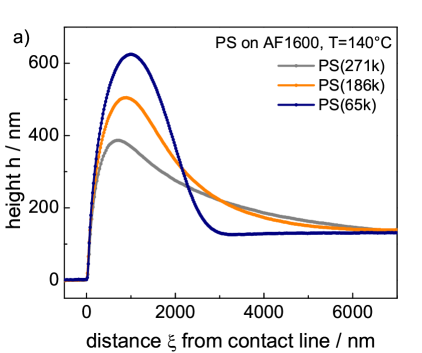
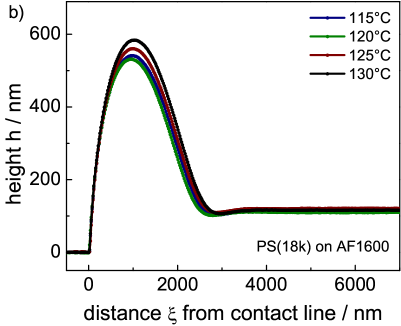
Fig. 1 right depicts a typical distribution of heterogeneously nucleated holes in a PS(65k) film, whereas Fig. 2 shows a temporal series of optical micrographs illustrating the growth of a single hole. The impact of the solid/liquid interface to the dewetting dynamics is made obvious in Fig. 3a, where the radius of a hole is recorded as function of time for four different types of hydrophobic layers on top of a Si wafer. For the data shown, experimental parameters like PS film thickness (130 nm), dewetting temperature (120C), molecular weight (13.7 kg/mol), and roughness of the solid surface ( 0.3 nm, c.f. Tab. 1) were held constant. Clearly, dewetting on the DTS-covered surface proceeds the fastest. The result is surprising, since the driving force of dewetting - as characterized by the absolute value of the spreading coefficient , i.e. , is largest for AF 1600 and lowest for HTS (c.f. Tab. 1).
Comparing identically prepared liquid films dewetting from different hydrophobic substrates highlights the fact that the flow properties and the hydrodynamic boundary condition at the solid/liquid interface are the key to understand the thin film dynamics. This entails the structural and dynamic properties of the interfacial region imposed by the substrate and, moreover, also the role of the liquid itself. The latter issue is the main subject of this study: We will focus on one hydrophobic substrate, AF1600, and systematically vary the liquid properties, in particular the length of the polymer chains as given by the molecular weight of the melt.
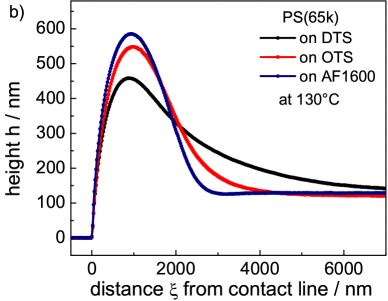
Dewetting experiments allow the characterization of the slip length either by analyzing the dewetting dynamics [27, 28] or by evaluating the shape of a dewetting front [24, 25, 26, 30]. As illustrated in Fig. 3b, the shape of a liquid rim (resulting from identical films and recorded at the same hole radius) is sensitive to the type of substrate and, consequently, the boundary condition [29]. Again, different substrates are qualitatively compared for the identical liquid (molecular weight, viscosity). A recent review describes comprehensively the two mentioned methods to gain the slip length and gives detailed views on slip effects in thin polymer films [44]. The main advantage of deriving the slip length from the dynamics and the morphology of dewetting films is that the method is non-invasive: no external shear has to be applied, no colloidal probe or tracer particles interfere with the liquid.
3.1 Characterizing the Growth of Holes
From theory [46, 47, 48], one expects a linear growth of the hole radius with time for the no-slip situation and with in the case of full slippage. Recording curves in holes of dewetting polymer films (c.f. Fig. 2), is readily determined by fitting an algebraic power law, i.e. . Alternatively, in a double-logarithmic plot, the curves are fitted by a line of slope , c.f. Fig. 4 [45]. The figure exemplarily illustrates a set of typical measurements in various PS films supported by AF 1600 substrates. Note that marks the time where the hole was first detected by optical microscopy; for the evaluation of , the ’real birth time’ of a hole, , is a fit parameter that is determined for each curve separately. Subsequently, the data are evaluated according to the analytical model and analysis technique presented in Refs. [27, 28], which is based on the superposition of two dissipation mechanisms [50]: viscous friction within the liquid and friction at the solid/liquid interface (slippage).
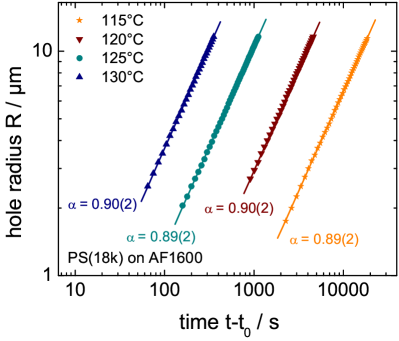
3.1.1 Evaluation of the Dewetting Exponent
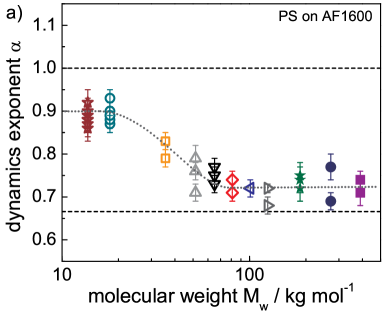

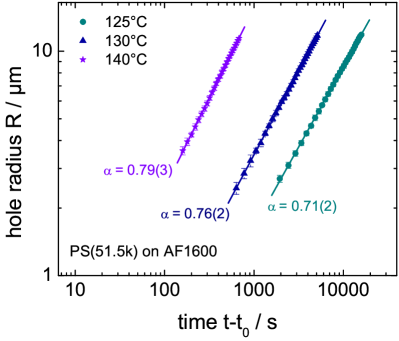
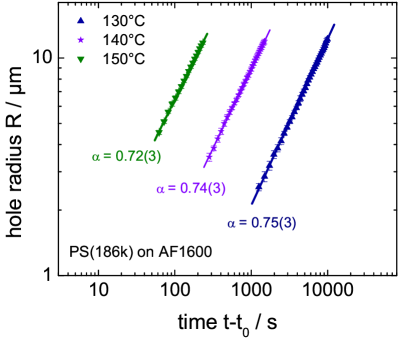
In the following, the molecular weight of the polymer melt and the dewetting temperature were systematically varied in dewetting experiments. The values for the exponent given in Fig. 4 already show that does not change significantly with temperature. The effect of the variation of illustrates Fig. 5: With increasing , undergoes a transition from high values around 0.9 (close to 1) to low values around 0.7 (close to 2/3). The transition occurs around the molecular weight of the polymer, where the molecules exceed the critical molecular weight for chain entanglements. As soon as chain entanglements become considerable and slippage starts to increase, the dewetting exponent changes significantly. This finding is consistent with the theoretical expectation obtained from simple energetic considerations, which predict and in the limiting cases of no-slip and full-slip, respectively [46, 47, 48]. Deviations from the analytical predictions, such as an exponent for the no-slip case being rather close to 0.9 than 1, have also been previously reported for numerical simulations [49].
The experimental result, however, visualizes at the same time the limitations of this approach (c.f. Fig 5): Although the slip length varies by orders of magnitude, does not show significant variations except for the transition from weak to strong slip (note that the slip length is orders of magnitude larger as compared to the typical film thickness). Consequently, drawing further conclusions solely from measurements of the dewetting exponent with regard to slippage and the slip length in particular is not appropriate. In anticipation of the next sections, the data for shown in of Fig. 5a can be related to the slip length , as depicted in Fig. 5b. The exponent is plotted as a function of the slip length, which was obtained via the hole growth analysis of the data. The linear superposition of energy dissipation due to viscous flow and due to friction at the solid/liquid interface marks the underlying assumption for this method [50] and will be introduced in the following.
3.1.2 Evaluation of the Slip Length by Experiments
Following our description as published in Refs. [27, 28], the contact line velocity can be expressed by two contributions, resulting from viscous flow and representing liquid slip at the solid/liquid interface, given by:
| (3.1) |
and the rim width
| (3.2) |
where stands for the film thickness and denotes the constant of proportionality characterizing the flow field in the vicinity of the three-phase contact line (receding contact angle ). represents the constant of proportionality according to conservation of mass and can be determined via in situ AFM measurements (c.f. section 3.2.1), while simultaneously recording the evolution of the rim width and the radius of the hole during dewetting. By plotting the dewetting velocity (given by the first derivative of the hole radius ) versus , the viscous and slip velocity contributions can be separated.
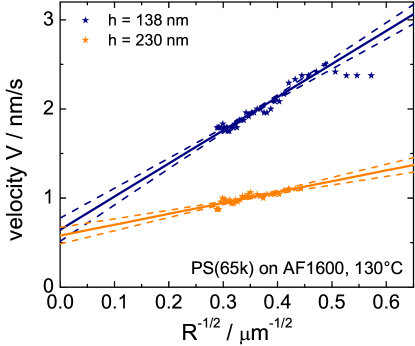
Fig. 6 exemplarily illustrates two typical curves for PS(65k) films exhibiting different film thicknesses on AF 1600 substrates. The film thickness impacts the slope of the curves, but does not act on the y-axis intercept . For small hole radii, i.e. for large , there are data points deviating from the linear regime. This deviation can be attributed to the presence of the pre-mature stage of hole growth, where the rim of the hole is not fully developed and therefore self-similarity of the rim profile, a precondition for the validity of the theoretical description, is not given [27, 51].
From the slope of the data representation, the slip length can be calculated via Eq. (3.1). Data for the viscosity were extracted from independent viscosimeter measurements [52] by extrapolating these data [53] according to the Williams-Landel-Ferry (WLF) equation [54, 55]. is calculated from AFM measurements of the rim width (see section 3.2) and the film thickness in combination with an optical measurement of the hole radius after quenching the sample to room temperature [56].
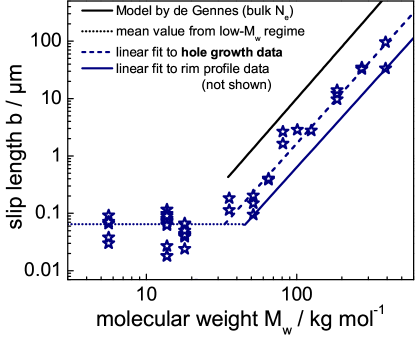
Fig. 7 illustrates the impact of the molecular weight of the polymer melt on the slip length for PS on AF 1600 substrates: Below the critical molecular weight for chain entanglements, slip lengths between 10 and 100 nm are found. Above , the slip length increases with and . The values for , however, are systematically lower compared to the expectation by de Gennes (i.e. , see Ref. [31]) using bulk literature values, namely [47] and [55]. As will be discussed in section 3.2.3, these results are in good agreement with the corresponding data for obtained with the help of the rim profiles of the same holes.
3.1.3 Evaluation of the Viscous Velocity Contribution in Experiments
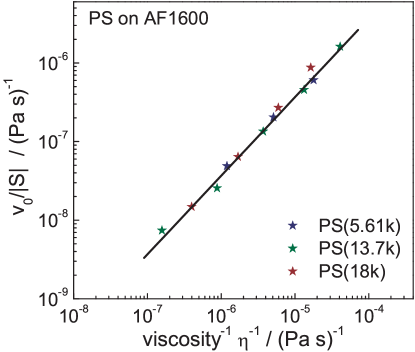
The position of the y-axis intercept of the extrapolated linear fit to the experimental data, c.f. Fig. 6, is called . By plotting versus for different , the predicted linear relationship between the viscous velocity contribution and the reciprocal viscosity is reproduced. This is illustrated in Fig. 8 and represents an important consistency check for the applied model. Consequently, the constant of proportionality can be calculated from this master curve for unentangled PS dewetting from AF 1600 substrates and is determined to be . Above entanglement, slippage changes by orders of magnitude, which has an impact on the flow field close to the contact line (c.f. Refs. [46, 47]). Thus, although still independent of the rim size, does depend on the molecular weight for .
3.2 Characterizing the Rim Profile
A rim is theoretically described by a disturbance of a liquid, that decays exponentially into the prepared film thickness. Applying thin film models [10, 26], the analysis of the decay allows for a determination of the slip length, as we have shown in earlier studies [24, 25, 26, 29]. The rim profiles were recorded by AFM [57]. The studies shown here focus on PS melts of various molecular weights on top of AF 1600. The first part of the present section covers the investigation of the temporal and spatial evolution of the shape of a liquid front by in situ AFM measurements. The second part deals with the evaluation and interpretation of ex situ liquid rim profiles captured at a fixed hole radius. The latter experiments and their analysis in view of the slip length have been, in part, published in Ref. [30] and are extended as well as discussed in detail in the following sections.
3.2.1 In situ Measurement of the Evolution of the Rim Shape
To probe the temporal and spatial growth of the liquid rim, subsequent in situ AFM images during dewetting on a high-temperature heating plate were recorded in tapping mode™. Cross-sections obtained from a temporal series of AFM scans (for a time interval ) for PS(13.7k) dewetting from AF 1600 at 115C are shown in Fig. 9a. The rim clearly grows in height and width as dewetting proceeds. Nevertheless, the form of the profiles at different times (and therefore different volumes) is very similar. All profiles exhibit a substantial trough (see inset of Fig. 9a) on the ”wet” side of the rim, where the height profile merges into the unperturbed film.
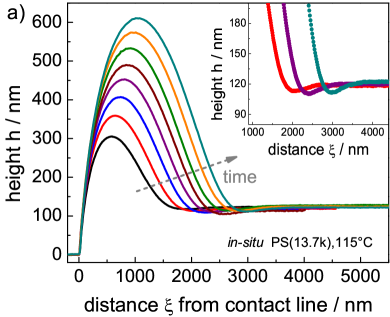
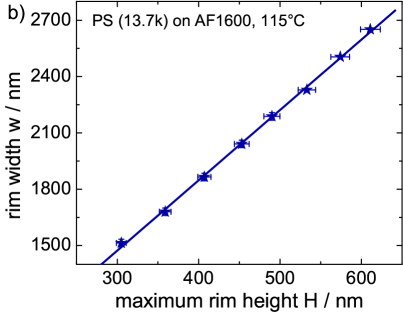
In order to test the self-similarity of the form of the rim, the rim width (the distance between three-phase contact line and the point, where the rim height has dropped to 110% of the initial film thickness) is plotted as function of the maximum rim height , c.f. Fig. 9b. The linear dependence indicates that self-similarity can safely be assumed and (where denotes the radius of the hole) is obtained from the conservation of volume for growing holes (see Ref. [44]).
3.2.2 Ex situ Measurement and Analysis of the Rim Shape at Fixed Hole Radii
By AFM, the rim profile can be recorded at elevated temperature, as described before, when the PS is above the glass transition temperature and liquid, or, for simplicity of handling the samples, at room temperature (ex situ). The quenching from the liquid to the glassy state has in no case lead to differences in the form of the rim profile. It can be analyzed as described before [29] (to be more precise, we have used in the following the third-order Taylor expanded model based on the full Stokes equations since it applies to a non-restricted range of slip lengths, in contrast to e.g. the strong-slip lubrication model). For reasons of comparability, all profiles were recorded at a hole radius of 12 m to ensure that approximately the same amount of liquid is collected in each of the rims.
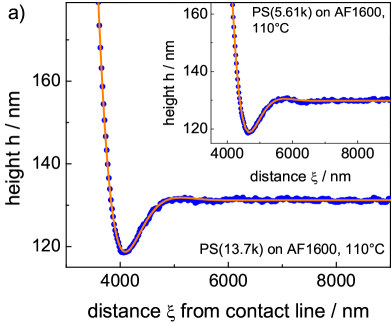
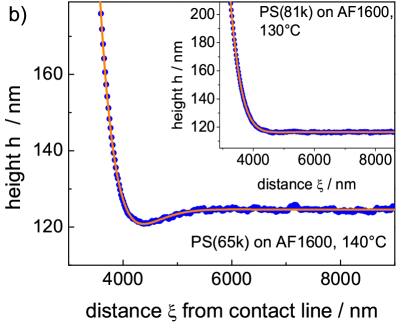
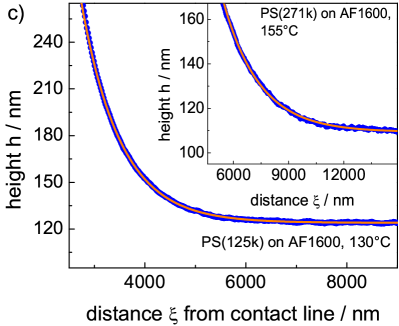
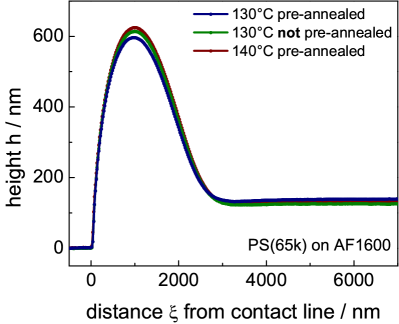
Rim profiles exhibit two distinct morphological shapes: a) an oscillatory and b) a monotonic decay. Exemplarily, Fig. 10 shows typical portions of oscillatory and monotonically decaying rim shapes and the corresponding fit functions (exponentially damped sinusoidal oscillation and exponential decay, respectively) to the experimental data for various molecular weights. The oscillatory decay, which is characterized by a significant trough where the rim merges into the unperturbed film (”wet side”), is illustrated in Fig. 10a. In some cases, the experimental data for this part of the rim profile even exhibits a slight overshoot as compared to the initial film thickness (see inset of Fig. 10a). With increasing , the trough becomes progressively smaller (see Fig. 10b). Finally, it vanishes and the rim exhibits a monotonically decaying profile (see Fig. 10c). If two exponential decay lengths can be separated from each other (which is always the case for a damped oscillation where the decay lengths are a pair of two complex conjugate), the quantification of the slip length and of the capillary number (and also of the viscosity by measuring the instantaneous dewetting velocity prior to quenching the sample to room temperature) is possible. The determination of in the case of a single exponential decay, however, necessitates the knowledge of and, therefore, also of the viscosity . The theoretical models and the application of the fit functions to the rim profile data are discussed in detail in Ref. [29]. As illustrated in Fig. 10a-c and especially Fig. 11a, profiles show progressively flatter declines for increasingly larger molecular weights : The rim significantly widens at the expense of a decrease in maximum rim height, an observation also reported in Ref. [58]. For a given , however, no systematic dependency on the dewetting temperature and, thus, on the viscosity of the polymer melt can be recorded (see Fig. 11b and Fig. 12) [59].
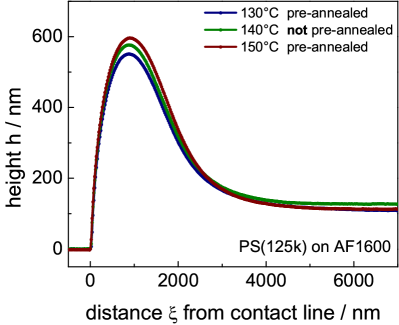
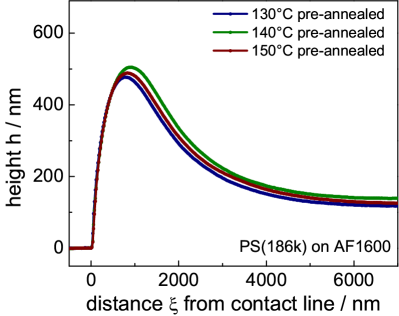
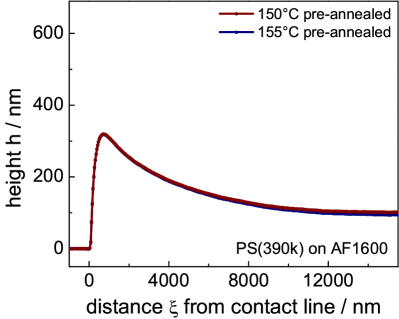
To check the influence of possible internal stress in the polymer film due to the preparation process [38, 60, 61], the films prepared on mica were annealed prior to the transfer to the AF 1600 substrate (c.f. section 2). A comparison of profiles with and without pre-annealing was exemplarily tested for two molecular weights, PS(65k) and PS(125k), and is shown in Fig. 12. For our systems, we could not detect a systematic influence of pre-annealing on the form of the rim profile for a fixed molecular weight (see also section 3.2.3) [59].
3.2.3 Evaluation of the Slip Length
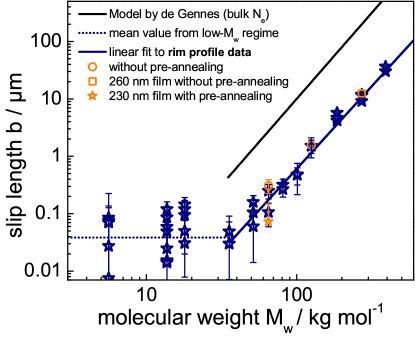
Fig. 13 depicts the results of the slip length in view of the molecular weight in a double-logarithmic representation: Below the critical molecular weight for chain entanglements , the slip length reaches values up to 150 nm at maximum. For , the slip length strongly increases with the molecular weight or the length of the polymer chain, respectively. To be more precise, a scaling exponent of 2.9(2) between the slip length and the molecular weight, i.e. with , is found. This result is in excellent agreement with the outcome of the hole growth dynamics (see section 3.1.2). The values for are systematically lowered compared to the expectation by de Gennes (i.e. , see Ref. [31]) based on literature values for the molecular size [47] and the bulk entanglement length [55]. The pre-factor is obtained from the linear fit to the experimental data in the double-logarithmic representation: For fixed , the rim profile analysis leads to , which is a factor of 3.2 larger compared to the bulk entanglement length of 163 monomer units [62].
3.2.4 Checks of Consistency and Validity
The general consistency of this method to extract the slip length and the capillary number from liquid rim profiles was checked for PS(13.7k) dewetting from OTS and DTS substrates in our previous publications [26, 29]: The viscosity (which was determined from the capillary number and the dewetting velocity) turned out be in excellent agreement with independent (bulk) viscosimeter data. In situ measurements did prove that the slip length was independent of the radius of the holes (the range between 2.5 and 17 m was tested). Dewetting experiments for various film thicknesses (between 50 and 230 nm) also lead to consistent results. The method, consequently, yields reliable results for the slip length and the viscosity of dewetting thin polymer films on the silanized Si wafers. In the following, the identical consistency and validity checks are performed for the dewetting experiments on the AF 1600 substrate.
Determination of the PS Film Viscosity
For AF 1600 substrates, the capillary number is extracted from the analysis of the experimentally recorded rim profiles up to PS(81k). The knowledge of the surface tension of the polymeric liquid ((PS) = 30.8 mN/m, [63]) and the experimental determination of the actual dewetting velocity (from optical hole growth measurements) enable the calculation of the viscosity of the polymer melt via for a given dewetting temperature. Dewetting experiments were performed for various molecular weights of PS melts below and above the critical molecular weight for entanglements. The results are given in Fig. 14 and Tab. 2. Within the experimental error, good agreement with independent viscosimeter measurements and their extrapolation according to the WLF equation [52, 53, 54, 55] is achieved. From monotonically decaying rims only one decay length can be obtained. Therefore, the capillary number and, thus, the viscosity cannot be extracted for PS(101k) and larger on the AF 1600 substrate.
| (∘C) | (Pa s) | (Pa s) | |
|---|---|---|---|
| 35.6k | 120 | ||
| 35.6k | 130 | ||
| 51.5k | 125 | ||
| 51.5k | 130 | ||
| 51.5k | 140 | ||
| 65k | 130 | ||
| 65k | 140 | ||
| 81k | 130 | ||
| 81k | 140 |
Preparation Conditions and Non-Newtonian Effects
In the context of the results of this dewetting study concerning the flow dynamics of thin polymer films, a discussion of the influence of potential viscoelastic effects is necessary. A source of viscoelastic effects are residual stresses caused by the fast solvent evaporation during the spin-coating process. To safely exclude this issue, dewetting experiments were typically performed after a pre-annealing step on the mica substrate (c.f. section 2). However, to test the influence of this procedure, additional experiments were carried out without annealing prior to dewetting. Rim profiles of these as-cast films were analyzed and compared to pre-annealed samples: No systematic influence of the pre-annealing step is found for the typical molecular weights of PS(65k) and PS(125k) used in this study (see Fig. 12). The slip lengths determined from these experiments are still roughly one order of magnitude lower than expected from literature values for (see Fig. 13). Consequently, for ”mature” holes exhibiting fully developed rims, the flow dynamics and morphologies are not significantly affected by polymer relaxation processes that could potentially originate from thin film preparation and residual stresses.
| (∘C) | (s) | (1/s) | (∘C) | (s) | (1/s) | ||||
|---|---|---|---|---|---|---|---|---|---|
| 35.6k | 120 | 11.55 | 0.0045 | 0.052 | 125k | 130 | 57.5 | 0.0003 | 0.019 |
| 35.6k | 130 | 0.81 | 0.0546 | 0.044 | 125k | 150 | 1.39 | 0.0167 | 0.023 |
| 51.5k | 125 | 9.75 | 0.0023 | 0.022 | 186k | 130 | 222 | 0.0002 | 0.052 |
| 51.5k | 130 | 2.81 | 0.0065 | 0.018 | 186k | 140 | 28.05 | 0.0012 | 0.034 |
| 51.5k | 140 | 0.36 | 0.0863 | 0.031 | 186k | 150 | 5.4 | 0.0072 | 0.039 |
| 65k | 130 | 6.5 | 0.0074 | 0.048 | 271k | 140 | 100.5 | 0.0006 | 0.057 |
| 65k | 140 | 0.8 | 0.0368 | 0.029 | 271k | 150 | 19.35 | 0.0040 | 0.077 |
| 81k | 130 | 13.15 | 0.0092 | 0.121 | 271k | 155 | 9.55 | 0.0041 | 0.039 |
| 81k | 140 | 1.66 | 0.0647 | 0.108 | 390k | 150 | 66.5 | 0.0004 | 0.029 |
| 101k | 130 | 27.8 | 0.0037 | 0.103 | 390k | 155 | 32.9 | 0.0018 | 0.058 |
| 101k | 140 | 3.52 | 0.0197 | 0.069 |
Further the question arises whether the flow itself is Newtonian, i.e. whether the viscosity is independent of the shear rate within the range of shear rates present. Weissenberg numbers smaller than 1 assure that viscoelastic effects of the polymer melt can safely be neglected [64]. The present experimental configuration, given by the dewetting temperatures and the molecular weights of the polymer, results in characteristic relaxation times, shear rates, and Weissenberg numbers for which estimates can be calculated (see Tab. 3): Relaxation times are determined via the viscosity , obtained from the WLF equation (c.f. Refs. [52, 53, 54, 55]), and the shear modulus of the polymer melt. Shear rates were estimated as described in Ref. [30] resulting in an upper limit for the corresponding Weissenberg numbers Wi=. As indicated in Tab. 3, Weissenberg numbers calculated from experiments on the AF 1600 substrate do not exceed a value of 0.1. Consequently, the occurrence of non-Newtonian effects is not expected for the examined molecular weights and the low shear rates (see Tab. 3) in such dewetting experiments. The analysis of the dewetting experiments presented in this study can therefore safely be based on the assumption of Newtonian flow.
Impact of the Film Thickness
Finally, the question arises whether slippage of a thin liquid film, representing fluid motion in a confined geometry, depends on the level of confinement. To test the effect of the film thickness on the slip length, an additional dewetting experiment (without pre-annealing) was performed using PS(271k) at 140C with a film thickness of 260 nm. The results are presented within Fig. 13 as the red data points: The analysis of the rim profile of this hole gave a slip length of 12.4 m. This is, within the experimental error, in very good agreement with the corresponding slip length of 11.8 m for a 115 nm thick PS(271k) film. A further hole growth experiment in a 230 nm PS(65k) film (after a typical pre-annealing of the film on mica) was recorded at 130C. The analysis of the corresponding rim profile exhibited a slip length of 73 nm. Both experiments using thicker films do not show a significant increase in the slip length.
4 Discussion
In literature, slip lengths determined from molecular dynamics (MD) simulations in non-wetting conditions are reported to be in the range of 15 molecular diameters [65]. Approximating the molecular diameter by twice the radius of gyration of a polymer coil (for PS(13.7k): nm) results in values for the slip length of up to 100 nm. From this point of view, the experimental results for the slip length on AF 1600 below are in good accordance with the theoretical expectation.
For molecular weights above , is found in accordance with de Gennes’ prediction. However, using the bulk value for the entanglement length, , slip lengths are expected to be roughly one order of magnitude larger than what is found in our experiments. The deviations can be explained by a reduced entanglement density compared to bulk values. This is quantified by an increased entanglement length of =517.
According to the fact that slip lengths are reproduced for markedly thicker films, we conclude that the observed reduction of the entanglement density is not caused by the confinement of the film but is localized at the solid/liquid interface. The lack of a significant temperature dependence highlights the fact that slippage and flow dynamics are directly related to inter-chain entanglements rather than viscosity: The difference in chain length between e.g. PS(51.5k) at =125C and PS(271k) at =155C is responsible for a increase in slip of two orders of magnitude, while the viscosity ( Pa s) is identical for the two examples [30].
4.1 Reduced Interfacial Entanglement Density and its Implications
The analysis of the slip length as a function of the molecular weight of the polymer has shown that close to the interface, deviations from bulk properties are to be expected. Polymer chain entanglements and hence the entanglement length of the polymer are related to the packing of the polymer chains in the bulk. Close to an interface, however, the chains pack differently. The reduced entanglement density in the vicinity of the solid/liquid interface results from a reduction in the volume pervaded by a polymer chain at an interface as described by Brown and Russell [66]: The polymer coil cannot cross the boundary at the interface that rather acts as a reflecting plane, as previously proposed by Silberberg [67, 68] and is known as Silberberg’s principle. Chain segments fold back on the same chain and, thus, the degree of coil-coil interpenetration decreases (c.f. Fig. 15). The reflection process causes a decrease of the radius of gyration normal to the plane, but does not affect the radius of gyration parallel to the plane. The polymer coil can be imagined having an ellipsoidal rather than a spherical shape [69]. Close to the interface or the wall, the volume pervaded by a given chain length is smaller than in the bulk. Brown and Russell [66] suggest that the vertical distance affected by this phenomenon can be approximated at most by the radius of gyration of the polymer. Hence, the normal bulk entanglement density is expected to be recovered at a distance of above the interface. They analytically calculate a reduction of the entanglement density or, analogous to that, an increase of the entanglement length by approximately a factor of 4, which is in accordance with the experimental results presented here.
The impact of the density of inter-chain entanglements on the flow profile and the slip velocity at the interface of an entangled polymer melt and a solid substrate is difficult to resolve on the molecular level. For a simple liquid, true and apparent slip can be distinguished according to the velocity of the first as compared to subsequent layers of molecules (see e.g. Ref. [44]). In contrast to this, the motion of polymer chains in entangled melts is much more complex, as e.g. De Gennes’ reptation model shows. To interpret our results, we propose an apparent slip velocity that depends on the entanglement density within this interfacial layer. This picture does not take into account relative motion on the segmental level within this region and, therefore, cannot answer the question whether the monomers or even the chain segments that are in contact with the substrate exhibit a non-zero velocity. The apparent slip velocity, representing the entire interfacial region, shifts the flow profile within the liquid film towards larger velocities. In the strong-slip situation that we are reporting here for entangled polymers, the flow profile is linear and its gradient is unaffected by slippage as it depends on the viscosity of the (bulk-like) residual film. Fig. 16 illustrates the difference between apparent slip for a reduced interfacial entanglement density and for a bulk-like entanglement network.
Recent experimental studies probing the effect of confined polymer chains in thin films have also provided strong evidence of deviations from polymer bulk properties and a reduced entanglement density: Si et al. report a decrease of the entanglement density in thin freestanding films compared to the bulk polymer [71]. They conclude that the total entanglement density is constant, but due to the reduced chain overlap near interfaces, the proportion of self-entanglements increases at the expense of inter-chain entanglements. Rowland et al. recently studied the squeeze flow of entangled polymers in confined conditions of films thinner than the size of the bulk macromolecule [72]. Their experiments reveal a reduced interpenetration of neighboring chains in favor of self-penetration leading to a weakening of the polymer network and a decreased resistance to melt flow due to the presence of less inter-chain entanglements. Molecular dynamics simulations and corresponding primitive path analysis for polymers studying chain conformations and local dynamics corroborate the occurrence of a reduced entanglement density near a wall [73, 74]. Further studies address the film preparation process as a source of non-equilibrium conformations: Barbero and Steiner studied the mobility at the surface, i.e. at the liquid/air interface of thin polymer films by an electric field technique [75]. They attributed the reduced effective viscosity in the case of as-cast films compared to annealed ones to a reduced, non-equilibrium entanglement density resulting from preparation.
The effect of an altered entanglement network and, in particular, a reduced entanglement density at an interface also impacts polymer/polymer (and their interdiffusion) or polymer/air interfaces, for which the hypothesis of the reflection of polymer segments is applicable, too. The unique feature of the experimental results presented here consists in the fact that sliding friction is sensitive to the proximate properties of the polymer at the solid/liquid interface, though the residual bulk film is not necessarily affected by confinement. The above mentioned experimental studies [71, 72] relate their findings to the confinement given by the film thickness (and its ratio to the spatial dimensions of the polymer chains therein). Here, however, the direct and unique impact of the solid/liquid interface upon chain conformations and rheological properties of the polymers in the vicinity of a substrate or wall is revealed. The thickness of the layer affected by the reduced entanglement density at the solid/liquid interface is at most in the range of the radius of gyration [66]. depends on the chain length of the polymer and varies for typical PS molecular weights used in this study from 5.2 nm for PS(35.6k) up to 17.1 nm for PS(390k) [76]. Moreover, at the polymer/air interface, a reduced entanglement density might be present that - potentially - propagates the same distance away from the interface into the polymer film. For films thicker than 100 nm, the ”bulk region” of the film is even for the largest of our study still more than two times larger than the superposition of both effects (layers). In some studies, however, is chosen to be larger than the film thickness, leading to effects of ”overlapping interfacial layers”. Hence, these special cases cannot be captured via the methods presented here. These cases are especially dependent on the preparation procedure and show massive effects upon pre-annealing [60, 61].
The decrease of the entanglement density at the solid/liquid interface is, as described before, inferred from the determination of the entanglement length . This value corresponds to a molecular weight of the polymer strand between two entanglements of kg/mol. Thus, being significantly larger than the critical molecular weight found for bulk situations, this consideration suggests that the formation of entanglements at the interface starts at a higher molecular weight as compared to the upper residual (bulk-like) polymer film.
4.2 Quantitative Comparison of Slip Lengths: Rim Profile Analysis vs. Hole Growth Dynamics
Slip lengths obtained from hole growth dynamics agree qualitatively with those gained from the analysis of rim profiles: Slip is independent of the molecular weight for unentangled films, whereas the slip length increases for molecular weights above .
While results are also in good quantitative agreement for low molecular weights, however, a significant deviation is found for : data extracted from hole growth are typically larger by a factor of about 2 - 3 compared to data obtained from the rim shapes (c.f. Fig. 7). This difference is potentially caused by an inevitable assumption included in the energy dissipation model of sliding friction: Regarding the two dimensional representation of the rim, the lateral extent of slippage in the -direction, i.e. in the direction of dewetting, is approximated by the rim width . The latter is again connected to the slip length: Increasingly larger slip lengths are correlated to wider rims. The rim width, however, has been defined for practical reasons as the distance between the three-phase contact line and the -coordinate at which the rim height has dropped to 1.1 times the initial film thickness . If, however, the ”true” lateral extent of slippage is significantly smaller than the rim width , the frictional energy is dissipated over a narrower extent and the slip lengths obtained from the model for the hole growth analysis (assuming a superposition of viscous flow and slippage, c.f. Eq. (3.1)) would be systematically too large. This hypothesis is supported by the dewetting experiments on the AF 1600 substrate below the critical chain length for entanglements: In case of these solely weakly slipping PS films, no significant difference between slip lengths obtained from rim profiles and hole growth dynamics is found. Consequently, the significant shift between the results of the two methods is either correlated to the change of the rim profile, in combination with the definition of the rim width, or, and this is the second possibility to be taken into consideration, to the change of the velocity profile according to the presence of slippage. Gaining information about the extent of slippage is difficult. In section 5, an experimental system will be introduced that might help to shed light on this issue: thin block-copolymer films dewetting from hydrophobic substrates.
Besides the aforementioned methodical issue of the differences concerning the determination of slip lengths from the hole growth dynamics and the analysis of rim profiles, a further explanation can be hypothesized: Rim profiles are sensitive to the local hydrodynamic boundary condition in the region of the solid/liquid interface where the rim decays into the unperturbed film. The hole growth analysis, however, is sensitive to the entire extent of the rim width .
To sum up the above discussion, the systematic differences in slip length originating from the two different techniques may be linked to the lateral extent of slippage underneath the liquid rim.
5 Pushing to the Limits - More Sophisticated Dewetting Experiments
In the previous section, we addressed the question to what lateral extent the area underneath the rim is exposed to interfacial flow and in particular interfacial frictional forces: Which part of the liquid rim is actually capable to slide over the substrate’s surface? To explore this issue, we modified the experimental system and switched to liquids with an internal structure, block-copolymers. The idea is to prepare a well-known di- or triblock-copolymer microphase-separated thin film and then to induce flow by dewetting from a hydrophobic substrate. Similar to homopolymer films, holes break up and grow in time while forming a liquid rim. At distances from the three-phase contact line where the interfacial microphase structure is exposed to shear forces, a structural orientation of the cylindrical micro-domains is expected to be induced; the phenomena of shear-induced orientation has already been reported by other studies before [77, 78].
After quenching the sample to room temperature, the film is detached from the substrate and the rim is imaged from underneath with the AFM. Differences in the orientational structure of the two phases become visible for different lateral displacements from the three-phase contact line [79]: Fig. 17 depicts an AFM (tapping mode™) phase image of a PS/PEP block-copolymer (Kraton® G1701E, volume percentage of PS: 28%, Kraton Polymers, Houston, TX, USA) film dewetting from a hydrophobized (OTS-covered) Si wafer. A comparison of the width of the oriented area, as e.g. determined from Fourier transforms of consecutive small areas, to the topographical rim width can now be accomplished. Roughly, the width of the oriented area is 1-2 m. The range corresponds to the width of the rim. (Details will be published elsewhere [79].) Ongoing studies focus on the systematic modification of slip properties by a variation of the type of substrate, which has shown to be strongly correlated to slip of PS homopolymer melts (c.f. Fig. 3), and further parameters such as the dewetting temperature [79]. In case of a strong-slip boundary condition, the structure close to the solid/liquid interface should experience friction rather than significant shear: it is rubbed over the surface. This should affect the microphase structure in a different way as compared to shearing, which is related to a no- or weak-slip boundary condition.
6 Conclusion and Outlook
The challenge of explaining facets such as sliding friction and the fluid dynamics of polymers at the solid/liquid interface on the molecular level is a main task in the field of micro- and nanofluidics. The aim of this study was the characterization of the flow dynamics of thin polymer films in view of the hydrodynamic boundary condition at the solid/liquid interface. Dewetting experiments are a powerful tool to study the mechanisms of friction and the rheological properties of polymers on the nanoscale.
Hole growth dynamics and rim profile analysis allow for a quantification of the impact of the molecular weight and, in particular, of chain entanglements on the sliding properties of polymers: On smooth, hydrophobic AF 1600 surfaces, a weak-slip situation is found for PS melts with molecular weights below the critical molecular weight for entanglement formation. This result is independent of the molecular weight in this regime. However, slip is strongly enhanced above : The slip length scales with the third power of the molecular weight of the polymer, as predicted by De Gennes. At the interface itself, the density of chain entanglements is found to be reduced by a factor of 3 to 4 compared to the bulk, caused by the different packing of polymer chains at an interface according to Silberberg’s principle.
The results are of extraordinary importance in view of a series of applications such as e.g. polymer extruders or, in general, microfluidic devices. As pointed out by Bocquet and Barrat [8], the mean velocity of a pressure drop flow in a cylindrical channel is increased by a factor as compared to the classical no-slip boundary condition, where is the slip length and the thickness of the channel. Thus, the permeability of channels and also of porous media is highly increased by slippage. An increase in the slip length for longer polymer chains by two orders of magnitude, as presented in this study, would also impact the mean velocity in sub-micron channels by orders of magnitude.
In addition to the influence of polymer chain length on slippage discussed in this paper, we shortly reported on significant dynamical and morphological differences purely resulting from the choice of different hydrophobic substrates (c.f. Fig. 3). In terms of drawing a general molecular picture, not only the degree of entanglement but also structural and dynamic properties on the monomer and segmental level imposed by the substrate have to be discussed. As presented in Tab. 1, characteristic substrate properties such as roughness (based on AFM measurements), macroscopically determined wetting properties and surface energies, however, reveal no clear correlation of one of these parameters to slippage. For a discussion of the interfacial structure on the molecular level and its implications on the dynamical properties of the liquid, the reader is referred to our recent study [80]: Neutron and x-ray reflectometry are powerful experimental tools to explore the molecular structure of the solid/liquid interface and add new insights explaining the differences in the sliding properties of PS on different substrates. Currently, also dewetting experiments are extended: The aforementioned methods and theoretical models can also be applied to the spatial and temporal evolution of thin poly(methyl methacrylate) (PMMA) films. The results might shed further light on the link between the monomeric structure of the polymer and slippage at the solid/liquid interface.
Aside from the analysis of the hole growth dynamics and the morphology of the rim surrounding the hole, recent experiments and theoretical studies also focus on the liquid rim instability as an indicator for the slip/no-slip boundary condition [12, 13, 14, 81]. This instability is comparable to the Rayleigh-Plateau instability emerging on a surface of a cylindric jet of water flowing off a tap. The resulting surface corrugations can be optically observed and the jet finally decays into discrete droplets. The morphology of the instability of retracting straight fronts in thin liquid films is governed by the hydrodynamic boundary condition: While under no-slip conditions symmetric liquid bulges (co-moving with the front) are found, slippage causes the formation of asymmetric finger-like structures. This phenomenon can be optically observed and represents a further way to access slippage in thin polymer films. Further characteristics of the instability such as the evolution of the wavelength of the instability along the receding front (on lateral scale and perpendicular to the surface plane) are subject of ongoing investigations [81].
We hope that our results will motivate further theoretical studies and simulations, as this phenomenon could be of high relevance for other experiments such as e.g. colloidal particles moving through a liquid medium.
Acknowledgments
The authors acknowledge financial support from the German Science Foundation (DFG) under grant JA905/3 within the priority program 1164 ”Micro- and Nanofluidics” and the graduate school GRK1276. We thank B. Wagner, A. Münch, R. Seemann, M. Rauscher and M. Müller for fruitful discussions and R. Seemann for providing some of the viscosity data.
References
References
- [1] Squires T M and Quake S R 2005 Microfluidics: Fluid physics at the nanoliter scale Rev. Mod. Phys. 77 977
- [2] Song H, Tice J D, Ismagilov R F 2003 A microfluidic system for controlling reaction networks in time Angew. Chemie 115 792
- [3] Jacobs K, Seemann R, Kuhlmann H 2005 Mikrofluidik Nachrichten a. d. Chemie 53 300
- [4] Fraikin J-L, Teesalu T, McKenney C M, Ruoslahti E and Cleland A N 2011 A high-throughput label-free nanoparticle analyser Nature Nanotechnology 6 308
- [5] Leslie D C, Easley C J, Seker E, Karlinsey J M, Utz M, Begley M R and Landers J P 2009 Frequency-specific flow control in microfluidic circuits with passive elastomeric features Nature Physics 5 231
- [6] Neto C, Evans D R, Bonaccurso E, Butt H-J and Craig V S J 2005 Boundary slip in Newtonian liquids: A review of experimental studies Rep. Prog. Phys. 68 2859
- [7] Lauga E, Brenner M P and Stone H A 2007 Microfluidics: The no-slip boundary condition Springer Handbook of experimental fluid mechanics ed C Tropea, A L Yarin and J F Foss (Berlin, Heidelberg, New York: Springer)
- [8] Bocquet L and Barrat J-L 2007 Flow boundary conditions from nano- to micro-scales Soft Matter 3 685
- [9] Kargupta K, Sharma A and Khanna R 2004 Instability, dynamics, and morphology of thin slipping films Langmuir 20 244
- [10] Münch A, Wagner B A and Witelski T P 2005 Lubrication models with small to large slip lengths J. Eng. Math. 53 359
- [11] Blossey R 2008 Thin film rupture and polymer flow Phys. Chem. Chem. Phys. 10 5177
- [12] Münch A and Wagner B 2005 Contact-line instability of dewetting thin films Physica D 209 178
- [13] King J R, Münch A and Wagner B 2009 Linear stability analysis of a sharp-interface model for dewetting thin films J. Eng. Math. 63 177
- [14] Münch A and Wagner B 2011 Impact of slippage on the morphology and stability of a dewetting rim J.Phys.: Condens. Matter 23 184101
- [15] Rauscher M, Blossey R, Münch A and Wagner B 2008 Spinodal dewetting of thin films with large interfacial slip: Implications from the dispersion relation Langmuir 24 12290
- [16] Navier C L M H 1823 Mémoire sur les lois du mouvement des fluids Mem. Acad. Sci. Inst. Fr. 6, 389 and 432
- [17] Pit R, Hervet H and Léger L 2000 Direct experimental evidence of slip in hexadecane: Solid interfaces Phys. Rev. Lett. 85 980
- [18] Zhu Y and Granick S 2002 Limits of the hydrodynamic no-slip boundary condition Phys. Rev. Lett. 88 106102
- [19] Cottin-Bizonne C, Jurine S, Baudry J, Crassous J, Restagno F and Charlaix E 2002 Nanorheology: An investigation of the boundary condition at hydrophobic and hydrophilic interfaces Eur. Phys. J. E 9 47
- [20] Cottin-Bizonne C, Barrat J-L, Bocquet L and Charlaix E 2003 Low-friction flows of liquid at nanopatterned interfaces Nat. Mater. 2 237
- [21] Cho J-H J, Law B M and Rieutord F 2004 Dipole-dependent slip of Newtonian liquids at smooth solid hydrophobic surfaces Phys. Rev. Lett. 92 166102
- [22] Kong L-T, Denniston C and Müser M H 2010 The crucial role of chemical detail for slip-boundary conditions: molecular dynamics simulations of linear oligomers between sliding aluminum surfaces Modelling Simul. Mater. Sci. Eng. 18 034004
- [23] Tretheway D C and Meinhart C D 2002 Apparent fluid slip at hydrophobic microchannel walls Phys. Fluids 14 L9
- [24] Fetzer R, Jacobs K, Münch A, Wagner B and Witelski T P 2005 New slip regimes and the shape of dewetting thin liquid films Phys. Rev. Lett. 95 127801
- [25] Fetzer R, Rauscher M, Münch A, Wagner B A and Jacobs K 2006 Slip-controlled thin film dynamics Europhys. Lett. 75 638
- [26] Fetzer R, Münch A, Wagner B, Rauscher M and Jacobs K 2007 Quantifying hydrodynamic slip: A comprehensive analysis of dewetting profiles Langmuir 23 10559
- [27] Fetzer R and Jacobs K 2007 Slippage of newtonian liquids: Influence on the dynamics of dewetting thin films Langmuir 23 11617
- [28] Bäumchen O, Jacobs K and Fetzer R 2008 Probing slippage and flow dynamics of thin dewetting polymer films Proc. Eur. Conf. on Microfluidics (Bologna) Dec 10-12, 2008
- [29] Bäumchen O, Fetzer R, Münch A, Wagner B and Jacobs K 2009 Comprehensive analysis of dewetting profiles to quantify hydrodynamic slip IUTAM Symp. on Adv. in Micro- and Nanofluidics ed M Ellero, X Hu, J Fröhlich and N Adams (Springer)
- [30] Bäumchen O, Fetzer R and Jacobs K 2009 Reduced interfacial entanglement density affects the boundary conditions of polymer flow Phys. Rev. Lett. 103 247801
- [31] De Gennes P G 1979 Ecoulements viscométriques de polymères enchevêtrés C. R. Acad. Sci. B 288 219
- [32] Vrij A 1966 Possible mechanism for the spontaneous rupture of thin, free liquid films Discuss. Faraday Soc. 42 14
- [33] Herminghaus S, Jacobs K, Mecke K, Bischof J, Fery A, Ibn-Elhaj M, Schlagowski S 1998 Spinodal dewetting in liquid crystal and liquid metal films Science 282 916
- [34] Seemann R, Herminghaus S and Jacobs K 2001 Dewetting patterns and molecular forces: A reconciliation Phys. Rev. Lett. 86 5534
- [35] Seemann R, Herminghaus S and Jacobs K 2001 Gaining control of pattern formation of dewetting liquid films J. Phys.: Condens. Matter 13 4925
- [36] Jacobs K, Seemann R and Herminghaus S 2008 Stability and dewetting of thin liquid films Polymer Thin Films ed O K C Tsui and T P Russell (Singapore: World Scientific)
- [37] Bäumchen O and Jacobs K 2010 Can liquids slide? Linking stability and dynamics of thin liquid films to microscopic material parameters Soft Matter 6 6028
- [38] Podzimek D, Saier A, Seemann R, Jacobs K and Herminghaus S 2001 A universal nucleation mechanism for solvent cast polymer film rupture arXiv:cond-mat/0105065
- [39] Si wafers have to be cleaned from hydrocarbon residues which are typical leftovers from the polishing process. Usually, oxidizing agents are used like 1:1 mixtures of . After that it is essential to rinse the wafers in hot MilliQ™ water to remove the oxidized substances from the wafer surface. The wafer surface should be controlled with a reflective light microscope in dark field illumination, where particles of some nm in size can still be detected. On a carefully cleaned Si wafer, a water droplet spreads, the contact angle is zero.
- [40] Sagiv J 1980 J. Am. Chem. Soc. 102 92
- [41] Brzoska J B, Ben Azouz I and Rondelez F 1994 Silanization of solid substrates: A step toward reproducibility Langmuir 10 4367
- [42] Lessel M, Bäumchen O, Fetzer R, Marquant L, Klos M, Hähl H and Jacobs K 2011 in preparation
- [43] Israelachvili J 1992 Intermolecular and surface forces 2nd edition (New York: Academic Press)
- [44] Bäumchen O and Jacobs K 2010 Slip effects in polymer thin films J. Phys.: Condens. Matter 22 033102
- [45] Care has to be taken that the holes have already a certain size, since the precondition for the validity of the mentioned growth laws is the self-similarity of the growing rim.
- [46] Redon C, Brochard-Wyart F and Rondelez F 1991 Dynamics of dewetting Phys. Rev. Lett. 66 715
- [47] Redon C, Brzoska J B and Brochard-Wyart F Dewetting and slippage of microscopic polymer films 1994 Macromolecules 27 468
- [48] Brochard-Wyart F, De Gennes P-G, Hervet H and Redon C 1994 Wetting and slippage of polymer melts on semi-ideal surfaces Langmuir 10 1566
- [49] Münch A 2005 Dewetting rates of thin liquid films J. Phys.: Condens. Matter 17 S309
- [50] Jacobs K, Seemann R, Schatz G and Herminghaus S 1998 Growth of holes in liquid films with partial slippage Langmuir 14 4961
- [51] Brochard-Wyart F, Debregeas G, Fondecave R and Martin P 1997 Dewetting of supported viscoelastic polymer films: Birth of rims Macromolecules 30 1211
- [52] Viscosimeter data was provided by R. Seemann for PS(12.5k) and PS(65k) for different temperatures.
- [53] The reconstruction of the viscosity as function of temperature according to the WLF equation requires the knowledge of the glass transition temperature for the corresponding , the Vogel temperature and the ratio of the parameters : For PS melts, (in Kelvin units) is given by K. is found according to literature [55]. The glass transition temperature of supported PS films was determined from ellipsometric measurements of the change of the thermal expansion coefficient: K kg mol-1 and K is found.
- [54] Williams M L, Landel R F and Ferry J D 1955 The temperature dependence of relaxation mechanisms in amorphous polymers and other glass-forming liquids J. Am. Chem. Soc. 77 3701
- [55] Rubinstein M and Colby R H 2003 Polymer Physics (New York: Oxford University Press)
- [56] Note that can also be quantified by in situ AFM measurements, if the hole radius and the rim width are recorded simultaneously. The temporal resolution of AFM imaging and piezo drifts correlated to the high-temperature environment, however, restrict this pathway to retarded dewetting velocities especially at temperatures close to of the polymer melt.
- [57] Liquids can be imaged by AFM using non-contact mode. Hereby, care has to be taken to adjust the scan parameters appropriately. By scanning the same area at different scan sizes, possible damages can be inferred. It is also possible to quench a polymer melt to the glassy state. In non-contact mode, our experiments did not reveal differences between rim profiles of glassy and of liquid polymer.
- [58] Seemann R, Herminghaus S and Jacobs K 2001 Shape of a liquid front upon dewetting Phys. Rev. Lett. 87 196101
- [59] Within one , the rim profiles deviate slightly in maximum rim height, yet neither significantly with the dewetting temperature nor with the pre-annealing procedure. The deviation in height is rather likely caused by small variations of the prepared film thickness and differences in hole radius which lead to small variations of the volume of the rim.
- [60] Reiter G, Hamieh M, Damman P, Sclavons S, Gabriele S, Vilmin T and Raphaël E 2005 Residual stresses in thin polymer films cause rupture and dominate early stages of dewetting Nature Materials 4 754
- [61] Damman P, Gabriele S, Coppée S, Desprez S, Villers D, Vilmin T, Raphaël E, Hamieh M, Al Akhrass S and Reiter G 2007 Relaxation of residual stress and reentanglement of polymers in spin-coated films Phys. Rev. Lett. 99 036101
- [62] To the best of our knowledge, a smaller value for the molecular size than , [47], is not reasonable for a polymer melt.
- [63] Brandrup J, Immergut E H and Grulke E A 1999 Polymer Handbook (4th ed., John Wiley & Sons Inc.: New York)
- [64] Morozov A N and van Saarloos W 2007 An introductory essay on subcritical instabilities and the transition to turbulence in visco-elastic parallel shear flows Physics Reports 447 112
- [65] Barrat J-L and Bocquet L 1999 Large slip effect at a nonwetting fluid-solid interface Phys. Rev. Lett. 82 4671
- [66] Brown H R and Russell T P 1996 Entanglements at polymer surfaces and interfaces Macromolecules 29 798
- [67] Silberberg A 1982 Distribution of conformations and chain ends near the surface of a melt of linear flexible macromolecules J. Colloid Interface Sci. 90 86
- [68] Silberberg A 1988 Distribution of segments near the surface of a melt of linear flexible macromolecules: Effect on surface tension J. Colloid Interface Sci. 125 14
- [69] Kraus J, Müller-Buschbaum P, Kuhlmann T, Schubert D W and Stamm M 2000 Confinement effects on the chain conformation in thin polymer films Europhys. Lett. 49 210
- [70] Soles C L and Ding Y 2008 Nanoscale polymer processing Science 322 689
- [71] Si L, Massa M V, Dalnoki-Veress K, Brown H R and Jones R A L 2005 Chain entanglement in thin freestanding polymer films Phys. Rev. Lett. 94 127801
- [72] Rowland H D, King W P, Pethica J B and Cross G L W 2008 Molecular confinement accelerates deformation of entangled polymers during squeeze flow Science 322 720
- [73] Vladkov M and Barrat J-L 2007 Local dynamics and primitive path analysis for a model polymer melt near a surface Macromolecules 40 3797
- [74] Meyer H, Kreer T, Cavallo A, Wittmer J P and Baschnagel J 2007 On the dynamics and disentanglement in thin and two-dimensional polymer films Eur. Phys. J. Special Topics 141 167
- [75] Barbero D R and Steiner U 2009 Nonequilibrium polymer rheology in spin-cast films Phys. Rev. Lett. 102 248303
- [76] is calculated via , where denotes the Kuhn length and the number of Kuhn monomers. For PS, =1.8 nm and =g mol-1) is found according to [55].
- [77] Zvelindovsky A V, Sevink G J A, van Vlimmeren B A C, Maurits N M and Fraaije J G E M 1998 Three-dimensional mesoscale dynamics of block copolymers under shear: The dynamic density-functional approach Phys. Rev. E 57 R4879
- [78] Knoll A, Horvat A, Lyakhova K S, Krausch G, Sevink G J A, Zvelindovsky A V and Magerle R 2002 Phase behavior in thin films of cylinder-forming block copolymers Phys. Rev. Lett. 89 035501
- [79] Hähl H, Podzimek D, Bäumchen O and Jacobs K 2011 in preparation
- [80] Gutfreund P, Bäumchen O, van der Grinten D, Fetzer R, Maccarini M, Jacobs K, Zabel H, and Wolff M 2011 Surface correlation affects liquid order and slip in a newtonian liquid to be published arXiv:1104.0868v1 [cond-mat.soft]
- [81] Marquant L, Bäumchen O, Jacobs K, Blossey R, Münch A and Wagner B 2011 in preparation