POLARIZED POSITRONS FOR THE ILC —
UPDATE ON SIMULATIONS††thanks: Talk was presented at the POSIPOL 2011
Workshop, IHEP, Beijing, 28–30 August 2011.
Abstract
To achieve the extremely high luminosity for colliding electron-positron beams at the future International Linear Collider [1] (ILC) an undulator-based source with about 230 meters helical undulator and a thin titanium-alloy target rim rotated with tangential velocity of about 100 meters per second are foreseen. The very high density of heat deposited in the target has to be analyzed carefully. The energy deposited by the photon beam in the target has been calculated in FLUKA. The resulting stress in the target material after one bunch train has been simulated in ANSYS.
DESY-12-018
1 Introduction
The positron-production target for the ILC positron source is driven by a photon beam generated in an helical undulator placed at the end of main electron linac [2]. The undulator length is chosen to provide the required positron yield. The source is designed to deliver 50% overhead of positrons. Therefore, the positron yield has to be 1.5 positrons per electron passing the undulator. The required active length of the undulator is about 75 meters for the nominal electron energy of 250 GeV, the undulator -value has been chosen to be 0.92, the undulator period is 11.5 mm and a quarter-wave transformer is used as optical matching device (OMD). The photon first harmonic energy cutoff is 28 MeV, the average energy of photons is about 29 MeV and the average photon beam power is about 180 kW in a train of 2625 bunches with a frequency of 5 Hz. Although only relatively small fraction of total photon beam energy deposited in the target (about 5%), the peak energy density deposited in target is high due to the small opening angle of the synchrotron radiation in the helical undulator resulting in a small photon spot size on the target. For example, for 500 meters space between the undulator and target, the average radius of the photon beam is approximately 2 mm and the peak energy density could achieve 120 J/g in the 0.4 radiation length thick titanium-alloy target rotated with 100 m/s tangential velocity.
There is no experimental data indicating the upper limit of the peak energy density deposited by photons in the titanium alloy material with 90% of titanium, 6% of aluminium and 4% of vanadium. The analysis of the electron beam induced damage to the SLC positron target [3] and the simulations of thermal shock [4] show that the energy deposition limit is about 30 J/g for tungsten with 25% of rhenium target irradiated by 33 GeV electrons and a general criteria of failure due to an equivalent (von-Mises) stress of 50% of tensile strength may apply to this target material [4].
The thermal structural modeling of a rotated titanium target irradiated by helical undulator photons has been performed for the NLC by W. Stein and J. Sheppard [5]. They recommend to consider as “safe” thermal stresses below one third to one half of the yield stress.
In this paper, the thermal stress in the ILC positron source target has been estimated for the SB2009 set of parameters [2].
2 Energy Deposition and Temperature in
Target.
Static Model of Material Response
The energy transfer from the photon beam into temperature of target material and the structural deformation and mechanical stress coupled with this temperature rise due to complexity of these time-dependent, cross-coupled and nonlinear processes cannot be treated with the highest level of details [6]. Therefore, the choice of simulation tools and reasonable approximations and simplifications plays an important role.
The energy deposition in the target has been calculated in FLUKA [7]. An amount of energy is counted as deposited if after collisions the primary or secondary particles have energies lower than the energy cut-offs. The FLUKA default cut-offs were used: 1.511 MeV – for electrons and positrons and 333 keV – for photons.
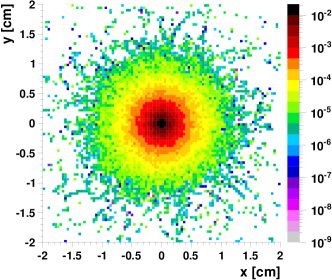
Figure 1 shows the “original” FLUKA data distribution (i.e. without any scaling factors) of the energy deposited close to the back side of the target. The energy is given in units of GeV per cubic centimeter and per impinging on the target photon.
The temperature rise in the target for given a energy deposition has been calculated according to the following equation
where is the number of electrons per bunch (), is the photon yield (1.94 photons per electron and per 1 meter of undulator), is the length of undulator (70 meters), is the number of bunches crossing the same volume/bin, is the target density (4.49 g/cm3) and is the specific heat capacity (0.523 J/(g K)).
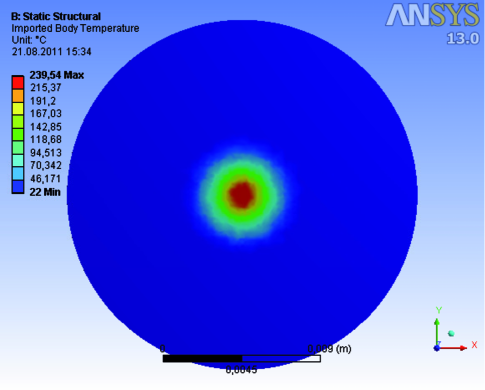
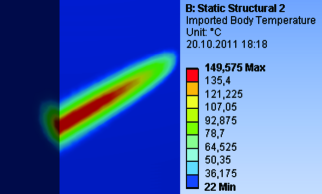
The temperature data in a 1.48 cm thick cylindrical titanium target after the first 100 bunches has been imported into ANSYS [8]. The temperature distribution on the back side of the target is shown in Figure 2. The maximal increase of temperature per bunch is about 2.2 K.
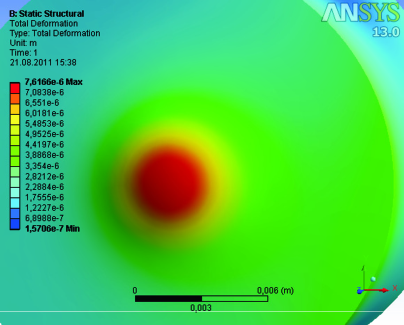
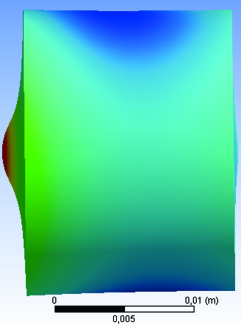
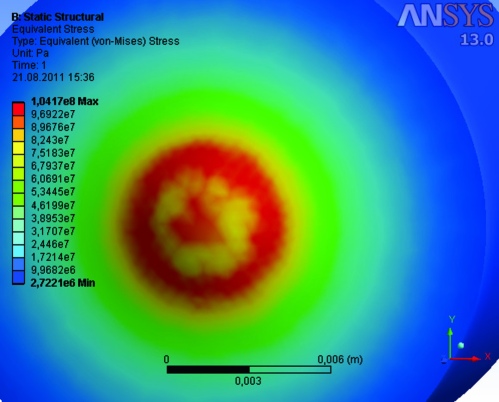
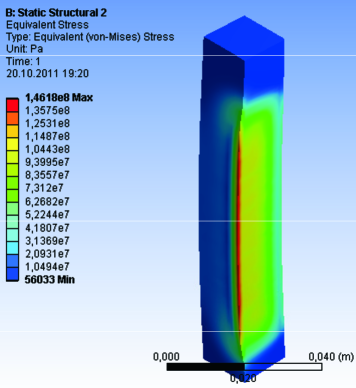
As a first step, a statical ANSYS model of the target material response to the heat load (see, Figures 1 and 2) has been applied. The total deformation and equivalent von-Mises stress are shown in Figs. 3 and 4. The maximum of equivalent stress is about 100 MPa on the back side of the target in the circular area around the photon beam axis with a radius of approx. 2 mm. This stress is about 12% of the tensile yield strength for titanium alloy (the properties of Ti6Al4V alloy, grade 5 can be found, for example, in Ref. [9]).
3 Evolution of Thermal Stress in Time
To simulate the time evolution of thermal stress in the positron source target, the target movement has been analyzed more accurately and ANSYS transient (explicit) model of deformation and stress has been used.
We consider the tangential velocity of the target rim (1 meter in diameter) of 100 meters per second as velocity in direction in a Cartesian system. The energy deposited after one pulse (1312 bunches with 554 ns bunch separation) as function of coordinate is shown in Fig. 5. This Figure shows also the energy deposited by a single bunch and the corresponding temperature rise. Both profiles on Fig. 5 are plotted for highest energy deposition: in the -direction – close to the target back side and in the middle of bunch(es) – in -direction. The bunch overlapping factor is defined as the ratio of the maximal deposited energy after a complete bunch train with respect to the maximum after just one bunch. This factor for the nominal SB2009 source parameters is about 59.
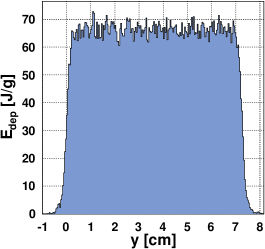
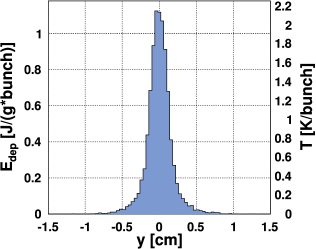
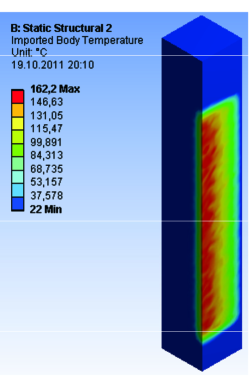
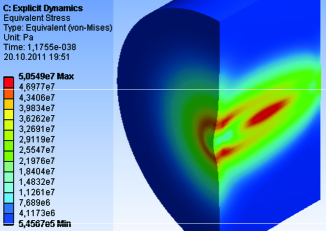
Figure 6 shows the temperature and equivalent stress in the “rotated” target. The target has been cut in the middle plane in order to show the distributions inside the target. The static ANSYS model for the equivalent stress after one bunch train does not take into account thermal diffusion and thus overestimates the stress induced in the target.
To reduce the effect of thermal diffusion on the stress and to study the time-dependent dynamic effects, another model has been used. In this model the temperature distribution after one single bunch has been scaled with the above-mentioned bunch overlapping factor. The cylindrical geometry of the target has been chosen to keep the symmetry of the model and to reduce the computing time. Figure 7 shows the temperature distribution after “59 bunches”.
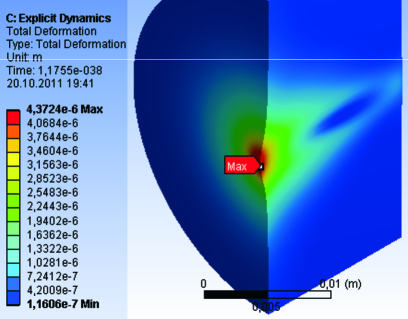
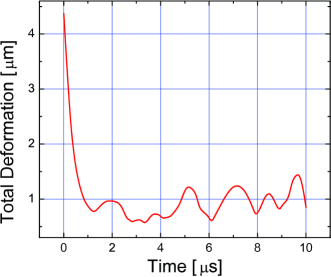
The total deformation after 59 bunches is plotted in Fig. 8 and the evolution in time of maximal deformation is shown in Fig. 9. The starting time (0 sec.) corresponds to the end of the pulse. The reflections from the target surfaces and interference of the waves result in the series of maxima at the level about 25% of the initial deformation.
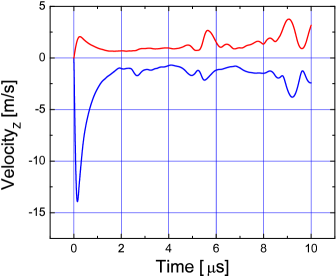
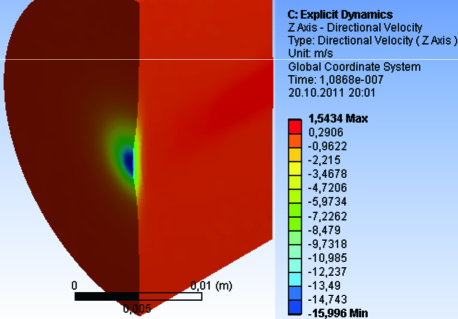
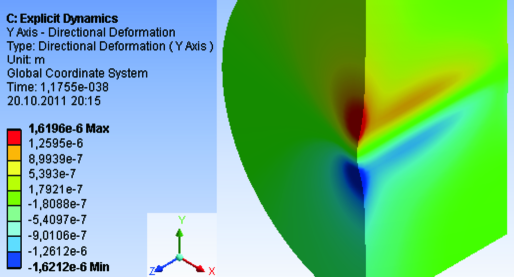
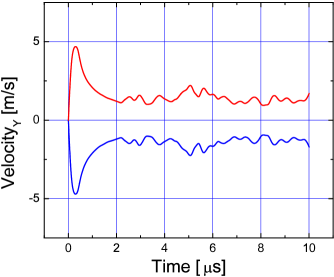
The deformation transverse to the beam axis (radial deformation) contributes only minor (about one third) to the total deformation. The time dependence of the dominating longitudinal (-component) velocity is presented in Fig. 10 showing the positive velocity directed out of the target and negative velocity. Figure 11 shows a snapshot of the time evolution for the -distribution after one pulse and with 0.1 s delay at the moment when the negative velocity has reached the maximum. The -component of deformation and velocity are also shown in Figs. 12 and 13. Because of geometry and beam symmetry, the deformation, maximal and minimal -dependencies on time are symmetrical (mirrored) too. It has to be noted that the transient effects during the pulse were not considered and thus the all velocities are starting from zero level at the end of the beam pulse.
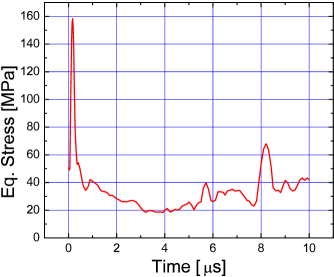
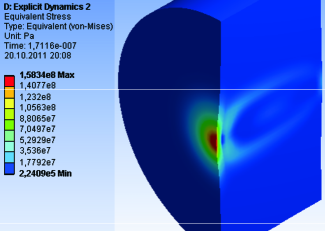
The time evolution of the maximal equivalent (von-Mises) stress in the target is plotted in Fig. 14. The stress distributions after one beam pulse and additional 0.1 s delay are shown in Fig. 15. The peak stress value is about 160 MPa which corresponds to 18% of tensile yield strength. This level of stress can be considered as acceptable.
Summary
The energy deposition in the ILC positron source target has been simulated in FLUKA for the SB2009 set of parameters. The peak energy density in the rotated titanium-alloy target is about 120 J/g for the conservative choice of a magnetic focusing device (quarter-wave transformer) and 250 GeV electron beam energy. The different simplified (static and transient) ANSYS models have been used to estimate the thermal stress induced by fast temperature rise and thermal expansion of the target. The peak stress is about 160 MPa. It is less then 20% of tensile yield strength. Such stress will not damage the target.
Outlook
In the future, also the cooling of the target has to be added in model. The procedure used so far, in which the deposited energy is converted into temperature, has to be eliminated and the direct import of the heat source into ANSYS can additionally improve the accuracy of stress estimations. The thermal and structural effects in the target have to be also simulated taking into account the time structure of the bunch train.
Acknowledgments
We would like to thank the organizers and the host of POSIPOL 2011 for this fruitful and encouraging workshop and for hospitality.
Work supported by the German Federal Ministry of Education and Research, Joint Project R&D Accelerator “Spin Management”, contract No. 05H10GUE.
References
- [1] N. Phinney, N. Toge and N. Walker (eds.), International Linear Collider Reference Design Report: Volume 3: Accelelator August 2007.
-
[2]
ILC SB2009 Proposal Document (December, 2009).
http://ilc-edmsdirect.desy.de/ilc-edmsdirect/file.jsp?edmsid=D00000000900425. - [3] V. K. Bharadwaj, Y. K. Batygin, J. C. Sheppard, D. C. Schultz, S. Bodenstein, J. Gallegos, R. Gonzáles, J. Ledbetter, M. López, R. Romero, T. Romero, R. Rutherford and S. Maloy, Proc. of PAC 2001 , 2123 (2001).
- [4] W. Stein, A. Sunwoo, V. K. Bharadwaj, D. C. Schultz and J. C. Sheppard, Proc. of PAC 2001 , 2111 (2001).
- [5] W. Stein and J. C. Sheppard, NLC polarized positron photon beam target thermal structural modeling, Tech. Rep. SLAC-TN-03-045, LCC-0087, UCRL-ID-148940, SLAC (Stanford, CA, 2002).
- [6] J. M. Zazula, Proc. of the 2nd Workshop on Simulating Accelerator Radiation Environments, CERN, Geneva, Switzerland, 9 - 11 Oct 1995 , 26 (1995).
- [7] A. Fassò, A. Ferrari, J. Ranft and P. R. Sala, FLUKA: a multi-particle transport code, Tech. Rep. CERN-2005-10, INFN TC_05/11, SLAC-R-773, CERN (Geneva, 2005).
- [8] ANSYS. http://www.ansys.com.
- [9] Aerospace Specification Metals, Inc., Titanium Ti6Al4V (Grade 5), Annealed http://asm.matweb.com/search/SpecificMaterial.asp?bassnum=MTP641.