-title2011 Hadron Collider Physics symposium 11institutetext: Triumf, BC, V6T 2A3, Canada 22institutetext: University of British Columbia, BC, V6T 1Z4, Canada
A search for resonances in the dilepton channel in 1.04 fb-1 of pp collisions at TeV with the ATLAS detector
Abstract
The first ATLAS result on a search for a high mass top pair resonance at the LHC, in the subset of events where both W bosons from the top decays decay to either a final state electron or muon, is presented. The analysis is performed on 1.04 of pp collisions at TeV. Numerous models predict the production of new massive particles that decay preferentially to a top-anti-top pair, including Randall-Sundrum models where the observation of a Kaluza-Klein excitation of the gluon may be the first indication of the existence of an extra spatial dimension. In the analysis presented, a simple observable, sensitive to resonance mass, is formed by summing the missing transverse energy, and the transverse momenta of the selected jets and the two candidate leptons. A deviation from the Standard Model prediction for this observable is searched for using Bayesian statistical methods that compare the yields, and shapes, of the Standard Model background and signal predictions for KK-gluons with masses between 500 and 1600 GeV. No excess over the Standard Model is observed and 95% C.L. upper limits are set on the production cross-section times branching ratio to top quarks for KK-gluon-like resonances. The results of the analysis exclude Randall-Sundrum KK-gluons with masses less than 840 GeV.
1 Introduction
The top quark holds a peculiar position in the Standard Model as the most massive known particle and the only fermion with mass close to the electroweak symmetry breaking scale. As a result, the top quark has a special role in many scenarios that go beyond the Standard Model (SM), many of which predict new particles that decay preferentially to top anti-top quark pairs refTopSpec . One such scenario is the Randall-Sundrum model with a single finite extra-dimension (RS1) where the SM fermions and gauge bosons can propagate in the bulk. In this scenario the observation of the first Kaluza-Klein (KK) excitation of the gluon may be the first indication of the existence of an extra spatial dimension ref1 . Such a new particle would manifest itself at the LHC as a massive resonance.
This note describes an analysis that searches for a KK-gluon-like resonance at the LHC with the ATLAS experiment111For a more detailed description of this analysis see Ref. ref2 . ref2 ; ref:atlasexp . We study the case where the KK-gluon decays into top anti-top pairs that further decay to leptons (electron, muon, or tau), and look in final states with reconstructed electrons and muons. The presence of two neutrinos from the decays in the final state complicate full mass reconstruction. The scalar sum of the transverse momenta, , of selected leptons and jets, denoted , is measured and combined with the missing transverse energy expected from the neutrinos to form the variable .
is correlated to the invariant mass of the event and provides some discrimination between resonance and SM events. A deviation from the SM expectation in the spectrum is searched for using a template shape fitting method for a range of resonance masses. In the absence of signal, a limit is set on the production cross-section times branching ratio, , and this limit is converted into a mass limit on the KK-gluon in the RS1 model.
2 Event Selection
This analysis is conducted on data corresponding to an integrated luminosity of 1.04 fb-1 that was collected from March to July 2011. The event selection relies on reconstructed leptons, jets, and . Lepton candidates are required to be isolated in order to suppress backgrounds from hadron and heavy flavour decays inside jets. Electron candidates are required to have GeV and . In order to avoid the barrel-endcap transition region in the ATLAS calorimeter, electrons with are excluded. Muon candidates are required to have transverse momentum GeV, and . Candidate jets must have GeV and .
The event selection is motivated by the final state of the top anti-top decays, where events will contain two jets, two oppositely charged leptons, and at least two neutrinos. Events are first preselected by requiring they meet the following criteria:
-
•
Satisfy good data quality requirements.
-
•
Pass either single electron or muon triggers with thresholds GeV and GeV respectively.
-
•
Contain exactly 2 oppositely charged leptons (electrons or muons).
-
•
Have dilepton mass, .
-
•
Contain two or more jets.
Within the pool of preselected events, control and signal regions are defined. For the control region a sample depleted of signal and dominated by Z+jets events is defined by placing an additional cut on the invariant mass of the two leptons, GeV, and is restricted to the and channels.
The definition of the signal region depends on the dilepton channel. The and channels require a cut of GeV and exclude the control region, . The channel requires GeV. The different treatment for the channel is required due to the background composition of the channel which includes diboson processes, and a Z+jets component dominated by which has its own source of .
3 Backgrounds
Standard Model (SM) top anti-top production is the dominant and irreducible background as its final state is identical to that of a resonance. However, the additional non-top-pair SM background sources listed below can mimic the top pair final state and also contribute to the final selection:
-
•
Z+jets
-
•
Wt production
-
•
Diboson production
-
•
”Fakes”: QCD multijet and W+jets processes where one or two jets are misidentified as leptons.
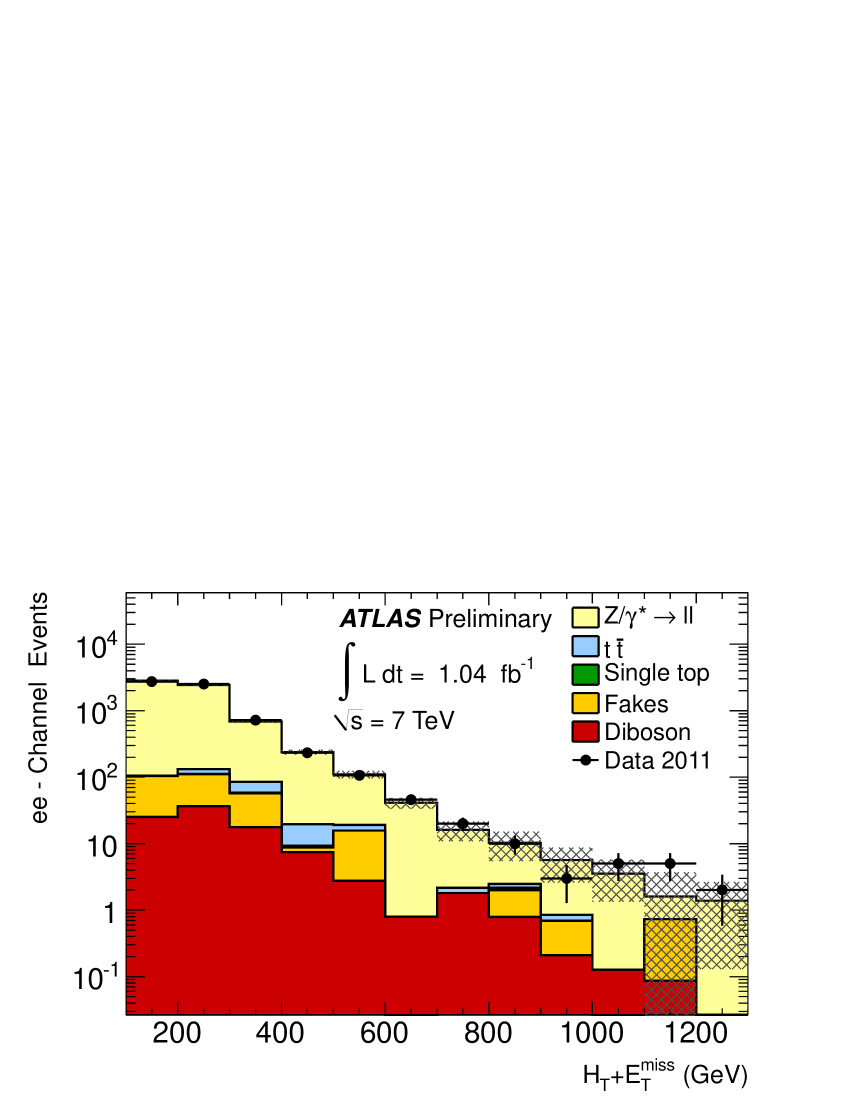
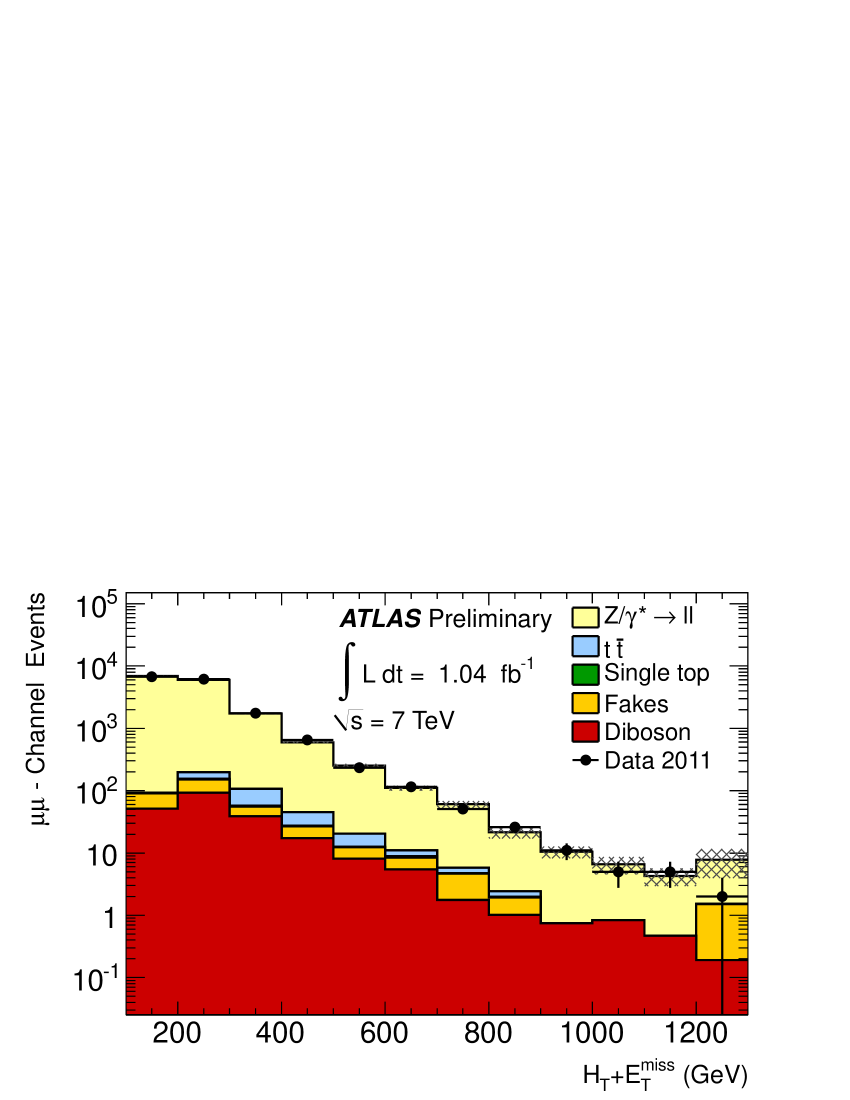
The and diboson background predictions are determined from Monte Carlo. Fakes are estimated using a completely data-driven method ref:ttbarxsec . The prediction derived from Monte Carlo is corrected for both its yield and jet multiplicity by normalizing to data within the control region (for and decays).
We perform a validation of the distribution in the data control sample as shown in figure 1. The expected background composition and the number of observed selected events in the signal region are shown in table 1.
| Process | Predicted number of background events |
|---|---|
| 1920 | |
| + jets | 130 |
| + jets | 140 |
| + jets | 85 |
| Diboson | 83 |
| Single top | 98 |
| Fakes | 96 |
| Total background | 2550 |
| Data | 2659 |
4 Statistical Analysis
A deviation from the Standard Model is searched for using the discriminating variable . A comparison of the Monte Carlo prediction for the distribution and observation in data, including a hypothetical signal, is shown in figure 3.
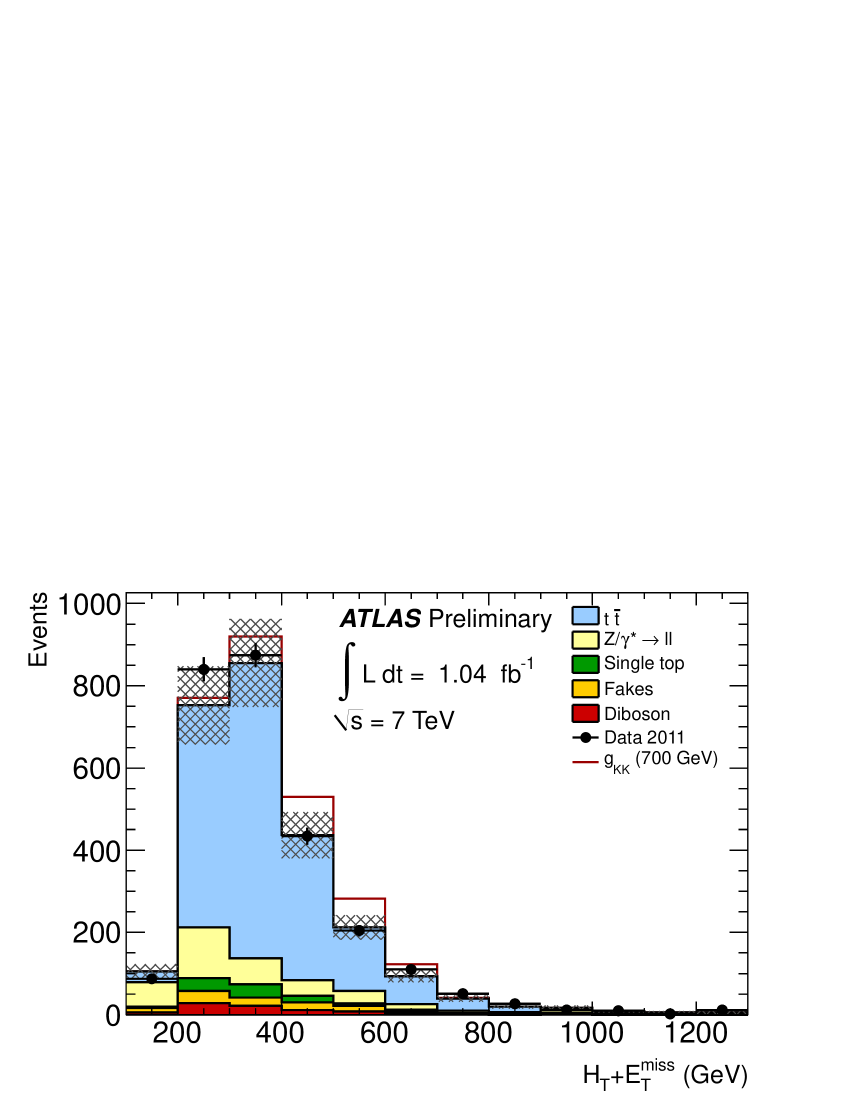
For the statistical analysis we construct a binned likelihood function for the number of signal and background events, based on Poisson statistics for the distribution.
| (1) |
The likelihood depends on the expected number of events in each bin () which are the sum of the expected signal and background events. The indices and denote the signal and background templates respectively. The dependence of the likelihood function on the hypothetical resonance mass is implicit via the template shapes () which describe the fractional contribution of each bin to the overall yield. Thus, is determined by the expected total yields for signal and background (), the background shape, and the resonance mass.
Gaussian priors () are used for the systematics nuisance parameters () that control the bin-by-bin one sigma systematic variations () that simultaneously alter the shape and yield of the templates. Systematics are fully correlated between signal and background. Various sources of systematic uncertainty were studied to determine both rate and shape dependencies. A non-negligible impact on the analysis was found for the sources listed in Table 2.
| SM background | =700 GeV | ||
| (+) | (-) | ||
| Lepton ID / Trigger | 3.4 | 4.5 | 4.2 |
| Jet energy scale | 7.4 | 6.7 | 3.5 |
| Jet energy resolution | 2.3 | - | 2.5 |
| ISR/FSR | 0 | 2.3 | 2.5 |
| Parton Shower | 1.4 | 1.4 | - |
| Generator | 4.8 | 4.8 | - |
| 2.7 | 2.7 | 1.2 | |
| Total Systematic | 12.8 | 11.5 | 6.6 |
A p-value quantifies the probability of observing an excess assuming the null hypothesis that is at least as great as what is observed in data. A p-value is evaluated using a log-likelihood ratio as a test statistic; a value of 44% is obtained indicating that the data contains no statistically significant excess above the SM ref2 .
Following the Bayesian prescription, a marginalized posterior probability density is obtained and used to determine 95% C.L. upper limits on the number of signal events for a series of hypothesized resonance masses. The limits on the number of signal events are converted into the limit on as a function of mass shown in figure 4.
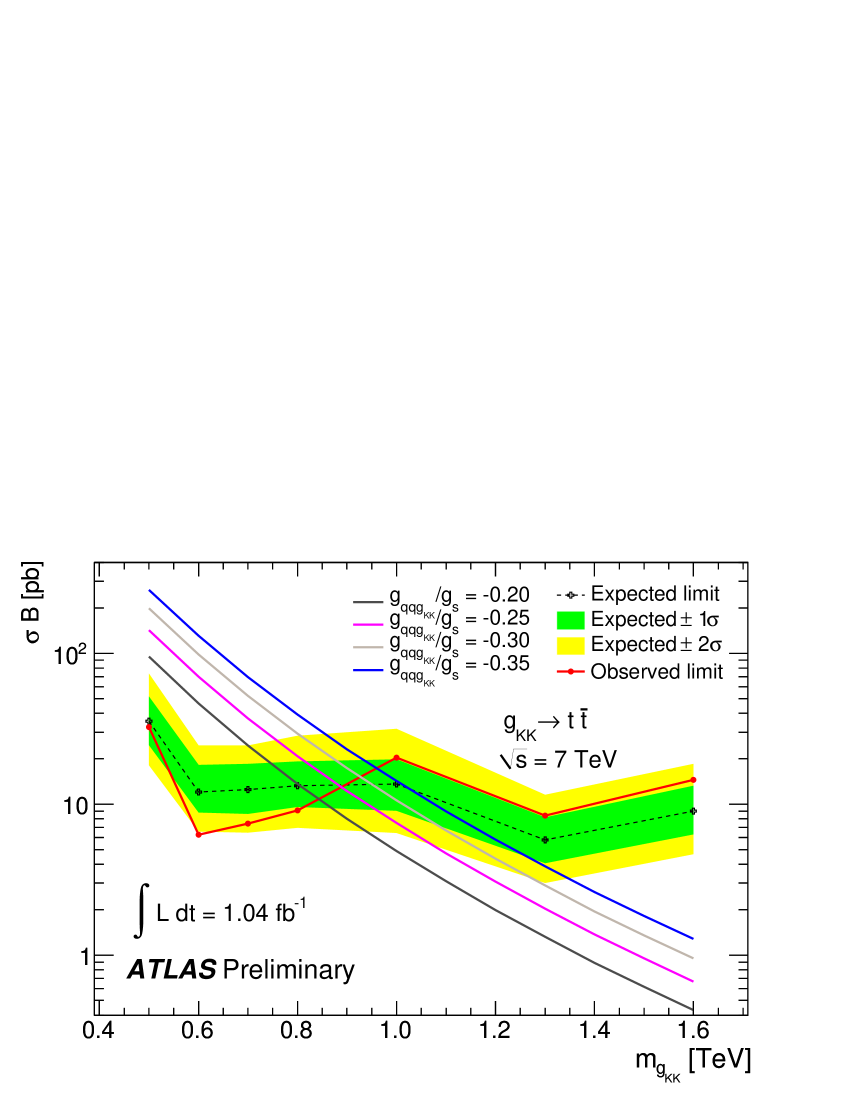
Corresponding limits on the KK-gluon () mass are obtained and shown in table 3 for the default RS1 model and a series of other scenarios where the coupling strength between the KK-gluon and the light quarks has been enhanced, thereby increasing the production cross section.
| Mass Limit (TeV) | ||
|---|---|---|
| Expected | Observed | |
| -0.20 | 0.80 | 0.84 |
| -0.25 | 0.88 | 0.88 |
| -0.30 | 0.95 | 0.92 |
| -0.35 | 1.02 | 0.96 |
5 Results and Conclusion
A high mass resonance was searched for in 1.04 fb-1 of data collected by the ATLAS detector. The distribution of the selected events in the signal region agrees well with the Standard Model prediction. No significant deviation is observed and limits on are set for a series of resonance masses.
We exclude a KK-gluon resonance as predicted by the RS1 model with mass below 840 GeV at 95% C.L. Stronger limits are set for cases where the coupling strength between the KK-gluon and light quarks is enhanced ref2 .
References
- (1) R. Frederix, F. Maltoni, JHEP 01, (2009) 047.
- (2) B. Lillie. et. al., JHEP 09, (2007) 074.
- (3) ATLAS Collaboration, ATLAS-CONF-2011-148.
- (4) ATLAS Collaboration, JINST 3, (2008) S08003.
- (5) ATLAS Collaboration, ATLAS-CONF-2011-117.