On the Ionization of Luminous WMAP Sources in the Galaxy : Constraints from He Recombination Line Observations with the GBT
Abstract
The Wilkinson Microwave Anisotropy Probe (WMAP) free-free foreground emission map is used to identify diffuse ionized regions (DIR) in the Galaxy (Rahman & Murray 2010). It has been found that the 18 most luminous WMAP sources produce more than half of the total ionizing luminosity of the Galaxy. We observed radio recombination lines (RRLs) toward the luminous WMAP source G49.750.45 with the Green Bank Telescope near 1.4 GHz. Hydrogen RRL is detected toward the source but no helium line is detected, implying that . This limit puts severe constraint on the ionizing spectrum. The total ionizing luminosity of G49 ( s-1) is 2.8 times the luminosity of all radio H ii regions within this DIR and this is generally the case for other WMAP sources. Murray & Rahman (2010) propose that the additional ionization is due to massive clusters ( for G49) embedded in the WMAP sources. Such clusters should produce enough photons with energy 24.6 eV to fully ionize helium in the DIR. Our observations rule out a simple model with G49 ionized by a massive cluster. We also considered ‘leaky’ H ii region models for the ionization of the DIR, suggested by Lockman and Anantharamaiah, but these models also cannot explain our observations. We estimate that the helium ionizing photons need to be attenuated by 10 times to explain the observations. If selective absorption of He-ionizing photons by dust is causing this additional attenuation, then the ratio of dust absorption cross sections for He- and H-ionizing photons should be 6.
1 Introduction
The existence of a diffuse ionized gas in the Galaxy is evident from a variety of observations (Hoyle & Ellis 1963, see review by Haffner et al. 2009). This gas, referred to as the Warm Ionized Medium (WIM), is now considered as one of the major components of the interstellar medium. The WIM has been primarily studied using optical emission lines, which indicates that it contains 90% of the ionized mass of the Galaxy (Haffner et al. 2009). These observations also indicate that the local electron density of the WIM is in the range 0.01 to 0.1 cm-3. In the inner galaxy, the optical lines suffer extinction and hence the distribution of the ionized gas has been studied in the radio frequency regime. In particular, low frequency ( 2 GHz) RRL observations have been used to detect diffuse ionized regions (DIRs) with local density in the range 1 to 10 cm-3. In the literature, this DIR is referred to as Galactic Ridge RRL emission by Davies, Matthews & Pedlar (1972) (see also Gottesman & Gordon 1970), extended low-density ionized gas by Mezger (1978), evolved H ii region by Shaver (1976), H ii envelopes (i.e. low-density envelopes of compact H ii regions) by Lockman (1976) and Anantharamiah (1986) (see also Roshi & Anantharamaiah 2000) and more recently as extended low-density warm ionized medium by Petuchowski & Bennett (1993) and Heiles (1994). The latter authors consider the DIR as a higher density version of the WIM in the inner Galaxy, though the exact relationship between the DIR and WIM is still uncertain.
In addition to spectral lines, DIRs have been studied through radio free-free emission (e.g. Mezger 1978). More recently, Murray & Rahman (2010) used the free-free galactic foreground emission model, obtained from the Wilkinson Microwave Anisotropy Probe (WMAP) data, to study the DIR. For the WMAP measurements of Cosmic Microwave Background (CMB) emission, the galactic foreground is accurately characterized using a maximum entropy model (MEM; Bennett et al. 2003, Gold et al. 2009). The foreground is modeled as a linear combination of emission due to synchrotron, free-free and vibrational excitation of dust with power law frequency dependence. The MEM finally produces sky models for each of these emission processes. Since the free-free model has an angular resolution of 1 (after smoothing), it is more sensitive to emission from DIRs compared to compact H ii regions. Murray & Rahman (2010) used this free-free model to identify emission regions with 94 GHz flux density 10 Jy. By considering that the WMAP sources are associated with known H ii regions, which are either cataloged by Russeil (2003) or identified in the Midcourse Space Experiment (MSX; Price et al. 2001) or Spitzer GLIMPSE (Churchwell et al. 2006) data set, distances can be assigned. The free-free flux density, source angular size and the distance are used to estimate the Lyman continuum (Lyc) luminosity required for ionization balance. They found that the 18 most luminous WMAP sources contribute half of the total ionizing luminosity ( s-1) of the Galaxy.
Rahman & Murray (2010) studied in detail a subset of the luminous WMAP sources. The estimated Lyc luminosities of these sources are in the range to s-1. They show that the radio H ii regions embedded in these WMAP sources contribute only to of the Lyc luminosity obtained from the WMAP emission. Murray & Rahman (2010) suggest that the additional ionization is due to embedded stellar clusters. The mass of the cluster required to produce the ionizing luminosity is . These clusters evaded detection primarily due to heavy dust obscuration in the star forming region.
For the most widely used initial mass function (IMF e.g. Scalo 1986 or Muench et al. 2002) of the stellar content of clusters, the bulk of the ionizing photons occurs for star with mass 40 (equivalent to O5 or earlier). These stars should produce enough photons with energy 24.6 eV so that most of the helium (He) in the DIR should have been ionized. In fact, Heiles et al. (1996) searched for He RRLs from the DIR and did not detect them. Heiles et al. (1996) found that the average is . This limit is about 7.7 times lower than the expected value of 0.1 from cosmic abundance of He, if all the He is in He+. We note here that the He i 5876 observations made toward the WIM also show 0.027 (Reynolds & Tufte 1995; we have taken 1 for the WIM).
In this paper, we present results of 1.4 GHz RRL observations toward G49.750.45, located within the luminous WMAP source G49 (Rahman & Murray 2010), with the National Radio Astronomy Observatory (NRAO) Green Bank Telescope (GBT). Our objective was to do a deep integration toward a single pointing in G49 (i.e. without spatial average) away from bright radio H ii regions and determine . The observations and data analysis procedure are presented in Section 2. As discussed in Section 3, we have detected hydrogen (and carbon) RRL toward G49.750.45 but no He line is detected. The upper limit implies that . The implication of this upper limit on the spectrum of the ionizing source is discussed in Section 4. The main results of the paper is summarized in Section 5.
2 Observing Strategy, RRL Observations and Data reduction
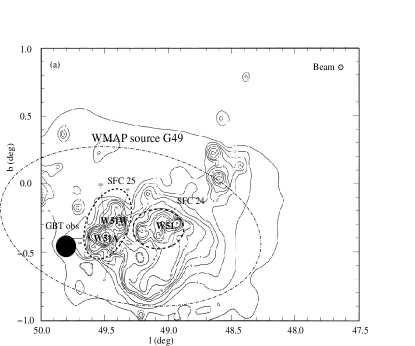
We selected the position G49.750.45, located toward the WMAP source G49 (Rahman & Murray 2010), for observations. The WMAP source is located in galactic longitude away from other dense star forming regions in the inner Galaxy and is near the outer edge of Sagittarius-Carina arm. The star forming complex W51 is located within this source. We selected the position in G49 (see Fig. 1a) such that it is away from compact H ii regions and hence samples the diffuse thermal gas seen by WMAP.
The RRL observations are made with the GBT. The frequency band for the observations is chosen as follows. The approximate average continuum brightness temperature toward G49 at 4.785 GHz (Altenhoff et al. 1979) and 408 MHz (Haslam et al. 1982) are respectively 0.5 K and 150 K. Assuming that the emission at 408 MHz is dominated by non-thermal emission and has a spectral index of 2.6, the expected non-thermal contribution at 4.785 GHz is 0.25 K. An emission measure of 1800 pc cm-6 for the ionized gas is estimated to produce the thermal emission of 0.25 K at 4.785 GHz. We take the electron temperature of 7000 K, same as that of the compact H ii region, for this calculation (Dowens et al. 1980). For the estimated emission measure and a mean electron density of 5 cm-3 (Roshi & Anantharamaiah 2001), the expected signal to noise ratio of RRL detection peaks near 1 GHz. Taking into account RFI near 1 GHz, we decided to observe with the L-band (1.1 to 1.75 GHz) system of the GBT.
Observations were made with the GBT on 13 July 2011. The L-band receiver is a single-beam, dual-linear-polarization system. The FWHM beam width at this frequency is 9′. The GBT spectrometer was used to simultaneously observe the 169, 168, 167 and 166 transitions of hydrogen (H), helium and carbon from both polarizations. A bandwidth of 12.5 MHz and 8192 channels for the spectrometer were selected, which gave a spectral resolution of 1.5 KHz (km s-1). This higher spectral resolution was helpful in editing out narrow band RFI. We employed a dual-Dicke frequency switching to measure the reference spectrum. The frequency is switched by 2.5 MHz, which corresponds to 526 km s-1. All the spectral lines of interest fall within this velocity range. The front-end bandwidth was restricted between 1.3 and 1.45 GHz to reduce the effect of out of band RFI. The total on-source observing time was about 3.5 hrs. The calibrator 3c295 was observed in the beginning for pointing, focus and flux calibration.
The data analysis is done in GBTIDL and Matlab/Octave. Data corresponding to all the transitions and the two polarizations are examined for RFI and averaged separately in GBTIDL. The H i 21cm line, present in the 166 band, was examined and found not to affect the RRL. Online Doppler correction could be done only for the 166 transition and so the residual corrections for other transitions were done by FFT shift method in GBTIDL before averaging. A 3rd order baseline was fitted to these spectra using data points from the spectral region free of RRLs. The velocity resolution of the spectra of different transitions were then made identical by FFT re-sampling (see Roshi et al. 2005). The averaged spectra corresponding to each transition were further edited for bad spectral baseline and RFI. The spectrum corresponding to the 168 transition had narrow band RFI near the expected position of the He line and hence was edited out. The spectral baseline of the X-polarization of the 166 transition had a ripple, which was also excluded from further analysis. Narrow band RFI, which were located at frequencies far from the expected line frequencies, were edited out using a channel weighting scheme (Roshi & Anantharamaiah 2000). The edited spectra were averaged to obtain the final integrated spectrum. The effective integration time of the final spectrum is about 16.4 hrs and average is 22.6 K. The spectral amplitudes are calibrated using the noise cal and hence are given in antenna temperature. To convert to main beam brightness temperature these values need to be multiplied by 1.14, since the observed source is extended and roughly fills the beam.
3 Result
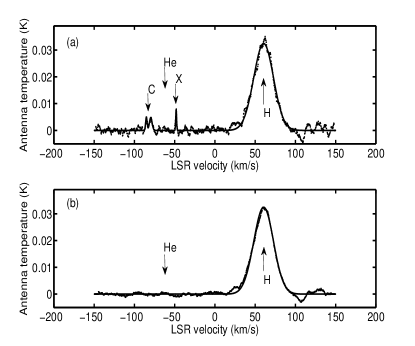
The final spectrum obtained from the data is shown in Fig 1b. The H and carbon RRLs are clearly detected. A line feature corresponding to an unknown transition, marked as X, is also detected. The parameters for Gaussian models of the detected lines are given in Table 1. He line is not detected. To determine the upper limit to the He line intensity, Gaussian models for the carbon and X lines are removed from the integrated spectrum and the resultant spectrum is smoothed to 10.5 km s-1 velocity resolution. The smoothed spectrum is shown in Fig 1c. The root mean square (RMS) of the spectral values over the velocity range 120 to 0 km s-1 is 4.4 10-4. Since there are only 11 points for estimating the RMS, we have taken the upper limit for the He line as the 99.99% confidence limit of the spectral mean (obtained using Student’s t-distribution), which is listed in Table 1. Using this upper limit we determine that . We have neglected the effect of the smaller expected thermal line width for He compared to H to obtain this ratio and have also considered that H is fully ionized in the DIR (Roshi & Anantharamaiah 2001).
4 Discussion
Three ‘Giant’ H ii ( GH ii) regions are located within the WMAP source G49. They are W51, W51A and W51West, all of which are well studied in radio and infrared wavelengths (e.g. Conti & Crowther 2004). The GH ii regions are observed as compact sources in radio continuum images (see Fig 1a). They are located at a kinematic distances of 5.5 kpc (Russeil 2003). RRL observations near 327 MHz have detected lines toward W51, which arise from the DIR since most of the compact H ii regions become optically thick at this frequency (e.g. Roshi & Anantharamaiah 2001). The LSR velocity of the 327 MHz RRLs coincide with those detected from the compact H ii regions at higher frequencies. Therefore in this paper we consider the distance to the WMAP source G49 as 5.5 kpc.
The total Lyc luminosity of GH ii regions after dust extinction correction is 1.1 s-1 (Conti & Crowther 2004). On the other hand, the total Lyc luminosity obtained from WMAP free-free emission after dust extinction correction and using a distance of 5.5 kpc is 3.05 s-1 (Murray & Rahman 2010). The larger ionizing photon requirement obtained from DIR tracers is noted earlier (e.g. Mezger 1978, McKee & Williams 1997). As suggested by Lockman (1976) and Anantharamiah (1986), most of the Lyc photons from H ii regions may leak out to produce low-density envelopes which are observed as the DIR (see also McKee & Williams 1997). In this picture, the ionizing sources are the same star clusters embedded in the GH ii regions (Conti & Crowther 2004). The two ionizing luminosities estimated above for G49 imply that 63 % of the Lyc photons are leaking out of the GH ii regions. Murray & Rahman (2010) suggested another possibility that the DIR are ionized by embedded massive clusters not associated with classical radio H ii regions within the WMAP sources. Such clusters are not directly detected presumably due to high obscuration.
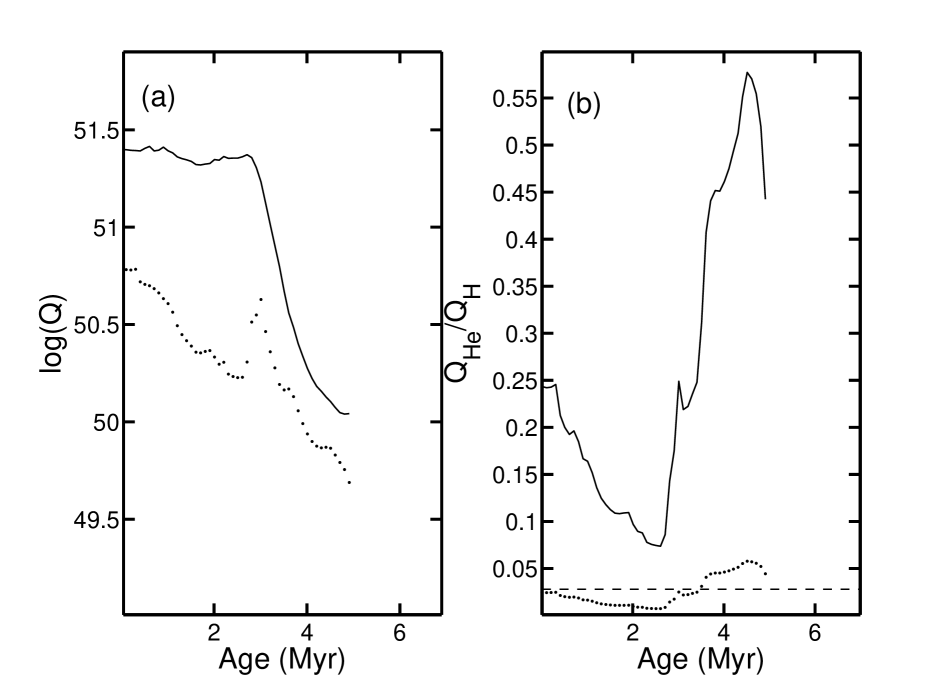
Here we explore the possibility of using He RRL observations toward the G49 region to distinguish between these different possible ionization and to constrain the spectrum of the ionizing photons. Since the ionization potential of He (24.6 eV) is greater than that of H (13.6 eV), the observed He to H line ratio can be used to constrain the ionizing spectrum. We calculate the ionizing photon from a stellar cluster using Starburst99 ( Leitherer et al. 1999, Vázquez & Leitherer 2005). The mass of the cluster to get the required total Lyc photons for G49 is ; the IMF used for this calculation is from Muench et al. (2002) 222The effects of stochasticity on the luminosity of cluster with mass a few times will be investigated in a future publication.. In Murray & Rahman’s picture, a single cluster will have this mass. On the other hand in the Lockman (1976) and Anantharamaiah (1986) pictures the mass gets distributed to three clusters in the three GH ii regions. In either case, the ratio of He ionizing photons, , (photon energy interval 24.6 to 54.4 eV) to the H ionizing photons, , (photon energy interval 13.6 to 24.6 eV) is 0.24 (see Fig 2). From the ionization model of H ii region this implies that the He and H Strömgren spheres overlap (Mathis 1971) and hence He line should have been detected. However, our observations did not detect He line in G49.
The ratio obtained from high frequency RRL observations toward compact H ii regions in G49 is 0.066 (Churchwell, Mezger & Huchtmeier 1974, Lichten, Rodriguez, Chaisson 1979, Thum, Mezger, Pankonin 1980, McGee & Newton 1981, Mehringer 1994, Bell et al. 2011). The low observed for the DIR in G49 thus indicates that the He ionizing photons are eliminated on scales somewhat larger than the compact H ii regions. If the DIR is ionized by clusters embedded in the GH ii regions, as suggested by Lockman (1976) and Anantharamaiah (1986), then one possibility is that the spectrum of the photons changes while diffusing out of the H ii regions. However, models of ‘leaky H ii regions’ show that the He ionizing photons can be significantly suppressed only for low leakage ( 15%) and for effective temperature of ionizing source 45000 K (Hoopes & Walterbros 2003, Wood & Mathis 2004); both these conditions are not true for G49.
Murray & Rahman (2010) identifies stellar wind bubbles within WMAP sources. For G49, the dynamical timescale estimated from the expansion of these bubbles is 2 Myr. We investigated using Starburst99 the evolution of a cluster and the change of with its age. Fig. 2 shows the result. The ratio decreases by a factor of 3.4 by 2.5 Myr and then increases due to the evolution of massive stars to Wolf-Rayet (WR) stars. The surface temperatures of WR stars are 50,000 K and hence they contribute significantly to He ionization. Note that by about 2.8 Myr or so the total Lyc flux due to the cluster drops down. As can be seen from Fig 2b, the reduction in at age 2 Myr is not sufficient to explain the observed upper limit of He line.
The observed limit to the He line can be used to obtain an upper limit on the ratio using the He ionization model of Mathis (1971). The upper limit thus obtained for is about 0.028, which is marked on Fig 2b. We modified Starburst99’s massive star atmospheric model emission routines to introduce an attenuation for photons with energy 24.6 eV. These photons need to be attenuated by at least a factor of 10 relative to the current model results if the ionizing sources are star clusters with age 2.8 Myr (see Fig. 2b).
Environments of stellar clusters and their evolution have been recently studied both theoretically (Pelupessy & Zwart 2011) and observationally (Churchwell et al 2006). These studies show that the cluster wind is a dominant factor affecting the environment at all stages of cluster evolution. These winds can produce dust bubbles. We follow the treatment of Mezger et al. (1974; see also Panagia & Smith 1978), developed for compact H ii regions, to investigate whether selective absorption of He-ionizing photons by dust can explain the non-detection of He RRL toward the DIR. The size of G49 is 70 pc, which along with electron density ( 5cm-3; Roshi & Anantharamaiah 2001) gives a dust optical depth at = 912 Å in the range 0.25 to 0.8 depending on the absorption cross section at this wavelength. The dust optical depth near 0.25 cannot significantly change in H ii regions (Sarazin 1977). Using the observed limit on , and the above estimated dust optical depth, we find that the ratio of the dust absorption cross sections for He- and H-ionizing photons is 6. This high cross section ratio is inconsistent with our current understanding of UV absorption properties of the dust (Draine 2003).
5 Summary
Radio recombination line observations of the luminous WMAP source G49 were made at 1.4 GHz with the GBT. Hydrogen and carbon lines were detected but no helium line was observed. The upper limit to the ratio of ionized helium to hydrogen obtained is 0.024. It has been suggested that the WMAP sources are ionized by star clusters which may not be associated with the radio H ii regions within these sources. Using Starburst99 we found that the mass of the cluster should be to satisfy the total ionization requirement of G49. The ratio obtained for such a cluster is , implying that the hydrogen and helium Strömgren spheres should overlap and hence the helium line should be detectable. The non-detection of helium line rules out the possibility that the DIR is an H ii region produced by such stellar clusters. We examined whether the DIR is ionized by ‘leaky’ H ii regions embedded in G49, as suggested by Lockman (1976) and Anantharamaiah (1986). Models of ‘leaky’ H ii regions show that the helium ionizing photons are significantly suppressed for photon leakage 15% and for ionizing source with effective temperature 45000 K; both these conditions are not met for G49. We determined that photons with energy 24.6 eV need to be attenuated by at least a factor of 10 compared to the current model results to be consistent with our observations. If selective absorption of He-ionizing photons by dust is causing this additional attenuation, then the ratio of dust absorption cross sections for He- and H-ionizing photons should be 6.
6 Acknowledgments
DAR thanks J. Lockman and R. Maddalena for helpful discussions during the planning stage of the GBT observations. DAR also thanks Ed Churchwell and Claus Leitherer for informative discussion during the interpretation of the results. The data were taken as part of a project for the Single dish school, held at NRAO, Green Bank during July 2011.
Facility: GBT
References
- (1) Altenhoff, W. J., et al., 1979, A&AS, 35, 23
- (2) Anantharamiah, K. R., 1986, JApA, 7, 131
- (3) Bell, M. B., et al., 2011, Ap&SS, 333, 377
- (4) Bennett, C. L., et al., 2003, ApJS, 148, 97
- (5) Churchwell, E., Mezger, P. G., Huchtmeier, W., 1974, A&A, 32, 283
- (6) Churchwell, E., et al., 2006, ApJ, 649, 759
- (7) Conti, P. S., Crowther, P. A., 2004, MNRAS, 355, 899
- (8) Davies, R. D., Matthews, H. E., Pedlar, A, 1972, Nature, 238, 101
- (9) Dowens, D., et al., 1980, A&AS, 40, 379
- (10) Draine, B. T., 2003, ARA&A, 41, 241
- (11) Gold, B., et al., 2009, ApJS, 180, 265
- (12) Gottesman, S. T., Gordon, M. A., 1970, ApJL, 162, 93
- (13) Haffner, L. M., et al., 2009, RvMP, 81, 969
- (14) Haslam, C. G. T., et al., 1982, A&AS, 47, 1
- (15) Heiles, C., 1994, ApJ, 436, 720
- (16) Heiles, C., et al., 1996, ApJ, 462, 326
- (17) Hoopes, C. G., Walterbos, R. A. M., 2003, ApJ, 586, 902
- (18) Hoyle, F., Ellis, G. R. A., 1963, AuJPh, 16, 1
- (19) Leitherer, C., et al., 1999, ApJS, 123, 3
- (20) Lichten, S. M., Rodriguez, L. F., Chaisson, E. J., 1979, ApJ, 229, 524
- (21) Lockman, F. J., 1976, ApJ, 209, 429
- (22) Mathis, J. S., 1971, ApJ, 167, 261
- (23) McGee, R. X., Newton, L. M., 1981, MNRAS, 196, 889
- (24) McKee, C. F., Williams, J. P., 1997, ApJ, 476, 144
- (25) Mehringer, D. M., 1994, ApJS, 91, 713
- (26) Mezger, P. G., Smith, L. F., Churchwell, E., 1974, A&A, 32, 269
- (27) Mezger, P. G., 1978, A&A, 70, 565
- (28) Muench, A. A., et al., 2002, ApJ, 573, 366
- (29) Murray, N., Rahman, M., 2010, ApJ, 709, 424
- (30) Panagia, N., Smith, L. F., 1978, A&A, 62, 277
- (31) Pelupessy, F. I., Zwart, S. P., 2011, astroph, 1111.0992
- (32) Petuchowski, S. J., Bennett, C. L., 1993, ApJ, 405, 591
- (33) Price, S. D., et al., 2001, AJ, 121, 2819
- (34) Rahman, M., Murray, N., 2010, ApJ, 719, 1104
- (35) Reynolds, R. J., Tufte, S. L., 1995, ApJL, 439, 17
- (36) Roshi, D. A., Anantharamaiah, K. R., 2000, ApJ, 535, 231
- (37) Roshi, D. A., Anantharamaiah, K. R., 2001, ApJ, 557, 226
- (38) Roshi, D. A., et al., 2005, ApJ, 625, 181
- (39) Russeil, D., 2003, A&A, 397, 133
- (40) Sarazin, C. L., 1977, ApJ, 211, 772
- (41) Scalo, J. M., 1986, Fundamentals of Cosmic Physics, 11, 1
- (42) Shaver, P. A, 1976, A&A, 49, 1
- (43) Thum, C., Mezger, P. G., Pankonin, V, 1980, A&A, 87, 269
- (44) Wood, K., Mathis, J. S., 2004, MNRAS, 353, 1126
- (45) Vázquez, G. A., Leitherer, C., 2005, ApJ, 621, 695
 |
 |
| Transition | (K) | (km s-1) | (km s-1) |
|---|---|---|---|
| H1 | 0.0324(0.0003) | 60.46(0.15) | 28.95(0.35) |
| He | (0.00078)2 | ||
| C1 | 0.0048(0.0009) | 69.83(0.37) | 3.87(0.91) |
| C1 | 0.0050(0.0012) | 64.35(0.27) | 2.18(0.64) |
| X1,3 | 0.0081(0.0016) | 48.21(0.12) | 1.26(0.29) |