Galactic Sources Science With Agile: The Case Of The Carina Region
Abstract
During its first 2 years of operation, the gamma-ray AGILE satellite accumulated an extensive dataset for the Galactic plane. The data have been monitored for transient sources and several gamma-ray sources were detected. Their variability and possible association were studied. In this talk we will focus on the results of extensive observations of the Carina Region during the time period 2007 July - 2009 January, for a total livetime of 130 days. The region is extremely complex, hosting massive star formation, with the remarkable colliding wind binary Eta Carinae, massive star clusters and HII regions (e.g. NGC 3324, RCW49, Westerlund II) and a giant molecular cloud extending over 150 pc (between l=284.7 and l=289). The Carina Nebula itself is the largest and IR highest surface brightness nebula of the Southern emisphere. We monitored several gamma ray sources in the Carina Region. In particular we detect a gamma ray source (1AGL J1043-5931) consistent with the position of Eta Carinae and report a remarkable 2-days gamma-ray flaring episode from this source on 2008 Oct 11-13. If 1AGL J1043-5931 is associated with the Eta Car system, our data provides the long sought first detection above 100 MeV of a colliding wind binary.
keywords:
gamma rays: observations , individual stars (Eta Carinae) , stars: winds, outflows , X-rays: bynaries1 Introduction
AGILE (Astro-rivelatore Gamma a Immagini LEggero) is a high-energy astrophysics mission supported by the Italian Space Agency (ASI) with scientific and programmatic participation by INAF, INFN and several Italian universities [20]. It was successfully launched by the Indian Sriharikota base on April 23, 2007 and began observations in July 2009 with a fixed pointing observing mode of typical duration of about 3 weeks. The satellite is equipped with two co-aligned detectors, covering the energy ranges 30 MeV -50 GeV (Gamma Ray Imaging Detector, GRID [1, 18]) and 18 - 60 KeV (Super-AGILE [9]). Both instruments are characterized by a large Field of View FoV (2.5 sr and 1sr for the gamma-ray and Hard X-ray bands, respectively), optimal angular resolution and good sensitivity [20].
During its 2 years of operation AGILE gathered an extensive dataset for the Gamma Ray sky, with particular focus to Galactic plane regions (e.g. Carina, Cygnus, Crux). Among the different science topics explored by the AGILE Galactic Working Group (Diffuse gamma-ray emission, pulsars, SNRs and origin of cosmic rays, massive sources, microquasars, compact objects, the Galactic Centre), a great attention was devoted to studies of variable Galactic sources. Crucial points for these analyses are the modelling of the diffuse emission and the accuracy in source positioning: the extensive dataset that has been gathered shows a good agreement between model and observations out of the Galactic Centre for the diffuse emission and a positioning accuracy of 5.5 arcmin for source counts of 100-1000.
In this talk we will focus on our gamma-ray monitoring of the Carina Region, which is extremely interesting for studies of variable Galactic sources since it hosts massive star forming regions, star clusters, young hot stars and a wealth of spectacular nebular structures. An extremely peculiar system in the region and one of the most interesting objects of our Galaxy is the Carinae binary
[5, 6], where the primary star is a massive ( solar masses) luminous blue variable (LBV) star orbiting in a very eccentric binary () with a companion star believed to be an O star of solar masses. The system has been monitored in the radio, mm, IR, optical and X-ray bands for at least three cycles and the measured orbital period is 5.53 years (2023 days) [5], with last periastron occurred on the 11th of january 2009. Both stars emit dense and high-velocity gaseous winds, and the binary system is ideal to study the interaction of colliding winds and to test theories of particle acceleration and radiation under extreme conditions. The mass outflow rates and wind speeds of the two stars inferred from the wealth of all available data are [15]. The system is known for its variability and occasional erratic eruptions detected in the IR and optical bands, as well as for its distinct asymmetric pattern of optical line and X-ray emission during its orbital period [3].
2 Recent and historical X-ray monitoring
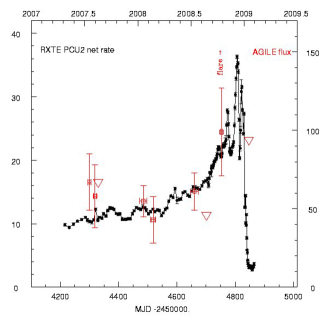
Car has been repeatedly observed in the energy ranges 1-10 keV and 20-100 keV by different observatories. Fig 1 shows the RXTE (PCU2 net rate) lightcurve (dotted points) in the energy band 2-15 keV during the period 2007 February - 2009 January the data are simultaneous to our gamma-ray observations (see sec 3.). The typical and relatively abrupt decrease of the X-ray emission near periastron is clearly visible. Unfortunately the Super-AGILE hard X-ray imager did not detect a source coincident with 1AGL J1043-5931 for both short and long integrations during our pointing program. Depending on the source position in the FOV, the typical 3-sigma Super-AGILE upper limit is 10-20 mCrab.
The Car source was detected with high significance by BSAX-PDS and INTEGRAL-ISGRI far from periastron. INTEGRAL is capable of resolving field sources with a few arcminute resolution in the hard X-ray range. Although INTEGRAL observed the system at different phase periods (0.99-0.01, 0.16–0.19, 0.35-0.37), Car was detected only during the phase interval 0.16–0.19 with an average 22-100 keV X-ray flux of [11].
Car is certainly the only source showing a non-thermal X-ray spectrum within a region of 1 degree diameter (the anomalous X-ray pulsar AXP 1E 1048.1-5937 is about 0.6 degrees away). Whereas the 1-10 keV spectrum is dominated by a quasi-thermal and variable component [3, 4, 21], the hard X-ray observations show non-thermal emission that appears to vary along the orbit [22, 11].
3 AGILE Gamma ray observations
The Carina region has been observed at gamma-ray energies above a few MeV by the OSSE, COMPTEL and EGRET instruments on board of the Compton Gamma-Ray Observatory (CGRO). An EGRET gamma-ray source (3EG J1048-5840) is catalogued at about 1 degree distance from Car . However, no gamma-ray emission above 100 MeV has been reported by CGRO from Car .
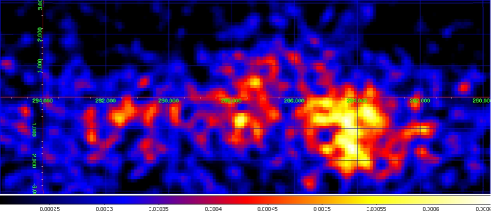
The gamma-ray astrophysics mission AGILE [20] observed several times the Carina region in the Galactic plane during its early operational phases and Cycle-1 observations (see Table 1). Fig 2 shows the AGILE gamma-ray intensity map integrated over all available data. Here we report the main results of the gamma-ray observations of the Car region carried out by the AGILE satellite during the period 2007 July - 2009 January, simultaneously in the energy bands 30 MeV - 30 GeV and 18-60 keV. A high-confidence gamma-ray source (1AGL J1043-5931) was detected positionally consistent with Car by integrating all data, as well as by considering specific observation periods.
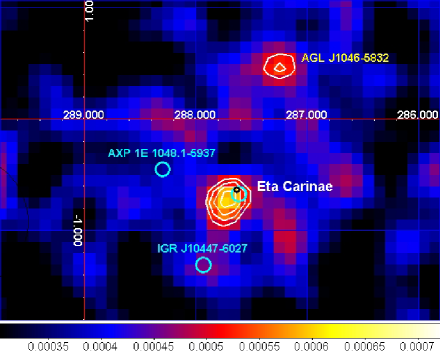
Fig. 3 shows a zoomed view of the integrated sky map of the
Car region given in Fig 2. A gamma-ray source is
detected with high confidence
(7.8 ) at the position
and the
average gamma-ray flux above 100 MeV and integrated over the whole
period 2007 July - 2008 October is . We call this
source111 The same source is also listed in the Fermi
Bright Source Catalogues as 0FGL J1045.6-5937 (Abdo et al.
2009). 1AGL J1043-5931 following the source designation of the first AGILE
catalog of high-confidence gamma-ray sources [16].
Fluxes were measured including in all our multisource analysis the nearby
gamma-ray source222 This source, which
did not reach the stringent significance threshold of the
First AGILE Catalog [pittori], is included in the
Fermi Bright Source List as 0FGL J1047.6-5834 and is identified
with PSR J1048-5832 (Abdo et al. 2009). AGL J1046-5832 that the AGILE-GRID detects
with an average and
constant gamma-ray flux above 100 MeV of
.
Car is well within the 95% confidence radius gamma-ray error
box of 1AGL J1043-5931; while the other nearby hard X-ray sources in the field
(the anomalous X-ray pulsar AXP 1E 1048.1-5937, and
IGR J10447-6027) are excluded.
| MJD | Car | Counts | Average flux | |
| phase (a) | (b) | (c) | ||
| 54294.5-54305.5 | 0.732 | 4.1 | 105 29 | 67 18 |
| 54314.5-54324.5 | 0.741 | 3.3 | 80 27 | 58 20 |
| 54325.5-54334.5 | 0..747 | 1.1 | 73 | |
| 54473.5-54497.5 | 0.824 | 4.1 | 166 45 | 55 14 |
| 54510.5-54526.5 | 0.840 | 3.1 | 96 33 | 43 15 |
| 54647.5-54672.5 | 0.910 | 5.6 | 214 42 | 61 12 |
| 54693.5-54709.5 | 0.930 | 1.3 | 105 | |
| 54749.5-54756.5 | 0.956 | 4.0 | 80 23 | 99 28 (d) |
| 54843.5-54850.5 | 0.002 | 2.2 |
(a) Average orbital phase of Car calculated at the center of
the time interval.
(b) Square root of the the Maximum Likelihood
Test Statistic (TS) representing the statistical significance of
the detection.
(c) Gamma-ray flux of 1AGL J1043-5931 above 100 MeV in units of
s-1 obtained by taking into
account the nearby source AGL J1046-5832 in the multisource
likelihood analysis.
We also indicate 2-sigma upper limits in the same units.
(d) During this period the source reached the
gamma-ray flux above 100 MeV of .
We analyzed each single pointing and produced a light curve which we overplotted (square points and triangles) to the simultanoues RXTE data shown in Fig 1.
We searched for short timescale variability of the gamma-ray and hard X-ray flux from 1AGL J1043-5931 throughout the whole AGILE observing periods of the Carina region. A 2-day gamma-ray flare from the direction of Car was detected during the observation of 2008 October 10-17. The emission reached its peak gamma-ray emission during the period 2008 Oct. 11 (02:57 UT) - 2008 Oct. 13 (04:16 UT). Our analysis gives a 5.2 sigma detection of a source at the position fully consistent with the 1AGL J1043-5931 position but with a gamma-ray flux above 100 MeV of . Fig. 4 shows the time sequence of 2-day integration gamma-ray maps of the region during the period 2008 10-17 October.
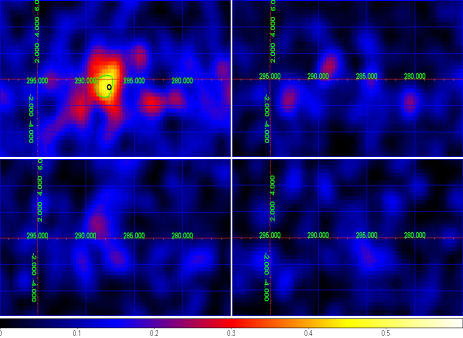
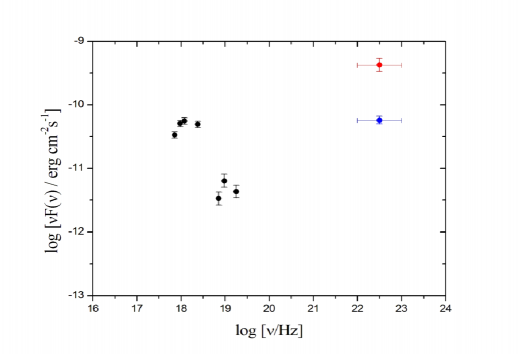
Fig. 5 shows two representative different broad-band spectral states of 1AGL J1043-5931 obtained during the period 2007 July – 2008 October together with the historical X-ray and hard X-ray data reported from Car. We plot 2 points for the AGILE data: the lower data point is the average spectrum obtained by integrating all data outside periastron, and the upper data point is the flux corresponding to the flaring state of 2008 October 11-13. We also report in the same plot the (non simultaneous) BSAX-MECS and the INTEGRAL-ISGRI spectral states of Car reported in the literature [22, 11]. It is interesting to note that if 1AGL J1043-5931 is associated with Car , the average AGILE spectrum together with the INTEGRAL historical spectrum is in qualitative agreement with expectations based on inverse Compton and/or pion decay models of gamma-ray emission from colliding wind binaries [19]. For the 2008 11-13 October flaring episode, the Super-AGILE 18-60 keV upper limit is 70 mCrab in the energy band 18-60 keV. Obtaining simultaneous hard X-ray and gamma-ray data during the flaring state of 1AGL J1043-5931 is crucial to study the broad-band variability of the source. However, due to unfavorable source positioning of 1AGL J1043-5931 in the Super-A field of view in mid-October, 2008, the hard X-ray upper limit is not very constraining.
AGILE pointed at the Carina Region during the period 2009 12-19 January as a special repointing to cover the Car periastron passage (calculated to be occurring on 2009 January 11). We can currently provide a 2-sigma upper limit to the emission above 100 MeV of . and we cannot exclude, at this stage, the existence of a weak gamma-ray source consistent with 1AGL J1043-5931.
A more detailed analysis of the AGILE and multifrequency data during the Car periastron passage will be discussed elsewhere.
4 Discussion
Car is located in the Carina nebula that extends for several degrees in a Galactic region characterized by dense molecular clouds, young stars and star formation sites. However, within the 1AGL J1043-5931 error box Car itself is by far the strongest and hardest source in the 2-10 keV and 22-100 keV ranges. Another source inside the AGILE error box and 7 arcmin away from Car is the X–ray binary HD 93162/WR 25 (WN6+O4, with an orbital period of 208 days, [10]. This system is known to be a colliding wind system. [17] found significant variability, possibly periodic, of its X–ray flux. However, WR 25 was not detected in the hard X-ray range by INTEGRAL during any of its observations. Furthermore, no other prominent hard X-ray source is known in the 1AGL J1043-5931 error box except for Car itself. The two nearby hard X-ray sources detected by INTEGRAL [11] are outside the 95% confidence level error box of AGILE. Multiple gamma-ray sources within the 1AGL J1043-5931 error box cannot be excluded but are unlikely.
Based on the accumulated multifrequency evidence and the nature of the source, we consider the association of 1AGL J1043-5931 and Car as very likely. We briefly elaborate below on the theoretical implications of our results assuming that 1AGL J1043-5931 is indeed the gamma-ray counterpart of Car.
Colliding wind binaries (CWBs) are ideal systems to test theories of hydrodynamical shocks and particle acceleration under extreme radiative conditions provided by the proximity of the two stars. In particular, supersonic winds can form efficient shocks where electrons and protons can be accelerated through first-order Fermi [8] or other acceleration mechanisms. Inverse Compton (IC) scattering of shock-accelerated particles in the presence of the very intense IR-optical-UV background of the nearby very bright stars provides a crucial ingredient in CWBs. In addition to synchrotron and Bremsstrahlung electron emissions, the IC emission can dominate the high energy spectrum at energies larger than several tens of keV up to MeV-GeV energies. Furthermore, if protons are efficiently accelerated, they can interact with the dense stellar outflows and produce gamma-rays by pion production and neutral pion decay (e.g., [8], [2] [19]). All these ingredients are important for the Car system and detailed hydrodynamical modelling of the mass outflow have been developed [13] [14] [12]. A comprehensive and detailed theoretical analysis of our data is beyond the scope of this paper. We outline here a few important points.
If 1AGL J1043-5931 is the Car gamma-ray counterpart, our data show the first remarkable detection of a colliding wind system at hundreds of MeV energies, confirming the efficient particle acceleration and the highly non-thermal nature of the strong shock in a CWB. The average gamma-ray flux of 1AGL J1043-5931 translates into gamma-ray luminosity of for an Car distance of 2.3 kpc, corresponding to a fraction of a percent of the total wind kinetic power. The 2008 Oct. 11-13 flare episode has a luminosity of . The average broad-band gamma-ray spectrum determined by AGILE is in qualitative agreement with expectations of CWB spectra as calculated for dominant IC and neutral pion decay processes [2],[19].
While the gamma-ray flux of 1AGL J1043-5931 is roughly constant during the time span covered by our observations, a significant variability was detected on a few day time-scale in October 2008. This episode indicates that the gamma-ray emission can be associated with intermittent strong shock acceleration episodes and/or magnetic field enhancements to be expected for a very variable and inhomogeneous mass outflow from the stars of the Car system. In particular, we note that the strong gamma-ray flaring episode occurred a few months before periastron, when the efficiency of transforming a mass outflow enhancement into particle acceleration is expected to increase because of the closeness of the two stars. Car provides then some crucial ingredients regarding the formation of high-energy emission in CWBs: (1) strong variability of the mass outflows; (2) a high-speed wind from the less massive companion; (3) a radiative environment with a specific bath of soft photons from both stars (IR, optical and UV fluxes) that can illuminate the shock region and provide a time variable environment for enhanced IC emission in the 100 MeV range and beyond. The theoretical implications are far reaching. The Car system would provide the first CWB to test the particle acceleration models for non-relativistic mass outflows under a specific set of physical conditions. It is very important to assess the efficiency of the particle acceleration process in such a radiative environment. A gamma-ray flaring episode lasting days implies a fast acceleration timescale and subsequent radiation and decay of the strong shock properties leading to the efficient emission. If the gamma-ray emission is associated with Car our observations provide important data to test shock acceleration models. Future gamma-ray observations and analysis will further contribute to enlighten the emission mechanism and the ultimate origin of 1AGL J1043-5931.
References
- [1] Barbiellini G., et al.,2002, NIM A, 490, 14
- [2] Benaglia, P. & Romero, G.E., 2003, A&A, 399, 1121
- [3] Corcoran, M.F., et al.,2001, ApJ, 547, 1034
- [4] Corcoran, M.F., et al.,2005, AJ, 129, 2018
- [5] Damineli, A., et al.,2008a, MNRAS, 384, 1649
- [6] Damineli, A., et al.,2008b, MNRAS, 386, 2330
- [7] Davidson, K. & Humphrey, R.M., 1997, ARA&A, 53, 1
- [8] Eichler, D., & Usov, V., 1993, ApJ, 402, 271
- [9] Feroci M., et al., 2007, NIM A, 581, 728
- [10] Gamen, R., Gosset, E., Morrell, N., et al. 2006, A&A, 460, 777
- [11] Leyder, J.-C., Walter, R., and Rauw, G., 2008, A%A, 477, L29
- [12] Okazaki, A.T., et al., 2008, MNRAS, 388, L39
- [13] Parkin, E.R., & Pittard, J.M., 2008, MNRAS, 388, 1047
- [14] Parkin, E.R., et al., 2009, arXiv:0901.0862v1
- [15] Pittard, J.M., et al., 2005,http://www.aoc.nrao.edu/events/xraydio
- [16] Pittori, C., e al., 2009, submitted to A&A, http://agile.asdc.asi.it
- [17] Pollock, A. M., & Corcoran, M. F., 2006, A&A, 445, 1093
- [18] Prest M., et al., 2003, NIM A, 501, 280
- [19] Reimer, A., Pohl, M., and Reimer, O., 2006, ApJ, 644, 1118
- [20] Tavani M., et al, 2009, A&A in press, arXiv:0807.4254
- [21] Viotti, R.F., et al.,2002, A&A, 385, 874
- [22] Viotti, R.F., et al., 2004, A&A, 420, 527