Optical Integral Field Spectroscopy of NGC 5850
Abstract
Here we present the preliminary results of the analysis of VIMOS observations of the central 4.5 kpc of the double-barred galaxy NGC 5850. We use optical diagnostic diagrams to study the main ionization mechanism across the field of view confirming the LINER nature in the continuum peak location. Also a star-forming (SF) region is found close to it (), a second SF region is located east of the center (). Further the data reveals complex nuclear gas kinematics which is likely to be dominated by the secondary bar.
1 Introduction
Scaling relations, like the one between the mass of the central black hole and the stellar velocity dispersion of the bulge, suggest the co-evolution of the central engine and its host; or at least some form of feedback between them.
NGC 5850 is a prototype double-barred early-type spiral SB(r) b galaxy. It is located at a distance of Mpc Wozniak95 and hosts a polar gaseous disk doublebarred_structure_moiseev . Its two spiral arms form ring-like structure, almost resembling the morphology of the center, where the inner bar is surrounded by a (pseudo-) ring. The north-western spiral arm is distorted probably due to a recent ( Myr) high velocity encounter with NGC 5846 Higdon_encounter , which is to the north-west of NGC 5850. The low X-ray luminosity 5850_Lx suggests NGC 5850 to be in a state of low activity. The high luminosity of [NII] lines at the center classifies it as a Low Ionisation Nuclear Emission Region (LINER) Heckman_Liner ; Liner_reference . Proposed by Shlosman_bar_in_bar and simulated by Friedli_bar_in_bar , nested bars can be a mechanism to fuel AGN. Its morphology and proximity make NGC 5850 an ideal object to study fuelling and feedback processes. Integral Field Spectroscopy (IFS) in the visible wavelength regime allows us to study in detail the excitation mechanisms of the gas and investigate gas kinematics.
2 Observations and Data Reduction
The observations were performed with the integral field spectrometer VIMOS on the Very Large Telescope (VLT) of the European Southern Observatory (ESO) and cover the wavelength range from Å with blue and red gratings at high spectral and spatial resolution (, , , ). The source was observed in four nights in 2009, two images per night and per grating. The images were reduced with the VIMOS pipeline provided by ESO. We additionally applied a fringing correction. The resulting cubes were corrected for pixel-to-pixel variation and subsequently averaged for each grating separately. Flux calibrations were done by the VIMOS pipeline, but due to a number of bad pixels in the image of the standard star, the values are not reliable yet. However, the absolute flux calibration is not relevant for the preliminary results presented here, but will be improved for future analysis purposes. A sky correction was not performed, because no sky emission line lies close to those of the galaxy and the sky continuum contribution is neglible.
After correcting for intergalactic extinction we shifted the spectra to the rest frame. The stellar continuum was subtracted by application of the STARLIGHT program by starlight combined with the theoretical models by Bruzual and Charlot BC03 . The emission lines were fitted in IDL with simple Gaussians using the MPFITPEAK and MPFITEXP routines. The H and the [NII] lines were fitted together, though they are not blended, as well as the [SII], lines. The latter were tied to each other by the constant wavelength difference between their peak values.
3 Preliminary Results
3.1 Emission Maps and Diagnostics
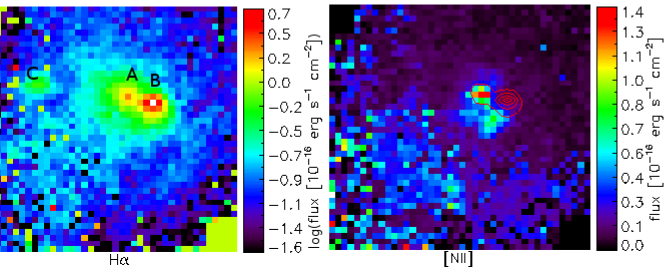
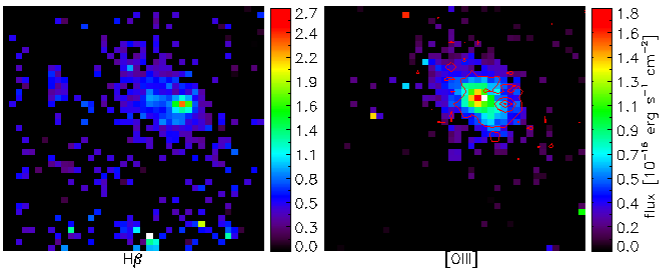
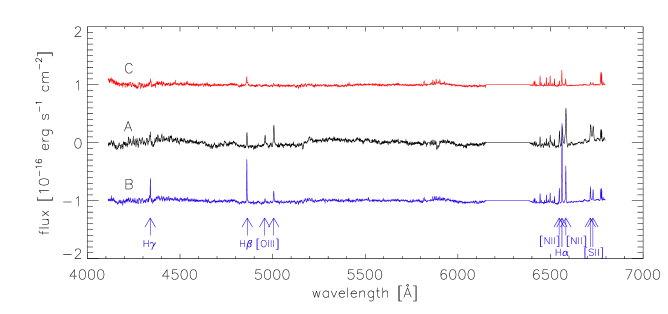
The H emission line map in the left panel of Fig. 1 shows three peaks, one located on the continuum peak (A), a second one (B) west of the center and a third one east at (C) projected distance to the core (A). The comparison of the map with the one for [NII] line emission in the right panel of Fig. 1 implies, that location B and C are clearly distinctive in their ionisation mechanisms from the core, showing only little [NII] emission compared to the Balmer emission. This is also supported by the emission maps of H and [OIII] (left and right panel of Fig. 2, respectively), where H is strong in region B, weak in the core region A and even weaker in region C. Unfortunately for region C no [OIII] fluxes could be obtained, because of low S/N. However, considering the distance of region C to the center, it is likely to be a star-forming region. Also to mention is the fact, that the [NII] emission does not appear to be confined to the core region but it extends to the south-west. In Fig. 3 the stacked spectrum (consisting of 3 by 3 pixels) of each region marked in Fig. 1 is shown.
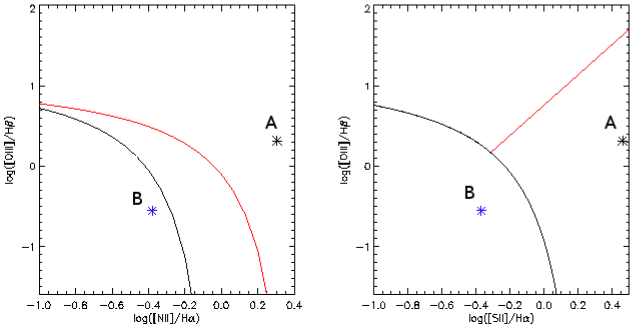
In agreement with Liner_reference , the diagnostic diagram in Fig. 4 reveals the brightest pixel of the core (A) to be a LINER. The brightest pixel in region B is classified as an HII region. Region C cannot be classified by the means of the diagnostic diagram, because its [OIII] emission line could not be securely detected.
3.2 Kinematics
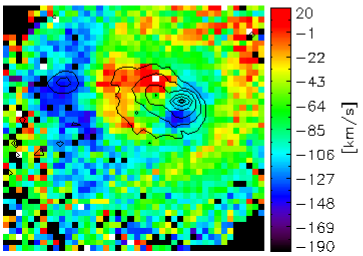
The H line of sight velocity map (Fig. 5) shows a peculiar structure, resembling the typical ’Yin-Yang’ pattern and is possibly dominated by the nuclear bar. The gas kinematics is completely different from the rotational stellar velocity field published by sigma_hollows_lorenzo . The overplotted H emission contours show the HII region (B) either being located in an area of close to zero velocity or the region’s intrinsic velocity being lower than that of the surrounding gas. The core (A) is also in an area of relative rest, as expected, but it is also found close to a region of high redshifted velocities to the north and east. The star-forming region in the east (C) is associated with high blueshifted velocities. Though very noisy, the eastern edge of the field of view suggests the detection of the galaxy’s inner ring.
4 Conclusion and Outlook
Our observations confirm the low activity of NGC 5850 and the emission line ratios put it in the LINER area of the diagnostic diagram. The maps also show two star forming regions (denoted as B and C) at and projected distance to the core (A). The HII-region (B) close to the core is an interesting object, in particular, regarding fuelling scenarios of the central engine and its feedback into the host galaxy. The complex gas kinematics introduced by the inner bar is likely to provide further insight into fuelling scenarios for NGC5850.
However, the question whether the core of a LINER is a downscaled AGN has not been answered, yet. The extended [NII] emission around the core suggests that the LINER emission might not only be caused by the unresolved central engine. Alternatively, the LINER emission could be caused by shock ionisation. Nevertheless, central point sources are capable of creating extended line emission Julia_EELR ; Yan_nature_of_LINERS , thus the presence of an AGN cannot be ruled out.
Part of this work was supported by the German Deutsche Forschungsgemeinschaft, DFG, via grant SFB 956 project A2 and fruitful discussions with members of the European Union funded COST Action MP0905: Black Holes in a violent Universe and PECS project No. 98040. M. B., J. S., J. Z. and S. F. gladly acknowledge the financial support by Group of Eight Australia-Germany Joint Research Co-operation Scheme via project-ID 50753527. M. V.-S. is member of the International Max Planck Research School (IMPRS) for Astronomy and Astrophysics at the MPIfR and the Universities of Bonn and Cologne.
References
- [1] Wozniak H, Friedli D, Martinet L, Martin P and Bratschi P 1995 Astron. And Astroph. 111 115
- [2] Moiseev A V, Valdés J R and Chavushyan V H 2004 Astron. And Astroph. 421 433–453 (Preprint arXiv:astro-ph/0311271)
- [3] Higdon J L, Buta R J and Purcell G B 1998 Astron. J. 115 80
- [4] Fabbiano G, Kim D W and Trinchieri G 1992 Astroph. J. Supplem. Series 80 531–644
- [5] Heckman T M 1980 Astron. And Astroph. 87 152–164
- [6] Keel W C 1983 Astroph. J. Supplem. Series 52 229–239
- [7] Shlosman I, Frank J and Begelman M C 1989 Nature 338 45–47
- [8] Friedli D and Martinet L 1993 Astron. And Astroph. 277 27
- [9] Cid Fernandes R, Mateus A, Sodré L, Stasińska G and Gomes J M 2005 Monthly Notes of the Royal Astron. Soc. 358 363–378 (Preprint arXiv:astro-ph/0412481)
- [10] Bruzual G and Charlot S 2003 Monthly Notes of the Royal Astron. Soc. 344 1000–1028 (Preprint arXiv:astro-ph/0309134)
- [11] Kewley L J, Dopita M A, Sutherland R S, Heisler C A and Trevena J 2001 Astroph. J. 556 121–140 (Preprint arXiv:astro-ph/0106324)
- [12] Kauffmann G, Heckman T M, Tremonti C, Brinchmann J, Charlot S, White S D M, Ridgway S E, Brinkmann J, Fukugita M, Hall P B, Ivezić Ž, Richards G T and Schneider D P 2003 Monthly Notes of the Royal Astron. Soc. 346 1055–1077 (Preprint arXiv:astro-ph/0304239)
- [13] Kewley L J, Groves B, Kauffmann G and Heckman T 2006 Monthly Notes of the Royal Astron. Soc. 372 961–976 (Preprint arXiv:astro-ph/0605681)
- [14] de Lorenzo-Cáceres A, Falcón-Barroso J, Vazdekis A and Martínez-Valpuesta I 2008 Astroph. J. 684 L83–L86 (Preprint 0808.0517)
- [15] Scharwächter J, Dopita M A, Zuther J, Fischer S, Komossa S and Eckart A 2011 Astroph. J. 142 43 (Preprint 1106.0300)
- [16] Yan R and Blanton M R 2011 ArXiv e-prints (Preprint 1109.1280)