danila@astro.ioffe.ru 22institutetext: St. Petersburg State Polytechnical Univ., Politekhnicheskaya 29, St. Petersburg, 195251, Russia
aida.taylor@gmail.com, dimazyuz@mail.ru 33institutetext: Department of Astronomy, Universidad de Concepcion, Casilla 160-C, Concepcion, Chile
rmennick@astro-udec.cl 44institutetext: Department of Astronomy & Astrophysics, Pennsylvania State University, PA 16802, USA
pavlov@astro.psu.edu 55institutetext: Observatorio Astronómico Nacional SPM, Instituto de Astronomía, Universidad Nacional Autónomia de Mexico, Ensenada, BC, Mexico
zhar@astrosen.unam.mx
Possible optical counterpart of PSR J13576429 ††thanks: Based on observations made with ESO telescope at the Paranal Observatory under Programme 083.D-0449A and with archival ESO VLT data, obtained from the ESO/ST-ECF Science Archive Facility.
Abstract
Context. PSR J13576429 is a Vela-like radio pulsar that has been recently detected in X-rays and -rays. It powers a compact tail-like X-ray pulsar wind nebula and X-ray-radio plerion associated with an extended TeV source HESS J1356645.
Aims. We present our deep optical observations with the Very Large Telescope to search for an optical counterpart of the pulsar and its nebula.
Methods. The observations were carried out using a direct imaging mode in the , , and bands. We also analysed archival X-ray data obtained with Chandra and XMM-Newton.
Results. In all three optical bands, we detect a point-like source with = 27.3 0.3, = 25.52 0.07, and = 24.13 0.05, whose position is within the 1 error circle of the X-ray position of the pulsar, and whose colours are distinct from those of ordinary stars. We consider it as a candidate optical counterpart of the pulsar. If it is indeed the counterpart, its 5 offset from the radio pulsar position, measured about 9 yr earlier, implies that the transverse velocity of the pulsar is in the range of 1600–2000 km s-1 at the distance of 2–2.5 kpc, making it the fastest moving pulsar known. The direction of the estimated proper motion coincides with the extension of the pulsar’s X-ray tail, suggesting that this is a jet. The tentative optical luminosity and efficiency of the pulsar are similar to those of the Vela pulsar, which also supports the optical identification. However, the candidate undergoes an unusually steep dereddened flux increase towards the infrared with a spectral index 5, that is not typical of optical pulsars. It implies a strong double-knee spectral break in the pulsar emission between the optical and X-rays. The reasons for the spectral steepness are unclear. It may be caused by a nebula knot projected onto the jet and strongly overlapping with the pulsar, as observed for the Crab, where the knot has a significantly steeper spectrum than the pulsar. We find no other signs of the pulsar nebula in the optical. Alternatively, the detected source may be a faint AGN, that has not yet been seen at other wavelengths.
Conclusions. The position and peculiar colours of the detected source suggest that it is an optical counterpart of the pulsar. Further high spatial-resolution infrared observations can help to verify its real nature.
Key Words.:
pulsars: general – SNRs, pulsars, pulsar wind nebulae, individual: PSR J13576429 – stars: neutron1 Introduction
PSR J13576429 is a young (characteristic age = 7.3 kyr) and energetic (spin-down luminosity = 3.1 1036 ergs s-1) 166 ms radio pulsar that was discovered in the Parkes multi-beam survey of the Galactic plane (Camilo et al. 2004). At a distance of 2.4 kpc estimated from its dispersion measure (DM), it is one of the nearest young pulsars known. This proximity has motivated further observations of the pulsar field in different spectral domains.
The first X-ray observations with Chandra (Zavlin 2007) and XMM-Newton (Esposito et al. 2007) have revealed an X-ray counterpart of the pulsar and a faint tail-like signature of the pulsar wind nebula (PWN) extended by a few arcseconds northeast of the pulsar. Deeper X-ray observations (Chang et al. 2012, Lemoine-Goumard et al. 2011) have firmly established X-ray pulsations with the pulsar period and found the tail-like structure to be extended out to several tens arcseconds from the pulsar. In addition, a fainter extended X-ray emission was detected on a few tens of arcminutes scale (Chang et al. 2012, Abramowski et al. 2011), showing a plerion-like structure, which is typical of many young pulsars. Finally, periodic pulsations of PSR J13576429 were discovered in the GeV range with Fermi (Lemoine-Goumard et al. 2011), and an extended source, HESS J1356$-$645, associated with the pulsar has been found in the TeV range with H.E.S.S. (Abramowski et al. 2011). The HESS source positionally coincides with the X-ray plerion, whose radio counterpart has also been found in archival data. The association with a supernova remnant (SNR) candidate, catalogued as G309.8$-$2.6, is debated. The age and observational properties of the J13576429 pulsar/PWN system appear to be similar to the Vela pulsar system, which is about ten times closer to us and much more comprehensively studied in various spectral domains. Further studies of the J13576429 system are important to improve our understanding the physics of young pulsars and their PWNe.
In contrast to Vela, the J13576429 field has not been studied in the optical. To search for an optical counterpart of the J13576429 pulsar/PWN system, we carried out the first deep observations of its field with the ESO Very Large Telescope (VLT) in bands. Using some of our data available from the VLT archive, Mignani et al. (2011) reported their failure to detect a counterpart in these observations. Analysing our complete data set, we find that this was a hasty conclusion. We firmly detected a point-like source, whose position is within the 1 error circle of the X-ray position of the pulsar. Its colours are distinct from those of field stars. We compare the optical data with the X-ray data retrieved from the Chandra and XMM-Newton archives111Chandra: ACIS-I, Obs 10880, 60 ks exposure, PI G. Pavlov; HRC-S, OBs 6656 and 7219, exposures 17 and 16 ks, PI M. Mendez. XMM: EPIC-MOS and PN, Obs 0603280101, exposure 78 ks and 55 ks, PI G. Pavlov. The observations and data reduction are described in Sect. 2, our results are presented in Sect. 3, and discussed in Sect. 4.
| Date | Band | Exposure | Mean | Seeing |
|---|---|---|---|---|
| airmass | range | |||
| [s] | [arcsec] | |||
| 2009-04-04 | 5795 | 1.35 | 0.5–0.7 | |
| 5795 | 1.43 | 0.5–0.6 | ||
| 2009-04-22 | 58920 | 1.35 | 0.5–0.8 | |
| 2009-04-24 | 58910 | 1.35 | 0.5–0.7 | |
| 2009-04-25 | 19939 | 1.32 | 0.4–0.6 |
2 Observations and data reduction
2.1 Observations
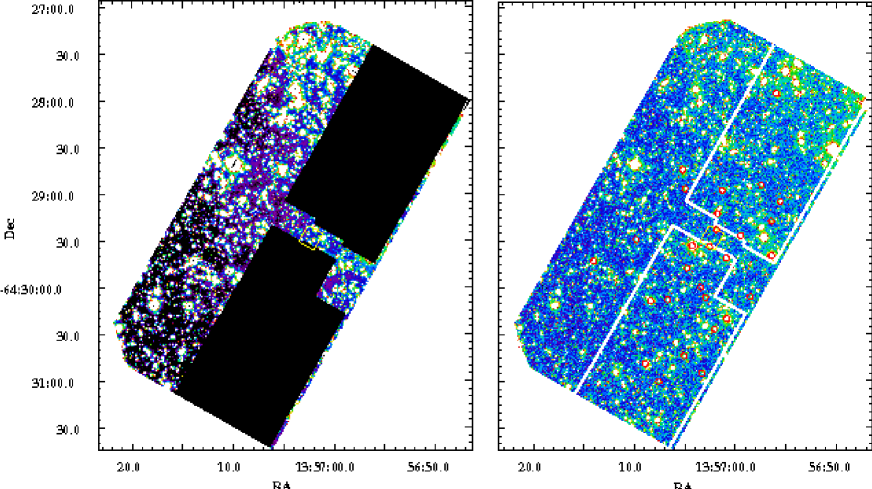
The images of the pulsar field were obtained in the , , and bands with the FOcal Reducer and low dispersion Spectrograph (FORS2222For the instrument details see http://www.eso.org/instruments/fors/ ) at the VLT/UT1 (ANTU) unit during several service mode runs in April 2009. A high resolution mode was used with an image scale of 0126/ and a field of view (FOV) of 4242. Since PSR J13576429 is located near the Galactic plane ( = 30992, = 251), which is densely packed with stars, we used the FORS2 MOS occulting-bar set-up for our observations. This allowed us to minimise contamination across the pulsar region by both the illumination and saturation spikes of bright field stars surrounding the pulsar (see Fig. 1). Sets of three-to-ten minute non-dithered exposures were obtained in each of the bands. The observing conditions were rather stable and photometric, with seeing values varying from 04 to 08. The Log of the observations is given in Table 1. One short, ten-second exposure was additionally taken in each of the bands without occulting bars (Fig. 1, right panel). This was done to perform accurate astrometric referencing: the exposure shortness minimises the saturation of most astrometric standards in the image and allows us to define their image positions with higher accuracy.
We note that only 8 of 39 available individual exposures of the best quality -band data were used by Mignani et al. (2011). This decreases the detection limit by at least a factor of two, which is crucial when searching for a faint pulsar counterpart, and likely to be the main reason why they missed the counterpart candidate clearly detected in the complete data set.
Standard data reduction, including bias subtraction, flat-fielding, and cosmic-ray removal was performed using the IRAF and MIDAS tools. Preliminary data inspection showed systematic frame shifts by a significant fraction of the pixel (of up to 0.1–0.2 pixels) between the first and consecutive non-dithered exposures in each of the observing blocks typically consisting of 5–13 individual exposures. To correct for these systematic shifts, we aligned all individual frames in each of the bands, using a set of unsaturated stars, to a ”best” quality frame for a given band obtained in the highest quality seeing conditions. The alignment accuracy was 0.01 of a pixel. In addition, we excluded four of the ”worst” exposures in the band with seeing 07, and two exposures in with seeing 06. The resulting full width at half maximum (FWHM) of a point source on the combined , , and images was 059, 052, and 044, respectively, which is about 10%–20% better than for a simple combining of initial frames without alignments. The respective integration times are 12339.5 s, 7629.7 s, and 7799.7 s, with mean airmasses of 1.347, 1.372, and 1.320. The pulsar was exposed on chip 1 of the FORS2 CCD mosaic consisting of two chips. An example of the combined -band image for this chip is presented in the left panel of Fig. 1. Chip 2 was operated without occulting bars, and even short images are strongly contaminated by several very bright and strongly over-saturated field stars, making the data from this chip useless for our goals.
2.2 Astrometric referencing
For astrometric referencing, the short VLT frame in the band was used (right panel of Fig. 1), which is of higher quality than the short exposures in other bands. To obtain a precise astrometric solution, the positions of the astrometric standards selected from the USNO-B1 astrometric catalogue333USNO-B1 is currently incorporated into the Naval Observatory Merged Astrometric Data-set (NOMAD) which combines astrometric and photometric information of Hipparcos, Tycho-2, UCAC, Yellow-Blue6, USNO-B, and the 2MASS, http://www.nofs.navy.mil/data/fchpix/ were used as a reference. Thousands of USNO-B1 reference objects can be identified in our crowded FOV. The recent release of the Guide Star Catalogue (GSC-II v2.3.2)444see http://gsss.stsci.edu/Catalogs/GSC/GSC2/GSC2.htm provides almost the same number of standards but contains no information on proper motions and the declared astrometric errors (03) are higher than the nominal 02 uncertainty in the USNO-B1. A number of brighter stars from the UCAC2 catalogue are also present but most of them are saturated in our images. We discarded the reference stars with significant proper motions and catalogue positional uncertainties along with those that are saturated in our images. Finally, to minimise potential uncertainties caused by overlapping stellar profiles in the crowded FOV, we selected only 28 isolated stars marked by red circles in the right panel of Fig. 1. Their pixel coordinates were derived making use of the IRAF task imcenter with the accuracy of 0.025 of the image pixel. The IRAF tasks ccmap/cctran were applied to the astrometric transformation of the images. Formal rms uncertainties in the astrometric fit for our image are RA 0198 and Dec 0181, which are compatible with the nominal catalogue uncertainty. A selection of another set of isolated reference objects does not change the result significantly. The combined and images were preliminary aligned to the image reference frame with the accuracy of 001. Accounting for that, a conservative estimate of our 1 astrometric referencing uncertainty is 02 in both RA and Dec for all three optical bands.
To check the Chandra observation pointing accuracy for further comparison of the optical and X-ray images, we also performed astrometric referencing of the J13576429 Chandra archival X-ray images using optical astrometric catalogues. Unfortunately, this was not possible for the HRC-S images obtained with rather short exposures, where we found no suitable reference objects, even when we merged two separate observational blocks (OBs) in one image, to achieve a deeper detection level. In a deeper ACIS-I frame, obtained with about twice as long an exposure, we found 18 point-like objects detected at 3.5 significance, which we identified with relatively bright optical reference objects from the UCAC2 catalogue. Their image positions were defined with the accuracy 0.5 of the ACIS pixel size (pixel scale is 05). The resulting rms uncertainties in the respective astrometric fit are RA 040 and Dec 035 with maximal residuals 08. The shift between the initial and transformed X-ray images was about 015, which is insignificant within the fit uncertainty. Our results are compatible with a nominal Chandra astrometric referencing uncertainty, ensuring us an almost perfect pointing accuracy for the X-ray observations. Below we accept the nominal uncertainty of 06 as a conservative value for comparison with the optical data.
| Date, range, | Epoch | RAJ2000 | DecJ2000 |
|---|---|---|---|
| instrument | [MJD] | [hms] | [dms] |
| 29-08-2000, radio, | |||
| ATCAa | 51785 | 13 57 02.43(2) | 64 29 30.20(10) |
| 06-11-2005, X-ray, | |||
| Chandra/HRCb | 53693 | 13 57 02.57(9) | 64 29 29.94(60) |
| 25-04-2009, optical, | |||
| VLT/I-bandb | 54946 | 13 57 02.64(3) | 64 29 29.52(20) |
| 09-10-2009, X-ray, | |||
| Chandra/ACISb | 55113 | 13 57 02.61(9) | 64 29 29.82(60) |
2.3 Photometric calibration
The observing conditions during our observations were photometric. The photometric calibration was carried out with standards from E7, L107, and NGC2818 Stetson photometric standard fields (Stetson 2000) observed during the same nights as our target. We fixed the atmospheric extinction coefficients at their mean values adopted from the VLT home page: kV = 013 001, kR = 0075 001, and kI = 0056 001. As a result, we obtained the following magnitude zero-points for the summed images, = 2814 002, = 2808 003, and = 2742 003, and colour-term coefficients, = 0.03 0.03, = 0.04 0.04, and = 0.01 0.07, where the errors account for the statistical uncertainties in the magnitude measurements, the extinction coefficient uncertainties, and marginal variations from night to night. The formal detection limits of a point-like object in the co-added images for a one-arcsecond aperture are 285, 280, and 272.
3 Results
3.1 Detection of the pulsar counterpart candidate
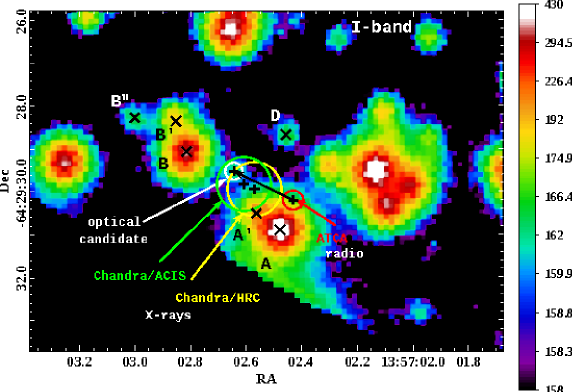
The -band image fragment containing the pulsar is zoomed in Fig. 2. The pulsar positions measured at different epochs in the radio and X-rays are shown by crosses (+). Their 1 uncertainties are shown by ellipses, accounting for the 02 uncertainty in the optical astrometric referencing. The respective coordinates and observational epochs are listed in Table 2, where the X-ray coordinates are remeasured by us. For the Chandra/HRC observations, our results are consistent with those of Zavlin (2007). As noted by Mignani et al. (2011), a significant difference between the radio interferometric (Camilo et al. 2004) and X-ray pulsar positions obtained at different epochs is indicative of a proper motion of the pulsar. From Fig. 2, one can see that the Chandra/ACIS position is apparently shifted from the Chandra/HRC one, also in line with the suggested motion. Although the shift is of a low significance, it shows that the claimed proper motion may be real.
As seen from Fig. 2, at least three of the optical objects in the immediate vicinity of the pulsar can be considered as potential optical counterparts of the pulsar. These are the objects , and marked by X-points, and the ”optical candidate” marked by the plus. The brightest one, object , was analysed and rejected as the counterpart by Mignani et al. (2011). Its colours suggest that this is a main sequence star. The fainter object , which overlaps with and lies closer to the X-ray position of the pulsar, has not yet been analysed. Only a ”background enhancement”, which has been difficult to identify with a real object, was detected at the position of the ”optical candidate” in the five times shorter exposure image analysed by Mignani et al. (2011). In our image, this source is clearly detected at 10 significance level and is certainly not the result of the overlapping wings of the nearby brighter stars and . Among the other potential candidates, its position (presented in Table 2) is most closely compatible with the X-ray position of the pulsar obtained from the ACIS-I observations taken in the same year as the optical data. It is also compatible with the path of the potential proper motion of the pulsar marked in Fig. 2 by a black arrow. This allows us to consider this source as the most plausible candidate for the optical counterpart of the pulsar.
If this is a real counterpart, the respective proper motion of the pulsar, based on about 8.7 yr time base between the radio and optical observations, is = 177 37 mas/yr, with a position angle 67∘ 8∘. This is compatible with estimates based on the difference between the radio and X-ray positions of the pulsar (Mignani et al. 2011). The significance of our result, 4.8, is higher than the 3 quoted by Mignani et al. (2011) because the optical source is localised to higher accuracy. However, the real nature of the source is still to be examined. In addition to the and stars, which were analysed and rejected as counterparts by Mignani et al. (2011), below we analyse in detail the magnitudes and colours of the optical candidate, the object , and the point sources, which are marked by X-points and located close to the pulsar position and/or its possible proper motion path.
In Fig. 3, we compare the images of the same field and demonstrate that the optical candidate, which is marked by a there, is also detected in the and bands. However, it becomes fainter and is detected at 7 and 3 levels, respectively, which is considerably lower than in the band. To help identify this source, we constructed a model point spread function (PSF) for each band based on a set of about 30 isolated and unsaturated field stars and used the allstar task from the IRAF digiphot tool. The task provides an efficient iterative algorithm for a careful subtraction of groups of stars with overlapping PSFs. The latter is crucial in our case, since most of the stars near the pulsar are in these groups. The subtraction process is somewhat imperfect, and we repeated it several times varying the allstar parameters. The results for each of the bands were rather stable, and they are shown in the left panels of Fig. 3. The main contaminating factors for , the nearby objects , , and (cf. Fig. 2), are perfectly subtracted. This is obviously impossible for saturated stars and/or stars whose images overlap with the occulting boundary. Although their residuals are noticeable, they are distant enough from the optical candidate and cannot affect its flux considerably.
The star-subtracted images confirm that in all three bands we indeed detect the same source that we have suggested is the most plausible candidate for the pulsar optical counterpart. We have carefully analysed individual exposures in all three bands and found that this source is not an artefact of either a poor cosmic-ray and bad CCD-pixel rejection or inadequate flat-fielding. The significance of its detection is higher in the star-subtracted images with smoother backgrounds. From the comparison of the images, we also see that is a very red object, which is not detected in the band, and is also hardly resolved in this band.
3.2 Searching for a PWN counterpart
In Fig. 4, we compare the optical and X-ray images of the pulsar+PWN system on a wider spatial scale including the X-ray PWN tail-like extended structure in the immediate vicinity of the pulsar. It is most clearly visible with the Chandra/ACIS (bottom-left panel). Only the brightest part of the structure is seen in a shorter exposure image obtained earlier with the Chandra/HRC (bottom-right panel). As seen, the pulsar counterpart candidate position in the band is fully compatible with the X-ray position of the pulsar, while no reliable counterpart to the extended X-ray structure is visible even in the star-subtracted optical image (top-right panel). The same is true for the and images that are not shown here.
3.3 Photometry
To analyse the magnitudes and colours of the potential optical counterparts and sources marked in Fig. 2, and to compare them with field stars, we performed the PSF photometry on the summed images using the outputs of the allstar task, which we used for the star subtraction. The PSFs were generated for nine-pixel radius, where the bright isolated unsaturated stars selected for the PSF construction merge with the background. An optimal PSF fit radius for field sources was chosen to be about three, four, and five pixels for the , , and bands, respectively, in accordance with different seeing values in these bands (Sect. 2.1). Annulus and dannulus of nine and ten pixels were typically used to extract local backgrounds. They were smaller for , , , , , and the optical candidate , to escape a false background determination near the occulting boundary. The respective aperture corrections were estimated and applied based on the photometry of bright unsaturated field stars. We also performed the aperture photometry. Although the results were consistent with the PSF ones, the magnitude errors were typically larger than those for the PSF photometry, particularly for fainter objects. Therefore, below we present more accurate PSF photometry results, which are collected in Table 3. The errors include the statistical measurement errors, calibration zero-points uncertainties, and corrections for possible star-subtraction uncertainties based on a magnitude dispersion after the reiterations of the subtraction process. Our colour-term calibration coefficients are sufficiently small (see Sect. 2.3), and any colour-term contributions in the transformation from instrumental to real magnitudes for each of the objects and bands were evaluated to be insignificant. They were always within the estimated error budgets even for the reddest field object with and . We ignore them in further considerations. The stellar magnitudes were transformed into fluxes using zero-points provided by Fukugita et al. (1995).
| Source | |||
|---|---|---|---|
| 21.70(02) | 20.72(03) | 19.77(02) | |
| 7.5(2) | 15.5(4) | 29.5(5) | |
| 24.48(03) | 23.22(04) | 22.02(03) | |
| 0.58(02) | 1.56(05) | 3.7(1) | |
| 22.79(02) | 21.67(03) | 20.45(02) | |
| 2.75(05) | 6.5(2) | 15.8(3) | |
| 25.58(05) | 24.18(04) | 22.56(02) | |
| 0.210(009) | 0.64(02) | 2.26(05) | |
| 27.4(4) | 25.51(08) | 23.74(03) | |
| 0.04(01) | 0.19(01) | 0.76(02) | |
| (counterpart | 27.3(3) | 25.52(07) | 24.13(05) |
| candidate) | 0.04(01) | 0.19(01) | 0.53(02) |
| 28.1 | 26.1(1) | 23.67(04) | |
| 0.02 | 0.106(009) | 0.81(03) |
3.4 Colour-magnitude and colour-colour diagrams
Fig. 5 presents the observed colour-magnitude and colour-colour diagrams, collecting about one thousand point-like field objects detected in a magnitude range of 19–28. As in the previous section, the PSF photometry based on the outputs of the allstar task was used to estimate the magnitudes. To minimise the appearance of blended doubles and partially resolved galaxies, only the objects with the allstar sharp parameter 1 detected at 4 point source significance were selected. Brighter objects are not included, because they are saturated in long integration-time images and cannot be measured reliably. This is not critical to our analysis, since all the objects of interest, which are marked in Fig. 2 and listed in Table 3, are in the considered magnitude range. All of them are labelled in Fig. 5.
Some of the diagrams for a magnitude range of 15–25 were presented by Mignani et al. (2011). To avoid the saturation problem for brighter objects, they used only short ten-second exposures, but these exposures had about a three-magnitude lower detection limit. As a result, their colour-magnitude diagrams at magnitudes 22 have a significantly larger colour dispersion than our ones, and, therefore, they are less informative for the colour analysis of fainter sources, including most of the objects marked in Fig. 2.
The main stellar sequence distribution is clearly resolved up to 28 visual magnitude level in our colour-magnitude diagrams, which have a sharp edge at a low colour-index limit. This means that we have collected a considerable portion of the Galactic stellar objects of the considered magnitude range located within an arcminute width beam shaped by the occulting mask and directed toward the pulsar. Only a few objects with 24 are shifted off the distribution towards a zero colour position. They are located far away from the pulsar position and may be either white dwarfs or extragalactic objects.
In the colour-colour diagram, we also show empirical main-sequence curves (Bessell 1979, 1991) extended towards brown dwarfs (Dahn et al. 2002) and reddened with a zero, medium, and entire Galactic extinction, = 0, 2.0, and 5.9 (Schlegel et al. 1998). The colour-colour positions of all the objects marked in Fig. 2, except C, can be linked with the empirical curves by an appropriate choice of . For instance, the brightest objects and from the nearest vicinity of the pulsar lie almost entirely on the main sequence branch reddened with = 2.0. This allows us to roughly identify them as K4V and K6V spectral type stars, respectively, at the distance of about 4.5 kpc. This confirms with a higher confidence the early conclusion (Mignani et al. 2011) that they are ordinary background stars.
The object , that is fainter and located closer to the pulsar, as well as the more distant , are also consistent with the main sequence distribution. The colour properties of a fainter are less certain, but it is likely compatible with the observed main-sequence behaviour at a high-magnitude/high-colour/high-extinction limit. The faintest object is an extremely red object, probably a brown dwarf. The colour information for all these sources shows that they are background objects unrelated to either the pulsar or its PWN.
The colour properties of the counterpart candidate are likely distinct from those of field stars. This is most definitely seen in the versus (vs) diagram, where its position uncertainties are significantly smaller than those in other colour-magnitude plots, and where it is apparently shifted to the left from the main sequence distribution, which bends to the right at 24. The colour differences between the candidate and field sources in the vs and vs diagrams are also visible, though they are less certain owing to the large uncertainties in the magnitude of the candidate.
The position of this source in all the diagrams does not allow us to definitely discard it as a counterpart, as was done for the objects. Any reasonable dereddening, shown by the extinction vector in the vs diagram, cannot place it in the main sequence branch. Therefore, its unusual colour properties are atypical of a field star but compatible with some other pulsar optical counterparts usually detected as faint blue objects. For instance, a similar position relative to the distribution of field stars in the vs and vs diagrams is occupied by the Geminga-pulsar optical counterpart (Kurt et al. 2001, Shibanov et al. 2006). This and the positional agreement of the source with the pulsar, allows us to keep it as the only likely optical counterpart of the pulsar J13576429.
| PL | PL | /dof (dof) | |||||
| 1021 cm-2 | keV | 10-6ph cm-2 s- keV-1 | 10-6ph cm-2 s- keV-1 | ||||
| BBPL | |||||||
| 1.52 | 0.190 | 3.8 | 1.50 | 8.89 | 1.26 | 17.0 | 0.9599 (167) |
| 3.5 | 0.140 | 50.9 | 1.73 | 13.0 | 1.46 | 23.0 | 0.9981 (168) |
| frozen | |||||||
| NSAPL | |||||||
| 3.44 | 0.079 | 1600 | 1.60 | 10.8 | 1.39 | 20.8 | 0.9669 (168) |
| frozen | |||||||
3.5 Multi-wavelength spectrum
Using the measured optical fluxes of the pulsar counterpart candidate together with the available X-ray data, it is useful to construct a tentative multi-wavelength spectrum of the pulsar and compare it with the spectra of other pulsars detected in both spectral domains.
3.5.1 X-ray spectral analysis
As shown by Chang et al. (2012) and Lemoine-Goumard et al. (2011) based on XMM-Newton and Chandra/ACIS observations, the X-ray spectrum of the pulsar can be described by either a blackbody-plus-power-law (BBPL) model or the magnetized neutron-star atmosphere plus power-law (NSAPL) model. Owing to the lower spatial resolution, the flux of the point-like pulsar in the XMM data is contaminated significantly by the extended emission from the PWN, which also has a PL spectrum, while the pulsar is clearly resolved in the Chandra/ACIS data. For any model, the thermal spectral component (BB or NSA), presumably originating from the surface of the neutron star (NS), strongly dominates the emission detected with both instruments in soft and middle energy channels ( 1.5 keV). The non-thermal PL component from the pulsar contributes significantly only to the high energy channels, but it is impossible to distinguish it from the PL component of the PWN in the XMM data.
Accounting for that, we performed independent X-ray spectral fits. We separated the data into two groups: the XMM/EPIC/MOS spectra of the pulsar+PWN system extracted from 20″circular aperture compatible with the XMM PSF and centred on the pulsar; and the Chandra/ACIS-I spectrum of the pulsar extracted from a 15 circle aperture compatible with the ACIS PSF. To determine the model parameters more accurately using the data from both instruments, we fitted both groups simultaneously using the Xspec v.12.3. In our fits, the absorbing column density and the thermal component of the model (BB or NSA) were defined as common for both groups, while the power law components were defined individually for each of the groups to determine the parameters for the pulsar and pulsarPWN nonthermal components, separately. As in the papers cited above, for the NSA model we fixed the NS mass at 1.4M⊙, radius at 10 km, magnetic field at 1 1013 G, estimated from timing observations, and the distance at 2.4 kpc based on the DM (Camilo et al. 2004). The data were fitted in the 0.2–10 keV range, and the results are presented in Table 4. Our results are consistent with the published ones within the uncertainties. At the same time, the parameter and the pulsar photon index for each of the models appear to be less uncertain than the published fits. This is important for further comparison to the optical data. We also note, that the best-fit value is about twice as small for the BBPL model as for NSAPL, although ”freezing” at the NSAPL value provides only a marginally poorer BBPL fit for which the NS surface temperature is considerably lower and the radius of the emitting area is larger than the corresponding values obtained at the ”thawed” . The NSA value of the column density may be more consistent with the DM value for the pulsar (Zavlin 2007). However, as similar significances of the spectral fits do not allow us to conclude which of the models (NSA or BB) is closer to reality, we compare our optical data with both models.
To do that, one has to correct the observed optical fluxes for the interstellar extinction. However, the extinction value to the pulsar is unknown. It can be roughly estimated from an empirical – relation (Predehl & Schmitt 1995), using values obtained above from the X-ray fit. It can also be additionally constrained using the DM distance to the pulsar and the so-called red clump stars from the pulsar field as standard candles for obtaining the –distance relation toward the pulsar. Both methods can be combined to provide an independent distance to the pulsar estimates and additional constraints on and .
3.5.2 Red clump stars and the –distance relation
To derive the –distance relation toward the pulsar, we followed a method described in López-Corredoira et al. (2002), Cabrera-Lavers et al. (2005), and Güver et al. (2010).
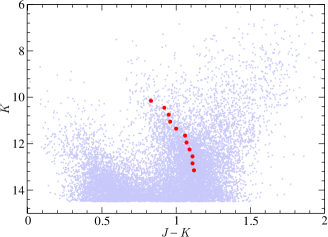
Firstly, we extracted from the 2MASS All-Sky Point Source Catalogue 555see http://irsa.ipac.caltech.edu/applications/DataTag/, DataTag ADS/IRSA.Gator#2011/0530/083402_32642 about 17000 stars which are located within 0.3 degrees of the pulsar position ( = 30992, = 251) and created the colour-magnitude diagram, vs (Fig. 6). The main sequence (left) and red clump (right) branches are clearly resolved in this diagram. We divided the red clump branch into several magnitude bins in the range of 10 13.3 with a bin size of K = 0.3. In each of the bins, we constructed a histogram of the star distribution over the colour and found a mean colour by fitting the histogram with a Gaussian. The mean colours for all the bins are marked by filled circles in Fig. 6.
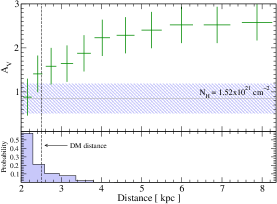
Secondly, for the red-clump population we accepted an absolute magnitude MK = 1.62 0.03, and intrinsic colour ()0 = 0.68 0.07 (López-Corredoira et al. (2002), Cabrera-Lavers et al. (2005), Güver et al. (2010)). Using that and the above colour fits, for each of the bins we calculated the K-band extinction, = , where = 0.657 (Rieke & Lebofsky 1985), and the distance D = 10 pc. Combining the results for all the bins, and using the relationship = 0.112 (Rieke & Lebofsky 1985), we obtained the –distance dependence for the pulsar line of sight, which is shown in Fig. 7 by a red curve.
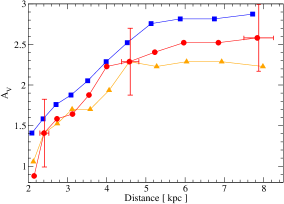
In the absence of significant extinction variations with the Galactic longitude , one can enlarge the region used to perform the extraction of the red clump stars, to increase their number, and, therefore, the accuracy of the –distance relation. However, this is impossible in our case. Shifting the extraction region of the same size as above by 0.5 degrees away of the pulsar along , we found a noticeable extinction variation with the longitude, demonstrated in Fig. 7. This is natural, since the line of sight to the pulsar runs near and almost parallel to the outer edge of the Scutum-Centaurus arm, where the interstellar matter (ISM) density increases towards the arm centre. As a result, the extinction is systematically higher for the region shifted towards the arm centre (larger ), and is lower for the region shifted away from the arm, as it is seen in Fig. 7. Therefore, owing to the ISM density gradient near the arm, any enlargement of the extraction region leads to systematic uncertainties, which do not allow us to increase the accuracy of the –distance relation.
Schlegel et al. (1998) provide = 5.9 for the entire Galactic extinction in this direction, which is about twice as high as our large distance limit, 3. However, for the Galactic latitude 5, as in our case, their estimates can be unreliable. For instance, the Leiden/Argentine/Bonn (LAB) Survey of Galactic HI (Kalberla et al. 2005) indicates that the entire measured in the corresponding direction is as low as 6.6 1021 cm-2. Using a standard relation, = (1.79 0.04) 1021 (Predehl & Schmitt 1995), this gives = 3.7, which is considerably lower than that of Schlegel et al. (1998), and consistent with our value at a 2 significance. Owing to the vicinity of the Scutum-Centaurus arm, the entire hydrogen-column density varies by 30%–40% with a position shift of a fraction of degree around our line of sight, which increases towards the arm centre. This demonstrates that the current indirect estimates of the entire Galactic in this direction are rather uncertain.
At the same time, using the derived –distance relation, we obtain distance estimates for the main-sequence field stars and , which agree with the independent estimates carried out in Sect. 3.4 based on their positions in the colour-colour diagram. Selecting 2.0 based on the diagram (Fig. 5, bottom panel), the –distance relation gives us 4 kpc for these stars, which is compatible with a rough estimate of their distances 4.5 kpc, based on their spectral types estimated from the diagram. This test shows that our –distance relation can be reliably used at least for distances 4–5 kpc.
For the DM distance to the pulsar of 2.5 kpc, the relation provides 1.5 0.5 (Fig. 8). At the same time, = 1.52 1021 cm-2 derived from the BB+PL X-ray spectral fit (see Table 4) leads to a smaller value, = 0.85 0.33. Convolving this with the –distance relation, one can obtain a probability distribution for the distance to the pulsar corresponding to the interval of derived from the fit (bottom panel of Fig. 8). It shows that the pulsar is likely to be closer to us by about 0.5 kpc than the DM distance. The value obtained from the NSA+PL model fit suggests that 1.9 0.15, which is consistent with the DM distance, though the respective distance probability distribution is very wide and inconclusive.
To summarise, the red clump stars allow us to constrain the value and distance for the pulsar within 0.5–2.1 mag and 2–2.5 kpc ranges, respectively, depending on the model applied to fit the X-ray spectrum of the pulsar.
3.5.3 The optical-X-ray spectral energy distribution
Possible unabsorbed optical-X-ray spectral energy distributions (SEDs) of the pulsar emission are presented in Fig. 9, where the optical fluxes are dereddened in accordance with the results obtained in the previous subsection. As seen, for any X-ray spectral model the intrinsic optical fluxes of the counterpart candidate are generally consistent, within the uncertainties, with the extrapolation of the X-ray spectrum towards longer wavelengths. However, the optical spectral slope is much steeper than the slope of the X-ray PL component, suggesting that there is a strong double-knee spectral break between the optical and X-rays. Most pulsars detected in the optical display a flatter spectrum in the optical than in X-rays, with a single break between these ranges. There are only two exceptions, PSR B054069.3 (Serafimovich et al. 2004) and the Vela pulsar (Danilenko et al. 2011). The optical SED of B0540$-$69.3 also suggests that there is a double-knee spectral break, while its spectral index, 1.1 (assuming ), is several times smaller than that for our optical candidate, 4–6. For the Vela pulsar, the optical spectrum is also flat, but in the near-infrared (near-IR) it has a steep flux increase with 3, comparable to what we see for the J13576429 candidate in the optical. Near-IR flux excesses are also observed in the emission of two middle-aged pulsars PSR B0656+14 and Geminga (Danilenko et al. 2011, Shibanov et al. 2006, Durant et al. 2011), although their spectral slopes appear to be less steep than in the Vela case. If our candidate is the real optical counterpart of the pulsar J13576429, this would represent the first example of an unusually steep spectrum of pulsar emission in the optical range.
4 Discussion
In the FORS2/FOV for our observations (Fig. 1), the surface-area number density of observed point-like sources down to the limiting magnitude 28 is 0.2 . The probability of confusion of the pulsar counterpart with an unrelated point-like field optical object that accidentally falls into the 90% Chandra positional uncertainty ellipse of the pulsar with a radius of 06 (Fig. 2) is about 20%. A similar estimate is obtained if we account for only the immediate vicinity of the pulsar. This is not compelling evidence of a true identification, but from the multi-wavelength SED (Fig. 9) it is hard to expect a true counterpart to be significantly brighter than our candidate with 25.5. Pulsar optical fluxes typically do not significantly overshoot the spectrum extrapolated from X-rays. The number density of observed sources in the brightness range of 25.5 28 expected for the counterpart is much smaller, 0.0009 (cf. Fig. 5). The respective confusion probability is 1% and becomes considerably smaller, 0.02%, if we additionally constrain the colour 1.4, as in the counterpart candidate case. This appears to be reasonably compelling evidence of the association of the object with the pulsar. However, the sample of point-like objects in the considered magnitude range may be incomplete, and the confusion probability estimated in this way may be underestimated. It indicates only that the real confusion probability is somewhere between 1% and 20%.
A detailed analysis of the few field objects in the FOV, which fulfil the above magnitude constrants, shows that their locations in the colour-colour diagram are consistent with the main sequence distribution. At the same time, another few objects located within the candidate colour uncertainties in the colour-colour diagram are brighter and lie within the stellar branch in the colour-magnitude diagrams. Summarising all these results, we, therefore, cannot firmly reject the possibility that the detected point-like optical object is the optical counterpart to the radio/X-ray/gamma-ray pulsar J13576429. If it is indeed the counterpart, this implies at least two prominent properties of the pulsar.
Firstly, a significant offset in the counterpart candidate position from the J13576429 radio coordinates measured 8.7 yr earlier, 154 032 (Fig. 2), suggests that the pulsar has a high proper motion (cf. Sect. 3.1). At the most plausible distance range of 2–2.5 kpc, this implies that the transverse velocity of the pulsar is between 1690 350 km s-1 and 2110 440 km s-1. On the other hand, Abramowski et al. (2011) obtained a two-to-three times smaller velocity, 650 km s-1, where is the distance to the pulsar in units of 2.4 kpc and is the pulsar age in units of 7.3 kyr (characteristic age), based on a 7′ offset (5 pc) of the pulsar from the centre of the extended source HESS J1356645, likely associated with an ”ancient” PWN and parent SNR, and assuming that the offset is due to the pulsar proper motion. However, the true ages of pulsars typically differ from characteristic ones by at least 40% (see, e.g. Brisken et al. 2003, Thorsett et al. 2003). Therefore, we can reconcile the difference between the two estimates of the transverse velocity assuming that true age of J13576429 is twice as small as the characteristic one. We note that the position angle of the putative proper motion roughly coincides with the elongation of the X-ray plerion and HESS source images. To our knowledge, the highest pulsar velocity of 1080 100 km s-1, which has been firmly established by direct proper-motion and parallax measurements with the VLBA, belongs to PSR B1508+55 (Chatterjee et al. 2005). The distance to that pulsar, 2.37 0.20 kpc, is comparable to that of J13576429, which suggests that similar direct measurements are also possible for the latter. Another example of a high velocity pulsar is B2224+65, which belongs to the Guitar Hα bow-shock nebula. The radio interferometric measurements give a very precise proper motion for PSR B2224+65 (Harrison et al. 1993), which corresponds to the velocity of about 1600 km s-1, if we assume that the distance is in the range 1–2 kpc. Nevertheless, the distance has not been measured directly, by measurement of the parallax, and remains very uncertain (see, e.g. Chatterjee & Cordes 2004). After the confirmation by radio interferometric observations, J13576429 may become the fastest moving pulsar known. In this context, Hα imaging of the pulsar field would also be useful to search for a bow-shock nebula around the pulsar.
It is remarkable that the direction of the suggested proper motion for J13576429 (Fig. 2; Sect. 3.1) is consistent with the NE extension of the tail-like PWN structure detected in X-rays (Fig. 4). This is similar to what is seen for the Vela and Crab pulsars, for which the proper motion direction virtually coincides with their PWN jet-like structures; this might imply that the extended X-ray structure of J13576429 is actually not a tail but a pulsar jet. That is also supported by the bend of the jet at 15′′ northward of the pulsar (Chang et al. (2012), see Fig. 4), which is reminiscent of the Vela-pulsar outer jet bend (Pavlov et al. 2003). A blob-like structure is visible in the middle of the J13576429 jet. Variable blob-like structures are also typical of the Vela jet. This can be considered as indirect confirmation of the estimated direction of the putative J13576429 proper motion.
Secondly, the putative counterpart has an extremely red spectrum, with the spectral index in the range of 4–6 (Fig. 9). This is atypical of pulsars and raises doubts about the pulsar nature of the candidate. At an unrealistically large of 5.9, comparable to the entire Galactic extinction in this direction, the dereddened spectrum becomes flatter, 2, but the optical flux overshoots the upper limit of the low energy extension of the pulsar X-ray PL emission component by an order of magnitude. This is also atypical of pulsars. As we have estimated from different points of view (Sect. 3.5.2), the real for the pulsar is likely to be 2. At the same time, the observed colour properties of the candidate are distinct from those of field stars, and any dereddening cannot place it on the main stellar sequence branch (Fig. 5), thus rejecting its association with an ordinary star.
One of the possible explanations of the red spectrum is that the candidate is a knot-like structure of the J13576429 PWN, or a combination of the emission from the unresolved pulsar and a nearby knot. Such an optical knot, located only 065 of the pulsar, is known to exist in the Crab pulsar/PWN system (Hester et al. 1995). It is projected onto the pulsar’s SE jet and has a power-law spectrum with 1.2, which is significantly steeper than the almost flat optical spectrum of the Crab pulsar (Sandberg & Sollerman 2009). Similar PWN knots are likely present near the Vela pulsar, where they have even steeper spectra with 3 (Danilenko et al. 2011, Shibanov et al. 2003), which is comparable to what we see for J13576429. This is a plausible interpretation, since the candidate position is shifted, albeit insignificantly, from the X-ray pulsar position by about 02 along the NE jet (Figs. 2, 4).
This steep spectrum could also be produced by an X-ray illuminated fall-back disk around the pulsar (Perna et al. 2000). The disks are presumably formed soon after the parent supernova explosions. However, in our case this model does not work because the pulsar X-ray luminosity is too low to provide the optical flux density at the observed level after the reprocessing of X-rays to the optical in a hypothetical disk. In principle, an accreting fall-back disk with appropriate parameters can fit the optical data. This model could be thoroughly examined if the pulsar nature of the candidate were confirmed.
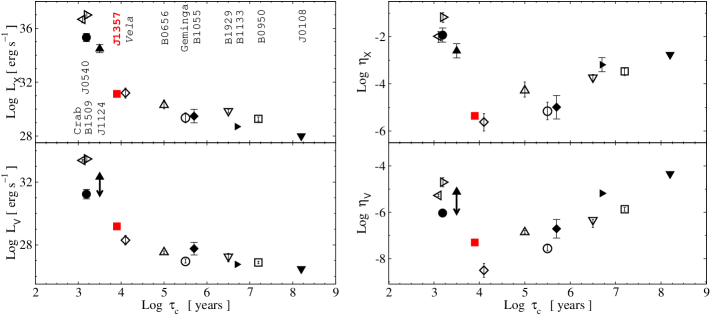
On the other hand, ignoring the spectral steepness and assuming that the candidate is the true pulsar optical counterpart, we can estimate the pulsar optical luminosity in the band, = 1.5 1029 ergs s-1, and efficiency, = / = 4.8 10-8, and compare them with those for other optical pulsars. The comparison is shown in Fig. 10, where we have also added the X-ray luminosities and efficiencies of the same pulsars. One can see that our pulsar candidate does not look outstanding in these integral dependencies. As expected, it lies close to the Vela pulsar, which is known to be under-luminous, or inefficient, in the optical and X-rays and forms a pronounced minimum in the and dependences with age (Zharikov et al. 2004, 2006). The ratio of to of about 100 for our pulsar is also in the range of 100–1000 observed for other pulsars. All that supports the assumption that J13576429 is a Vela-like pulsar, as follows from its other properties (see Sect. 1), and is indirect evidence that we detected the real optical counterpart of J13576429.
An alternative interpretation could be a faint extragalactic source, such as an active galactic nucleus (AGN). The spectral index of about 2, as we have obtained above after dereddening with the entire Galactic extinction, is allowed for these objects (Grupe et al. 2010). However, no signs of the putative AGN are seen in other spectral domains. Luminous X-ray emission is a primary signature of AGN activity. The typical X-ray-to-optical flux ratios, /, of AGNs obey a condition 0.5, or 0.1 for blazars (Green et al. 2004). Using the dereddened source magnitudes 20.68 and 20.32, we converted them into the SDSS band magnitude of 20.85. On the basis of the above constraints and the formula from Green et al. (2004), , we estimated a lower limit to the 0.5–2 keV range from possible AGN, (0.3–1.2) 10-14 ergs s-1 cm-2, which is at least a factor of five lower than the unabsorbed X-ray flux detected from the pulsar/PWN system in the same range, (6–14) 10-14 ergs s-1 cm-2, depending on the model accepted for the pulsar thermal emission component. In the limiting case, the putative AGN would noticeably contaminate the pulsar/PWN X-ray flux by 20%, but we do not resolve any background point-like X-ray object at the pulsar position except for the pulsar. This means that a putative AGN or a galaxy is fainter in X-rays than the pulsar by an order of magnitude, which cannot be completely excluded by the above estimates and current data. AGNs and galaxies occupy a region that is very distinct from that of stars in the infrared colour-colour diagram (Kim et al. 2011), and multi-band infrared observations can help us to clear the real nature of the object.
To summarise, we have detected a candidate optical counterpart of the pulsar J13576429. It appears to have an extremely high transverse velocity and an unusually steep optical spectrum. Radio interferometric observations are necessary to confirm the high proper motion of the pulsar and measure its parallax and distance. High resolution imaging provided by the HST or ground-based telescopes with AO systems would be useful to resolve a possible PWN knot near the pulsar position, which would explain the steepness of the spectrum. It can also help us to measure the candidate proper motion. If the results of this measurement coincide with those of forthcoming radio measurements of the pulsar proper motion, this would be a firm confirmation of the pulsar nature of the optical object. The Hα imaging would allow us to search for a bow-shock nebula around such a high velocity pulsar and to constrain independently the parameters of the pulsar wind. Deep infrared imaging of the pulsar field is crucial to extend the SED of the candidate towards longer wavelengths and understand whether it is really associated with the pulsar or it is a distant background galaxy or AGN.
Acknowledgements.
We are grateful to an anonymous referee for useful comments improving the paper. The work was partially supported by the Russian Foundation for Basic Research (grants 11-02-00253 and 11-02-12082), Rosnauka (Grant NSh 3769.2010.2), and the Ministry of Education and Science of the Russian Federation (Contract No. 11.G34.31.0001). SZ acknowledges support from CONACYT 151858 project. The work by GP was partly supported by NASA grant NNX09AC84G. REM acknowledges support by the BASAL Centro de Astrofísica y Tecnologias Afines (CATA) PFB–06/2007. We used the USNOFS Image and Catalogue Archive operated by the United States Naval Observatory, Flagstaff Station (http://www.nofs.navy.mil/data/fchpix/). The Munich Image Data Analysis System (MIDAS) is developed and maintained by the European Southern Observatory. Image Reduction and Analysis Facility (IRAF) is distributed by the National Optical Astronomy Observatories, which are operated by the Association of Universities for Research in Astronomy, Inc., under cooperative agreement with the National Science Foundation.References
- Abramowski et al. (2011) Abramowski, A., Acero, F., Aharonian, F., et al., 2011, A&A, 533, A103
- Bessell (1979) Bessell, M. S., 1979, PASP, 91, 589
- Bessell (1991) Bessell, M. S., 1991, AJ, 101, 662
- Brisken et al. (2003) Brisken, W. F., Fruchter, A. S., Goss, W. M., Herrnstein, R. M., & Thorsett, S. E., 2003, AJ, 126, 3090
- Cabrera-Lavers et al. (2005) Cabrera-Lavers, A., Garzón, F., & Hammersley, P. L., 2005, A&A, 433, 173
- Camilo et al. (2004) Camilo, F., Manchester, R. N., Lyne, A. G., et al., 2004, ApJ, 611, L25
- Chang et al. (2012) Chang, C., Pavlov, G. G., Kargaltsev, O., & Shibanov, Yu. A., 2012, ApJ, 744, 81
- Chatterjee & Cordes (2004) Chatterjee, S., & Cordes, J. M., 2004, ApJ, 600, L51
- Chatterjee et al. (2005) Chatterjee, S., Vlemmings, W. H. T., Brisken, W. F., et al., 2005, ApJ, 630, L61
- Dahn et al. (2002) Dahn, C. C., Harris, H. C., Vrba, F. J., et al., 2002, AJ, 124, 1170
- Danilenko et al. (2011) Danilenko, A. A., Zyuzin, D. A., Shibanov, Yu. A., & Zharikov, S. V., 2011, MNRAS, 415, 867
- Durant et al. (2011) Durant, M., Kargaltsev, O., & Pavlov, G. G., 2011, ApJ, 743, 38
- Esposito et al. (2007) Esposito, P., Tiengo, A., de Luca, A., & Mattana, F., 2007, A&A, 467, L45
- Fukugita et al. (1995) Fukugita, M., Shimasaku, K., & Ichikawa, T., 1995, PASP, 107, 945
- Green et al. (2004) Green, P. J., Silverman, J. D., Cameron, R. A., et al., 2004, ApJS, 150, 43
- Grupe et al. (2010) Grupe, D., Komossa, S., Leighly, K. M., & Page, K. L., 2010, ApJS, 187, 64
- Güver et al. (2010) Güver, T., Özel, F., Cabrera-Lavers, A., & Wroblewski, P., 2010, ApJ, 712, 964
- Harrison et al. (1993) Harrison, P. A., Lyne, A. G., & Anderson, B., 1993, MNRAS, 261, 113
- Hester et al. (1995) Hester, J. J., Scowen, P. A., Sankrit, R., et al., 1995, ApJ, 448, 240
- Kalberla et al. (2005) Kalberla, P. M. W., Burton, W. B., Hartmann, D., et al., 2005, A&A, 440, 775
- Kim et al. (2011) Kim, D.-W., Protopapas, P., Trichas, M., et al., 2011, ApJ (submitted) arXiv:1110.5632
- Kurt et al. (2001) Kurt, V. G., Komarova, V. N., Sokolov, V. V., et al., 2001, Bull. Special Astrophys. Obs., 51, 21
- Lemoine-Goumard et al. (2011) Lemoine-Goumard, M., Zavlin, V. E., Grondin, M.-H., et al., 2011, A&A, 533, A102
- López-Corredoira et al. (2002) López-Corredoira, M., Cabrera-Lavers, A., Garzón, F., & Hammersley, P. L., 2002, A&A, 394, 883
- Mignani et al. (2003) Mignani, R. P., de Luca, A., Kargaltsev, O., et al., 2003, ApJ, 594, 419
- Mignani et al. (2011) Mignani, R. P., Shearer, A., de Luca, A., et al., 2011, A&A, 533, A101
- Pavlov et al. (2003) Pavlov, G. G., Teter, M. A., Kargaltsev, O., & Sanwal, D., 2003, ApJ, 591, 1157
- Perna et al. (2000) Perna, R., Hernquist, L., & Narayan, R., 2000, ApJ, 541, 344
- Predehl & Schmitt (1995) Predehl, P., & Schmitt, J. H. M. M., 1995, A&A, 293, 889
- Rieke & Lebofsky (1985) Rieke, G. H., & Lebofsky, M. J., 1985, ApJ, 288, 618
- Sandberg & Sollerman (2009) Sandberg, A., & Sollerman, J., 2009, A&A, 504, 525
- Schlegel et al. (1998) Schlegel, D. J., Finkbeiner, D. P., & Davis, M., 1998, ApJ, 500, 525
- Serafimovich et al. (2004) Serafimovich, N. I., Shibanov, Yu. A., Lundqvist, P., & Sollerman, J., 2004, A&A, 425, 1041
- Shibanov et al. (2003) Shibanov, Yu. A., Koptsevich, A. B., Sollerman, J., & Lundqvist, P., 2003, A&A, 406, 645
- Shibanov et al. (2006) Shibanov, Yu. A., Zharikov, S. V., Komarova, V. N., et al., 2006, A&A, 448, 313
- Stetson (2000) Stetson, P. B., 2000, PASP, 112, 925
- Thorsett et al. (2003) Thorsett, S. E., Benjamin, R. A., Brisken, W. F., Golden, A., & Goss, W. M., 2003, ApJ, 592, L71
- Zavlin (2007) Zavlin, V. E., 2007, ApJ, 665, L143
- Zharikov et al. (2004) Zharikov, S. V., Shibanov, Yu. A., Mennickent, R. E., et al., 2004, A&A, 417, 1017
- Zharikov et al. (2006) Zharikov, S., Shibanov, Yu., & Komarova, V., 2006, Advances in Space Research, 37, 1979