Optimal Placement of Origins for DNA Replication
Abstract
DNA replication is an essential process in biology and its timing must be robust so that cells can divide properly. Random fluctuations in the formation of replication starting points, called origins, and the subsequent activation of proteins lead to variations in the replication time. We analyse these stochastic properties of DNA and derive the positions of origins corresponding to the minimum replication time. We show that under some conditions the minimization of replication time leads to the grouping of origins, and relate this to experimental data in a number of species showing origin grouping.
pacs:
87.10.Ca, 87.14.gk, 87.16.SrThe replication of the DNA content of a cell is one of the most important processes in living organisms. It ensures that the information needed to synthesize proteins and cellular components is passed on to daughter cells in a robust and timely fashion. Replication takes place during the S-phase of the cell cycle, and it starts from specific locations in the chromosome called origins. In order to function in a particular round of the cell cycle, possible origin locations (loci) must undergo a sequence of binding events before S-phase starts. This culminates in the clamping of one or more pairs of ring-shaped Mcm2-7 molecules around the DNA; this is known as licensing. Below we denote a pair of Mcm molecules as pMcm. Features of human replication have been studied with the help of the yeast S. cerevisiae and X. laevis frog embryos. In S. cerevisiae licensing is only possible at a set of specific points in each chromosome, characterized by the presence of specific DNA sequences, whereas in X. laevis embryos the licensing proteins can bind at virtually any location in the genome Kelly and Brown (2000). When a licensed locus activates in S-phase, two replication forks are created at the origin, and they move in opposite directions with approximately constant speed, duplicating the DNA as they travel through the chromosome [Fig. 1(a)]. Both origin licensing and origin activation time are stochastic events, since they result from molecular processes involving low-abundance species. In X. laevis, both the loci that are licensed and licensed loci selected for activation vary randomly from cell to cell, whereas in S. cerevisiae each of the fixed loci has a certain probability of being activated in any given cell — the competence — which reflects the fraction of cells in a population in which that locus has had time to be licensed before the S-phase starts de Moura et al. (2010).
The total time it takes to replicate a cell’s DNA — the replication time — is a quantity of crucial importance for biology, since it is clearly an evolutionary advantage for replication to be rapid as it affects the minimum time required for cells to duplicate. The location of the origins is one of the crucial factors determining the replication time of cells, and it is reasonable to expect that the loci have been selected by evolution such that the replication time is minimized. There are a number of recent theoretical and modeling works on the dynamics of DNA replication (reviewed in Hyrien and Goldar (2010)). Previous theoretical works on S. cerevisiae have used the experimentally determined loci as given parameters, without attempting to understand why the origins are located where they are Spiesser et al. (2009); Brümmer et al. (2010); de Moura et al. (2010); Yang et al. (2010). Inspection of the loci on a S. cerevisiae genome map shows groups of two or three very close origins which are very prominent in most chromosomes Nieduszynski et al. (2007). There is also experimental evidence for grouping in X. laevis, where origins seem to be distributed with groups of 5 to 10 pMcms Mahbubani et al. (1997); Blow et al. (2001); Edwards et al. (2002).Most of the existing models of replication in X. laevis Blow et al. (2001); Jun and Bechhoefer (2005); Zhang and Bechhoefer (2006); Goldar et al. (2008); Yang and Bechhoefer (2008); Blow and Ge (2009) – an exception is Jun et al. (2004) – assume the origins to be random and independent of each other, and so they cannot explain pMcm grouping or the observed maximum-spacing of 25 kilobases (kb) between adjacent origins Blow et al. (2001).
In this Letter, we use a simplified mathematical model of the DNA replication process to determine the optimal origin location in a chromosome which leads to the shortest average replication time, and how this optimal placement depends on parameters such as the origin competences and the width of the activation time probability distribution. We show that contrary to what one might expect, in many cases the replication time is minimized by placing origins close together in groups like those observed in real chromosomes. This suggests that origin locations have been selected to minimize the replication time. Analysis of our model reveals that grouping is favored for low-competence origins and for origins with large stochastic fluctuations in their activation time. The reason for this is that if origins have an appreciable likelihood of either failing to activate (low competence) or of taking a very long time to activate, grouping origins together helps reduce the risk of large regions of the chromosome not being replicated on time. If the origins are highly competent and have a well-defined activation time, it is optimal to have maximal coverage and distribute the origins evenly on the chromosome. We further show that there is an abrupt transition in the optimal configuration of origins, from isolated to grouped, as the locus’ competence decreases (in S. cerevisiae), and also as the width of the activation time distribution increases. We give an intuitive explanation of this phenomenon, and argue that it is robust, and independent of any particular details of the model. These results are derived analytically, and tested through numerical simulations. We also compare quantitatively the predictions of our theory with the available experimental data for both S. cerevisiae and X. laevis, and find that they match well.
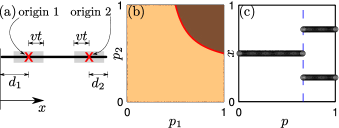
We start by analyzing the case of stochasticity in licensing of fixed origin loci, as in S. cerevisiae. DNA is modeled as a one-dimensional segment of unit length, and we for simplicity consider only two loci in the chromosome. The two origin loci have competences and — these are the probabilities that origins have been licensed and can therefore start replication forks. We initially make the assumption that origins activate at a well-defined time (which we set to ). All replication forks travel at the same unit speed across the DNA. We consider the geometry depicted in Fig. 1(a); is the distance from the left (right) end of the chromosome to the left (right) most locus. If both loci fail to be licensed we postulate that replication will eventually take place anyway, with a replication time — for example, we can imagine that stretch of DNA will be replicated by forks originating from origins outside of the region we are considering. Our results do not depend on , as will be clear shortly; this is just a mathematical device to prevent us dealing with infinite replication times.
If only one of the loci fails to become licensed, the replication time depends on the time it takes for the fork to reach the furthest end of the segment, so for locus 1 and for locus 2. If both loci have been licensed the replication time is defined by the longest time for a fork to reach the end of the segment or for two forks to collide. It can be shown that the replication time of an asymmetric placement of loci is never less than a corresponding symmetric configuration (that is, with ). Therefore we consider only symmetrical locus placements, and use with . The average replication time is then given by .
This is a piecewise-linear function with discontinuities at and . Hence, can only have a minimum found at , or at . Placing loci at the end of a segment () is obviously not a minimum of . The replication times for and are and . We conclude that the two loci group together () to achieve minimum replication time if , which leads to the condition
| (1) |
Notice here that drops out. The inequality Eq. (1) defines two regions on the – plane, corresponding to grouped or isolated loci being optimum. This is shown in Fig. 1(b), where this analytical result is confirmed by stochastic simulations. The region above the curve corresponds to competences for which is minimized by loci being apart () and below the curve for organising these in a group (). In general, if one of the loci has low competence grouping gives the minimum . In fact, it can be shown that if one of the loci has a competence lower than 50%, grouping is the optimal situation regardless of the competence of the other — even if the other is close to 100% competent.
For the case of equal competences, , the grouped configuration is optimal if . We ran a numerical optimization algorithm (using genetic algorithms PGAPack ) to find the loci corresponding to the least for a range of ; these results are shown in Fig. 1(c). The same transition also takes place for non-identical values of and — whenever one crosses from the dark to the light regions of Fig. 1(b).
The above results may seem at first quite counter-intuitive; one might expect that the configuration with the least replication time would correspond to isolated loci (). However, if the origins have a significant chance of failing to activate, this configuration would mean that often one side of the chromosome would have to wait for a fork which originated at the origin on the other site to replicate it, therefore increasing . So in the case of low competences, it becomes advantageous to have both loci centered, which is near any point in the chromosome. This explains the condition for grouping if .
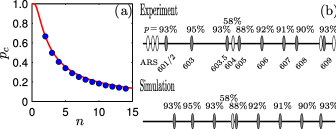
In reality eukaryotic chromosomes have more than two loci Hyrien and Goldar (2010), so next we investigate the case of a chromosome on which there are many loci and examine the conditions under which it becomes favorable to have isolated origin loci compared to groups. In this analysis we will assume for simplicity that the loci all have identical competence. We consider a group of loci as one single locus with an effective competence . For a group consisting of loci is the competence that at least one locus will be licensed there, and is given by . We assume that one large group of identical loci breaks up into two groups of equal size, each consisting of loci. A locus organized with others in a group of size rather than with loci will give minimum , as long as the locus’ competence is less than its critical probability , given by , which yields . Figure 2(a) confirms our analytical result showing the value of for increasing group sizes in our simulations. These results clearly show that large groups of many highly competent loci are unfavorable, but that groups tend to form for low-competence loci.
Our hypothesis is that selective pressure has influenced the position of origin loci through the minimization of the replication time. We show in Fig. 2(b) locus competence and location data for yeast chromosome VI, which has been studied extensively Shirahige et al. (1993); de Moura et al. (2010). Competences cannot be measured for all loci (in white), because either they are too close to the end of the chromosome or to an adjacent locus. We performed a search for the optimal position for the loci in the region with known competences using a genetic algorithm PGAPack . We remark that there is an identifiability problem as all strong loci have and we therefore constrained the ordering during the optimization. Although in this result we do not consider inter-origin variations in the origin activation time, the predicted locus distribution from these simulations bears a good resemblance to the actual spacing with a score of 111 is a measure of the difference between the gap distribution of the optimized and random cases. A gap is defined as the separation between the experimental locus position and that of the optimization : . is akin; the average separation that arises from placing a locus uniformly randomly and . means that the optimization fits the experimental loci positions perfectly; indicates no difference to that of a random placement.; in particular we recover the group in the middle, in which an origin locus with 58% competence is placed next to one with 88% competence. Even multiple repeats of the optimisation algorithm produce minimum solutions which have on average .
The above discussion focused on the case of pre-defined loci in yeast, and ignored additional noise such as the variation in origin activation time. We show in Fig. 3(d) that the previous pattern of origin grouping is preserved in the two-origin model with stochastic variation in origin activation time. Grouping is important for swift replication under conditions of low competence and large noise which we will explain in the remainder of this letter.
We now examine the case of stochastic activation time for X. laevis embryos as a model organism. Unlike loci in yeast, any DNA locus in an X. laevis embryo is capable of binding with pMcm to become an origin. Surprisingly, biologists find roughly equally-spaced groups of 5–10 pMcms separated by approximately 10 kb Mahbubani et al. (1997); Blow et al. (2001); Edwards et al. (2002). We will use the same approach as above, but now with respect to stochasticity in the replication time. In this case, an “origin” is defined as a locus where at least one pMcm has bound to it, and so it corresponds to 100% competent locus in the notation we have used so far. It is well accepted by biologists, however, that origin activation time is stochastic. For simplicity we assume that the pMcms at an origin can activate with uniform probability at any time within a window which has a lower boundary at min and an upper at , which is at maximum the length of an S-phase (20 min). In addition, pMcms are assumed to be all identical with the same activation probability distribution (standard deviation ).
The expectation is that we will again see a transition of the optimal configuration from isolated pMcms to groups as increases; this is akin to varying competence in our previous scenario. We test this prediction using the two-origin model with one pMcm bound to one origin; we find numerically the optimal (minimum ) positions for the origins as a function of . The results are presented in Fig. 3(a). We again use a segment of unit length and forks progress at unit speed of . We observe a sharp transition at , above which it is best to place both origins in the middle of the segment, as observed in the case with varying competence. A minor difference between this case and the previous one is that for , the optimal location of the origins is not constant.
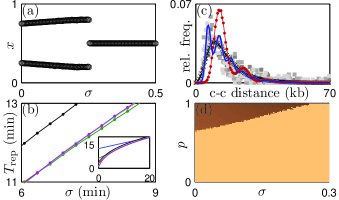
We now apply this model for more origins and pMcms, using realistic parameters so that we can relate the results to what is experimentally known about X. laevis’ pMcm distribution. We model a stretch of DNA of size 100 kb and kb/min Raghuraman et al. (2001). To determine whether the minimum-replication-time configuration requires pMcm grouping, we distributed 64 pMcms in total, i.e. that there is on average as found in nature Mahbubani et al. (1997). The pMcms are then placed in groups of origins, so that the origins are uniformly distributed through the 100 kb chromosome, or completely random. Other authors have identified to be 6–10 min in X. laevis Herrick (2002); Goldar et al. (2008) as well as in S. cerevisiae Raghuraman et al. (2001); Brümmer et al. (2010); de Moura et al. (2010); Sekedat et al. (2010). Our results [Fig. 3(b)] indicate that grouping with an equal spacing of up to 12.5 kb achieves precise and fast DNA synthesis before the end of S-phase (20 min) for within these limits. We also find that 8 groups of 8 pMcms gives the advantage of a 1.1 min quicker than using random loci; even when the number of pMcms at these 8 groups varies, a quicker is achieved (data not shown). Grouping pMcms also protects the overall replication process against fluctuations from one round of the cell cycle to another; a similar problem is discussed in Yang and Bechhoefer (2008). This is because one initiation event at an origin is sufficient to activate replication forks.
One might expect that in a natural environment there would not be strict equal spacing of groups. We now relax our previous assumption by taking evenly-spaced groups and perturb the location of each group by a small random amount drawn from a Gaussian distribution. The introduction of such variation allows us to compare our simulation with available experimental data of replicated genomic regions, which were captured as center-center distances at around 5 min after the onset of replication (cf. Blow et al. (2001)). Figure 3(c) shows that our result is in agreement with the current understanding of the biological community, i.e. groups of 5-10 pMcms about every 10 kb. This may be achieved by a regulation of pMcm-loading proteins, whose affinity to bind decreases around existing origins Rowles et al. (1999); Oehlmann et al. (2004). Although a random placement represents the data similarly well, remains smaller in this case where the origin groups are not equally-spaced as seen before [cf. Figure 3(b)]. This shows that grouping of origins remains favorable even in a more general setting [Fig. 3(d)].
Acknowledgements.
We thank C. A. Nieduszynski and C. A. Brackley for critical reading of the manuscript. We also would like to thank the referees for their suggestions to the manuscript. This work has been supported through the Scottish University Life Sciences Alliance and the Biotechnology and Biological Sciences Research Council (grant numbers BB/G001596/1 and BB-G010722).References
- Kelly and Brown (2000) T. J. Kelly and G. W. Brown, Annu. Rev. Biochem. 69, 829 (2000).
- de Moura et al. (2010) A. P. S. de Moura et al., Nucl. Acids Res. 38, 5623 (2010).
- Hyrien and Goldar (2010) O. Hyrien and A. Goldar, Chromosome Res. 18, 147 (2009).
- Spiesser et al. (2009) T. W. Spiesser, E. Klipp, and M. Barberis, Mol. Genet. Genomics 282, 25 (2009).
- Brümmer et al. (2010) A. Brümmer et al., PLoS Comput. Biol. 6, e1000783 (2010).
- Yang et al. (2010) S. C.-H. Yang, N. Rhind, and J. Bechhoefer, Mol. Syst. Biol. 6, 404 (2010).
- Nieduszynski et al. (2007) C. A. Nieduszynski et al., Nucl. Acids Res. 35, D40 (2007).
- Mahbubani et al. (1997) H. M. Mahbubani et al., J. Cell. Biol. 136, 125 (1997).
- Blow et al. (2001) J. J. Blow et al., J. Cell. Biol. 152, 15 (2001).
- Edwards et al. (2002) M. C. Edwards et al., J. Biol. Chem. 277, 33049 (2002).
- Jun and Bechhoefer (2005) S. Jun and J. Bechhoefer, Physical Review E 71, 011909 (2005).
- Zhang and Bechhoefer (2006) H. Zhang and J. Bechhoefer, Phys. Rev. E. 73, 051903 (2006).
- Goldar et al. (2008) A. Goldar et al., PLoS ONE 3, e2919 (2008).
- Yang and Bechhoefer (2008) S. C.-H. Yang and J. Bechhoefer, Phys. Rev. E. 78, 41917 (2008).
- Blow and Ge (2009) J. J. Blow and X. Q. Ge, EMBO reports 10, 406 (2009).
- Jun et al. (2004) S. Jun et al., Cell Cycle 3, 211 (2004).
- (17) PGAPack, http://ftp.mcs.anl.gov/pub/pgapack/ .
- Shirahige et al. (1993) K. Shirahige et al., Mol. Cell Biol. 13, 5043 (1993).
- Note (1) is a measure of the difference between the gap distribution of the optimized and random cases. A gap is defined as the separation between the experimental locus position and that of the optimization : . is akin; the average separation that arises from placing a locus uniformly and randomly and . means that the optimization fits the experimental loci positions perfectly; indicates no difference to that of a random placement.
- Raghuraman et al. (2001) M. K. Raghuraman et al., Science 294, 115 (2001).
- Herrick (2002) J. Herrick, J. Mol. Biol. 320, 741 (2002).
- Sekedat et al. (2010) M. D. Sekedat et al., Mol. Syst. Biol. 6, 353 (2010).
- Rowles et al. (1999) A. Rowles, S. Tada, and J. J. Blow, Journal of cell science 112, 2011 (1999).
- Oehlmann et al. (2004) M. Oehlmann, A. J. Score, and J. J. Blow, The Journal of cell biology 165, 181 (2004).