The shallow-decay phase in both optical and x-ray afterglows of Swift GRB 090529A: Energy injection into a wind-type medium?
Abstract
The energy injection model is usually proposed to interpret the shallow-decay phase in Swift GRB X-ray afterglows. However, very few GRBs have simultaneous signatures of energy injection in their optical and X-ray afterglows. Here, we report optical observations of GRB 090529A from 2000 sec to 106 sec after the burst, in which an achromatic decay is seen at both wavelengths. The optical light curve shows a decay from 0.37 to 0.99 with a break at 105 sec. In the same time interval, the decay indices of the X-ray light curve changed from 0.04 to 1.2. Comparing these values with the closure relations, the segment after 3 sec is consistent with the prediction of the forward shock in an ISM medium without any energy injection. The shallow-decay phase between 2000 to 3 sec could be due to the external shock in a wind-type-like medium with an energy injection under the condition of . However, the constraint of the spectral region is not well consistent with the multi-band observations. For this shallow-decay phase, other models are also possible, such as energy injection with evolving microphysical parameters, or a jet viewed off-axis,etc.
1 Introduction
Gamma-ray bursts (GRBs) are considered to be produced by the merger of binary compact stars (Type-I GRBs), or by the death of massive stars (Type-II GRBs) (e.g., Paczyński. 1998; Zhang et al. 2009), with a relativistic fireball shell (ejecta) expanding into an uniform interstellar medium (ISM), or the preburst stellar wind of the progenitor star with a density distribution of (e.g., Chevalier & Li 1999; Dai & Lu 1998a). The standard fireball model (Sari et al. 1998) was well capable of interpreting most of observations before Swift. After Swift was launched in 2004 (Gehrels et al. 2004), our understanding of GRB physics has been revolutionized by lots of unexpected discoveries from space- and ground-based observations. Almost half of the Swift GRBs show canonical light curves in their X-ray afterglows,and the origin of shallow-decay behavior is highly debated (e.g., Granot 2006; Zhang et al. 2006; Liang et al. 2007; Nousek et al. 2006; Evans et al. 2009). Several models have been proposed to interpret this behavior, such as prior emission (Yamazaki 2009; Liang et al. 2010), off-axis jet viewing (Granot et al. 2002; Eichler & Granot 2006), X-ray dust scattering (Shao & Dai 2007), microphysical parameters evolving (Granot, Konigl & Piran 2006; Panaitescu et al. 2006) and energy injection (Dai & Lu 1998b,1998c; Sari & Mészáros 2000; Nousek et al. 2006; Zhang et al. 2006;).
The signature of energy injection has been reported in the literature for a few GRB afterglows. For example, GRB 050408 (de Ugarte Postigo et al. 2007), whose multi-band light curve shows a rebrightenning phase at 2.9 days after the burst accromatically, is considered as a likely off-axis event with an energy injection. This case is also thought to have taken place in both X-ray and optical afterglows of GRB 071010A (Covino et al. 2008), whose sharp rebrightenning at 0.6 days after the burst is considered as a discrete energy injection. The plateau phases in both the X-ray and the optical afterglows of GRB 061121 are consistent with an injection of energy (Page et al. 2007), but the transition from plateau to the later phase is only visible in X-ray afterglows. A long-duration shallow-decay phases in both the X-ray and the optical afterglows is also evident in long-duration GRB 060729 (T sec) (Grupe et al. 2007), which could be well explained via a long-term energy injection. The transition break between the shallow-decay phase and the normal-decay phase lies at about 60 ks and about 50 ks for X-ray and optical afterglows, respectively. There are multiple further examples of GRBs which feature strong energy injections in the optical, but which are hardly or not at all visible in the X-rays (usually due to sparse coverage), such as GRB 021004 (e.g., de Ugarte Postigo et al. 2005), GRB 030329 (e.g., Lipkin et al. 2004), GRB 060206 (Wozniak et al. 2006, Monfardini et al. 2006), GRB 060526 (Dai et al. 2007, Thöne et al. 2010), GRB 070125 (Updike et al. 2008) and GRB 090926A (Rau et al. 2010, Cenko et al. 2011).
GRB 090529A provides another good case, like GRB 060729, that both optical and X-ray afterglows have a long-term energy injection before the phase of normal achromatic decay. Thus, it is a good example for us to undertake a detailed study of this topic. Both X-ray and optical afterglows show shallow-decay segments within a similar time range, which is followed by a steeper, almost achromatic decay. This behavior can be well-interpreted as an energy injection via a refreshed shock or late-time central engine activity.
In this paper, we report our observations of the optical afterglow for GRB 090529A using several ground-based optical telescopes. The optical and X-ray afterglow data are used to explore the nature of this event. Our observations are reported in section 2. A joint optical and X-ray data analysis and discussions are presented in section 3. Energy budget will be given in section 4. Summary and conclusions are presented in section 5. The notation is used throughout the paper, where is the spectral flux density at the frequency .
2 Observations and Data Reduction
GRB 090529A was detected by the Burst Alert Telescope (BAT) onboard of Swift (Sakamoto et al. 2009a) at 14:12:35 UT on 2009 May 29 (trigger 353540) during a pre-planed slew. Since Swift did not observe the start of the burst, its duration could only be given as a lower limit, but it was still longer than 100s in the 15-350 KeV band (Markwardt et al. 2009), and it therefore belongs to a long-duration class of bursts (Kouveliotou et al. 1993). It is interesting that no other missions detected this burst. Even SPI-ACS/INTEGRAL which could detect the burst have no rate increase in the data around GRB 090529 trigger time. Most probably the burst was too soft to be detected by SPI-ACS. The significant short spike with a duration of 0.1 s occured 20 s before trigger time111http://www.isdc.unige.ch/integral/science/grb, however there is no clear relationship of the spike with GRB 090529. The Swift X-ray Telescope (XRT) began to observe the burst 197.1 seconds after the burst, and found a counterpart. Meanwhile, no new source was found in the first white finding chart of the Swift UVOT instrument, but a new source was detected in the second white image at 883 sec after the burst trigger (Sakamoto et al. 2009a). The optical afterglow was observed by several ground-based telescopes, and its spectroscopic redshift of was determined by the ESO Very Large Telescope (Malesani et al. 2009). The time-integrated -ray spectrum is well fitted by a single power-law with a photon index of 2.00.3 (Markwardt et al. 2009). The fluence in the 15-150 keV band is 6.81.710-7 erg cm-2. The isotropic energy Eiso would be estimated to be about erg. With the relation between photon index and observational peak energy Epeak,o obtained by simulations (Sakamoto et al. 2009), peak energy Epeak,o in the observational frame could be inferred as KeV. Therefore, this burst would be consistent with the Amati relationship (Amati et al. 2002) as most of long duration GRBs .
2.1 Swift/XRT X-ray Afterglow
The Swift/XRT light curve and spectrum are extracted from the UK Swift Science Data Centre at the University of Leicester (Evans et al. 2009)222http://www.swift.ac.uk/results.shtml. We also fit the X-ray spectrum with the package. The time-integrated X-ray spectrum from all the Photon Counting (PC) mode data after 3 ks-3 s is well fitted by an absorbed power-law model, with a photon power-law index . No significant host excess over the Galactic value is detected. The time-integrated X-ray spectrum after 3 s post the trigger can be fit with a power-law model with a photon power-law index of . The two values agree with each other within error due to large uncertainties, so there is no significant evidence for spectral evolution.
2.2 Optical Afterglow
The 0.8-m Tsinghua University - National Astronomical Observatories Telescope (TNT) is located at Xinglong observatory in China. GRB 090529A was observed by TNT starting from May 29, 14:36:54 (UT), 24.3 min after the burst. A series of (CR) and band images were obtained. This led to the identification of the optical counterpart.
The Maidanak AZT-22 (1.5m) telescope is located at Maidanak Observatory, in south-east of the Republic of Uzbekistan. It observed the optical afterglow of GRB 090529A from 0.15 days to 0.2 days for several times, and a series of images in the band were obtained. The optical counterpart was detected in all the single image.
The 1.34m Schmidt telescope of the Thüringer Landessternwarte Tautenburg (TLS) in Germany, began to observe the optical afterglow at 6.6 hours after the burst. Six dithered band images with an exposure time of 300 s for each single image, and six images in the band with an exposure time of 600 s each, were obtained.
The optical afterglow was observed by the Zeiss-600 telescope (Zeiss-600) of Mt.Terskol observatory in -band filter between May 29 19:40 – 20:20 (UT). The optical counterpart of this burst could be detected in a combined images with a total time exposure of 2400 sec.
The optical afterglow was also observed by MTM-500 telescope of Kislovodsk solar station of the Pulkovo observatory in -band with several series on May 29 between 19:58 – 22:20 (UT). The optical counterpart was detected in combined images.
The 1.5-m OSN telescope carried out -band observations of the GRB 090529A on May 29.87-29.93 UT, 0.27-0.33 days after the GRB. The optical afterglow was detected in the combined image with a total exposure time of 4800 sec.
The Nordic Optical Telescope (NOT), carried out a multiple follow-up observations of GRB 090529A starting 1.29 days after the burst. the multiple follow-up observations up to 6 days post the trigger. Several -band images were obtained. Each of these images has an exposure time of 600 sec. The optical afterglow was well detected in these images.
Data reduction was carried out following standard routines in the IRAF333IRAF is distributed by NOAO, which is operated by AURA, Inc., under cooperative agreement with NSF. package, including bias and flat-field corrections. Point spread function (PSF) photometry was applied via the DAOPHOT task in the IRAF package to obtain the instrumental magnitudes. During the reduction, some frames were combined in order to increase the signal-to-noise ratio (S/N). In the calibration and analysis, the TNT band was treated as the band, because they are similar with each other within uncertainties of 0.07 mag (Xin et al. 2010). TLS images were reduced in a standard fashion and analyzed under MIDAS444http://www.eso.org/sci/software/esomidas/ using seeing-matched aperture photometry. Absolute calibration was performed using the Sloan Digital Sky Survey (SDSS, Adelman-McCarthy et al. 2008), with a conversion of SDSS to the Johnson-Cousins system (Lupton 2005) 555http://www.sdss.org/dr6/algorithms/sdssUBVRITransform.html#Lupton2005. The optical data of GRB 090529A observed by TNT,Maidanak, TLS, Z-600, OSN, and NOT are reported in Table 1. For completeness, the R-band data from GCN Circular 9487 (Balman et al. 2009) is re-calibrated with SDSS reference stars and presented here.
| T-T0(min) | Exposure(sec) | Filter | Magnitude | MagErr | Telescope |
|---|---|---|---|---|---|
| 25.825 | 160 | CR | 19.84 | 0.14 | TNT |
| 29.627 | 240 | CR | 19.92 | 0.12 | TNT |
| 37.230 | 600 | R | 20.05 | 0.12 | TNT |
| 47.843 | 600 | R | 19.98 | 0.11 | TNT |
| 58.427 | 600 | R | 19.99 | 0.11 | TNT |
| 69.025 | 600 | R | 20.18 | 0.11 | TNT |
| 79.610 | 600 | R | 20.47 | 0.13 | TNT |
| 100.368 | 1800 | R | 20.22 | 0.10 | TNT |
| 131.198 | 1800 | R | 20.43 | 0.11 | TNT |
| 162.030 | 1800 | R | 20.64 | 0.14 | TNT |
| 218.548 | 4800 | R | 20.66 | 0.15 | TNT |
| 223.330 | 300 | R | 20.73 | 0.07 | Maidanak |
| 229.795 | 300 | R | 20.70 | 0.05 | Maidanak |
| 235.987 | 300 | R | 20.65 | 0.05 | Maidanak |
| 242.597 | 300 | R | 20.75 | 0.06 | Maidanak |
| 248.083 | 300 | R | 20.59 | 0.05 | Maidanak |
| 253.583 | 300 | R | 20.80 | 0.06 | Maidanak |
| 259.070 | 300 | R | 20.72 | 0.07 | Maidanak |
| 265.420 | 300 | R | 20.76 | 0.06 | Maidanak |
| 270.907 | 300 | R | 20.75 | 0.07 | Maidanak |
| 276.380 | 300 | R | 20.80 | 0.06 | Maidanak |
| 281.880 | 300 | R | 20.72 | 0.06 | Maidanak |
| 287.367 | 300 | R | 20.76 | 0.06 | Maidanak |
| 294.020 | 300 | R | 20.73 | 0.06 | Maidanak |
| 299.505 | 300 | R | 20.76 | 0.06 | Maidanak |
| 347.415 | 2400 | R | 20.94 | 0.23 | Zeiss-600 |
| 405.648 | 3600 | R | 20.70 | 0.25 | MTM-500a |
| 478.656 | 3600 | R | 21.30 | 0.40 | MTM-500a |
| 414.535 | 1800 | Ic | 20.27 | 0.09 | TLS |
| 432.000 | 4800 | R | 21.01 | 0.05 | OSN |
| 438.722 | 600 | Rc | 21.11 | 0.13 | TLS |
| 449.555 | 600 | Rc | 21.13 | 0.13 | TLS |
| 460.372 | 600 | Rc | 21.23 | 0.43 | TLS |
| 596.160 | 900 | R | 20.90 | 0.20 | GCN9485b |
| 663.462 | 1800 | Rc | 21.00 | 0.11 | TLS |
| 1874.800 | 600 | R | 21.81 | 0.05 | NOT |
| 1885.750 | 600 | R | 21.77 | 0.05 | NOT |
| 1896.550 | 600 | R | 21.88 | 0.05 | NOT |
| 4774.000 | 1800 | R | 22.79 | 0.12 | NOT |
| 9145.420 | 1800 | R | 23.06 | 0.20 | NOT |
Note. — : The photometry supersedes result reported in GCN circ. 9611 (Volnova et al. 2009). : This data is derived from the literature (Balman et al. 2009). We re-calibrated its brightness with SDSS reference stars.
3 Analysis and discussion
3.1 Light curves
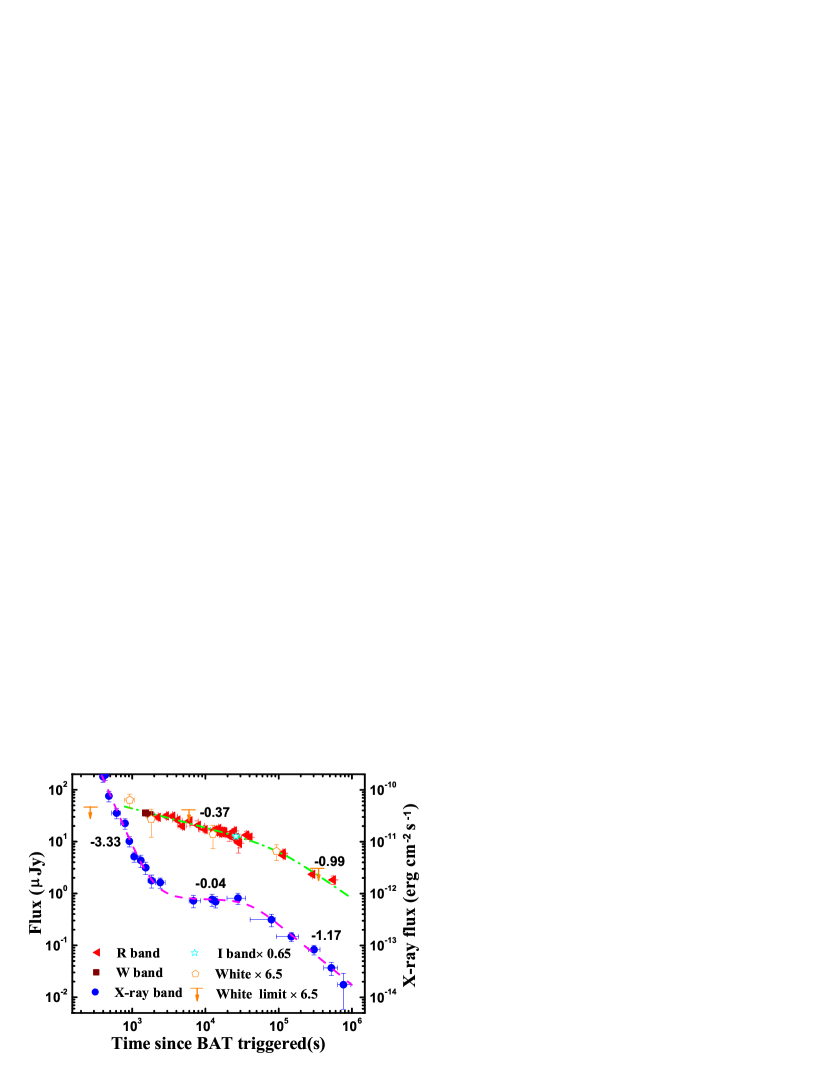
We correct the extinction of our Galaxy (, Schlegel et al.1998), and then plot the optical R-band light curve in Fig. 1. First, we fit the R-band light curve after 1000 sec post the burst with a simple single power law . The temporal slope would be . The reduced is 2.47 with 32 degrees of freedom. We then fit the same data with a smoothly broken power-law model yielding two decaying slopes of and respectively, with a broken time of s. The reduced is 1.08 with 30 degrees of freedom, as shown in Eq. 1. Thus, the smooth broken power-law model is better than the single power-law model to fit the optical light curve.
| (1) |
| Interval | (s) | (fixed) | ||||
|---|---|---|---|---|---|---|
| X-Ray | 7.3962.371∗ | 4009517760 | 0.040.20 | 1.170.17 | 3 | 61/59 |
| Optical | 8.101.27 | 9504223457 | 0.370.03 | 0.990.12 | 3 | 32.48/30 |
Swift UVOT-white band data (Sakamoto et al. 2009b) are also plotted in Fig. 1. In order to compare R-band data with Swift UVOT data, we shift the UVOT white-band data to the flux level of our Johnson R-band data after 1000 sec post burst. We find that the R-band and UVOT light curves trace each other well after 1000 sec. Assuming they also trace each other well before 1000 sec, we could infer the behavior of the R-band light curve before 1000 sec from the properties of the UVOT white-band light curve.
The UVOT data at the early phase shows an upper limit at the first observation, and a positive detection at the second data point. The latter one is apparently brighter than the previous one. Other later data became fainter than the second data for about 0.5 mag, and decayed continuously with a shallow decay slope of 0.3. Just considering the second and the third data of UVOT observations, the decay index between these two measurements is about 1.24, which is not likely to be the emission from reverse shock, like GRB 990123 (Akerlof et al. 1999). The existence of the brightest flux of the second white data point, implies that the onset of the early afterglow or an early optical flare have taken place before the shallow-decay phase. However, owing to the sparse data, the origin of the early UVOT white observations is not clear.
Swift X-ray light curve is also plotted and fitted in the Fig. 1. The X-ray afterglow shows a Swift canonical X-ray light curve with a steep decay during the first observations up to about 3000 sec, and then turning into the shallow-decay phase with a decay index of 0.04, which is followed by a normal decay with a decay slope of 1.17. All these fit parameters are summarized in Table 2.
We note that GRB 090529A was triggered in image mode, and was already ongoing when it cames into the field of view during a pre-planned slew. This means that there was emission prior to the trigger time for at least 50 s. Therefore, might be shifted to an earlier time by at least 50 s relative to the trigger time, which consequently affects the decay slopes of the afterglow emission. However, we have checked that even we shift to 50 s before the trigger time, our fitting results are not affected a lot, since the start time of the shallow-decay phase is much later, about s after the burst.
3.2 Normal-decay phase
In the normal decay phase of the X-ray afterglow, the emission process is usually in the slow-cooling regime. For the case of GRB 090529A, the temporal decay index and spectral index are and , respectively. These values are roughly consistent with the predictions of the external forward shock model for the spectral regime max (Liang et al. 2008). Additionally, the X-ray light curve is steeper than the optical one by . It indicates that the external medium is ISM and during the power-law decay phase. In this regime, the electron energy distribution index could be estimated with the relation of . It is consistent with the typical value () for the electron energy distribution index in GRB model (Curran et al. 2010). However, since the larger uncertainties of decay slopes, the difference between X-ray and optical afterglows of could not be excluded.
3.3 Shallow-decay phase
3.3.1 Spectral index
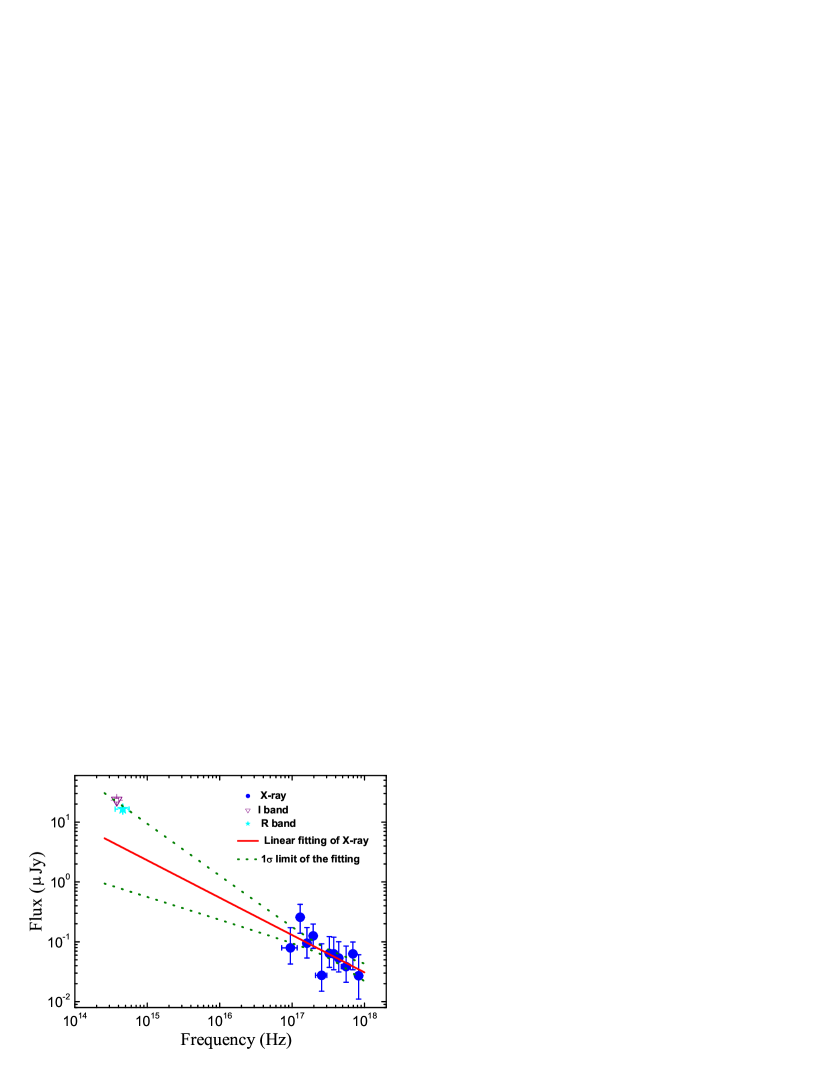
In order to investigate the origin of the shallow-decay segments in both optical and X-ray afterglow, the spectral index from optical to X-ray would be helpful. To obtain the intrinsic optical flux, the extinction caused by our Galaxy in the direction of the bursts corrected for, which is (Schlegel et al.1998), corresponding to mag and . The extinction from the GRB host is not considered here. The extinction-corrected magnitudes are converted into flux densities.
For the -band data, we inter-plot it with the best fitting of those data during this phase. For the -band data, we extra-plot it with the fitting result of -band light curve assuming that the decay indices of light curves in both frequencies are the same in the shallow phase. The time we calculated for the optical bands is about 15 ks after the burst. The X-ray spectrum during the shallow-decay phase with its power-law index and its errors as well as the R-band flux density are plotted in Fig. 2. It is evident that the optical flux is located in the extrapolation of the X-ray spectral index within errors. The optical (R-band) to X-ray spectral index is very similar to the observed X-ray spectral index of . This fact suggests that the extinction from host galaxy could be negligible.
3.3.2 Classical external-shock model?
According to the classical external-shock model (Meszaros, Rees & Wijers 1998; Sari, Piran & Narayan 1998; Sari, Piran & Halpern 1999; Chevalier & Li 2000; Dai & Cheng 2001; Zhang et al. 2006), Optical and X-ray afterglows have closure relations under several conditions. We notice that the optical light curve decays steeper than the X-ray one by about at the shallow-decay phase, this is consistent with the condition of wind-like type medium in the spectral region of . In detail, assuming that the medium has a density distribution of , the decay indices of optical and X-ray emission would have a relation under the condition of no energy injection, (Urata et al. 2007) in the classical external-shock model for the case of . With these parameters ( and ) of GRB 090529A in this phase, we can infer that the density parameters s 2. This is consistent with the theoretical prediction of a wind-type medium (). Therefore, it seems that the environment of shallow-decay phase in both X-ray and optical emissions should be a wind-type medium. However, the requirement of spectral indices between optical and X-ray emission seems not be consistent with the result of Fig.2. A possible solution for this conflict is that the cooling frequency should be marginally above the optical band. But consequently, the optical spectral index would be about according to the relation of . However, it seems in disagreement with the band data point from TLS observation.
3.3.3 Energy injection?
Considering the shallow-decay indices, continuous energy injection (Dai & Lu 1998b; Sari & Mészáros 2000; Nousek et al. 2006; Zhang et al. 2006) might be occuring, in which new energy is injected into the forward shock and forms ”refreshed shocks”, which makes the temporal decay indices shallower. This can be produced either by the long-lasting activity of the central engine, with the transformation of the Poynting flux energy into kinetic energy in the external shock (Dai & Lu 1998b), or by a brief and short-duration central engine activity, which ejects shells with a range of Lorentz factors such that slower ejecta catches up with the decelerated shock (Zhang et al. 2006 and reference therein).
For the first case of Poynting flux energy injection, the injected luminosity is given by (Zhang et al. 2006). Given the closure relationship for and of afterglow in various GRB models (Zhang et al. 2006), and for the measured values of the X-ray afterglow of GRB 090529A, , and , we estimate that the energy injection index is for in a wind medium and the slowing cooling phase. Because the optical frequency should be located at the spectral region , the closure relation via the energy injection would be for the optical band. In this case, the energy-injection parameter q would be for the optical indices of and . The two values of q for both optical and X-ray afterglows are consistent with each other within their uncertainties, implying that the new-formed energy is injected into the forward shock, making the light curve shallower for both X-ray and optical bands simultaneously.
For the second case of a range of the Lorentz factors in the ejecta which follow the form of () (Zhang et al. 2006), with our measured value of (the average value for the optical and X-ray bands), the Lorentz factor index s would be about 7 for the wind model ( Zhang et al. 2006; Nousek et al. 2006). This result corresponds to the total energy in the fireball decreasing as .
It is likely that the simultaneous shallow-decay phase of GRB 090529A in both the X-ray and optical afterglows could be interpreted by energy injection in a wind-type medium via by a long-lasting central-engine activity or a range of Lorentz factors in the eject. Meanwhile, the normal decay phase could be well-explained by the standard forward shock in an ISM medium. Therefore, It seems that the break from the shallow to the normal decay phase may be caused by the cessation of energy injection, and simultaneously, the external medium would also have a transition from a wind-type to constant-density ISM. However it might be unlikely that these two different processes take place at the same time.
3.3.4 Other models
Microphysical parameters evolving. Panaitescu et al. (2006) generalized the formulae of the synchrotron-shock model by including the variations of some physical parameters in the blast wave: the energy injection , the energy ratio for the magnetic field , the energy ratio for electrons , and the ambient medium density . As shown in equations (9) and (10) in Panaitescu et al. (2006), the decay indices for optical and X-ray light curves in the spectral region are derived. A general relationship between and can be expressed by (Urata et al. 2007):
| (2) |
which is independent on p and i, but has some dependence on e and b. Assuming (ISM case), for the case of GRB 090529A, we would get , which requires that at least one of e or b would be negative, which is an unphysical condition. However, if we assume that (wind-type medium), we would get . It means that when new energy is injected into the wind-type medium, the microphysical parameters are not only evolving, but also the energy injection faction and the energy ratio for the magnetic field should have a relationship ( ) to meet the case of GRB 090529A.
Off-axis viewing jet model. Another explanation for the plateau phase is that the afterglow is being observed from viewing angles slightly outside the jet. Depending on the jet structures, dynamics, viewing angle (e.g. Eichler & Granot 2006; Marshall et al. 2011), the light curve can have a long shallow-decay phase at early times or an initial rising phase after the prompt emission. It is generally consistent with the case of GRB 090529A at the early phase, except for the earliest detections of a flare-like or rebrighting-like feature by UVOT. However, the earliest feature might be produced by an additional physical ingredient, like an abrupt energy injection, before the forward shock emission from off-axis jet. Thus, this model is also possible.
Dust scattering model. The dust scattering model was proposed to explain the shallow-decay phase of Swift GRBs (Shao & Dai 2007), like in the optically dark GRB 090417B (Holland et al. 2010). However, one prediction of this model is that the spectral index would be softer by about in the dust-scattering procedure (Shen et al. 2009) across the break from shallow-decay segment to the normal-decay phase. This prediction is not consistent with the case of GRB 090529A. Thus, this model could be excluded.
Photosphere external shock model. Wu & Zhang (2011) recently proposed that the X-ray afterglow is dominated by the photospheric emission of a long-lasting wind, while the optical afterglow is dominated by synchrotron emission of the forward shock. Within this model, if the long-lasting central engine has a break in the luminosity time history (e.g. Dai & Lu 1998b; Zhang & Mészáros 2001), both X-ray and optical lightcurves can show an achromatic break at the time of the central engine break, if the total energy injected from the long-lasting engine exceeds that in the blastwave at early times. This model could interpret the data of GRB 090529A, but it requires that optical and X-ray emissions of this burst should be dominated by totally different processes.
4 Energy budget
Gamma-ray bursts are believed to be produced by ultra-relativistic outflows which are collimated into narrow jets ( see e.g. the review of Granot & Ramirez-Ruiz 2011). A break in the multi-wavelengthes light curves is expected when the Lorentz factor drops below the inverse of the angular width of the jet (Rhoads 1999; Sari,Piran & Halpern 1999). For the case of GRB 090529A, this kind of jet break is not observed as shown in Fig. 1, indicating that the time of a possible jet break should be later than the last observation of X-ray afterglow, sec. Following Sari et al. (1999), the jet half-opening angle for an ISM environment could be estimated: , where z is the redshift, is the break time in days. The is not sensitive to the isotropic energy Eiso. Under an assumption of the typical values: cm-3 and (Gao & Dai 2010), the opening angle of jet should be larger than 6.84 degree. This half-opening angle is larger than those for most of GRBs (Gao & Dai 2010). With the relation of , is estimated to be about 5 ergs.
5 Summary and conclusion
We report the optical observations of GRB 090529A by various ground-based telescopes. The optical light curve shows a shallow-decay phase from sec after the burst with a decay index of about 0.37, which is followed by a ”normal” decay segment starting at about sec after the burst. Before the shallow-decay phase in the optical afterglow, a tentative flare-like event or rebrightening exists at earlier times (2000s) according to the observations of the UVOT instrument. Meanwhile, the X-ray afterglow shows a canonical light curve. The shallow-decay phase in the X-ray afterglow starts at about 3000 sec after the burst, and ends at sec, showing a decay index of about 0.04. The later phase after the break ( s) in both X-ray and optical afterglows could be explained well with the standard forward-shock model without any energy injection in the case of max in an ISM medium. During our observations, no any jet break signature is detected. The time for jet break should be later than the end time of X-ray observations (s), indicating that the half-opening angle of jet is larger than 6.84 degree, and the collimated-corrected energy is about 5erg, making this burst being consistent with the Ghirlanda-relation .
To model the simultaneous shallow-decay phase in both the X-ray and the optical afterglows, energy injection into a wind-type medium are needed, but there is also a constraint of the spectral condition of , which is not well consistent with the observations of optical multi-band observations. Besides, the transition break between the shallow-decay phase and the normal-decay phase should be not only due to the cessation of energy injection, but also correspond to the transition of the external medium density from a wind-type medium to an ISM. However it might be unlikely that these two different processes take place at the same time. Other models, like microphysical parameters evolving and off-axis viewing jet model, are also possible for the shallow-decay phase.
References
- Adelman-McCarthy et al. (2008) Adelman-McCarthy J. K., et al., 2008, ApJS, 175, 297
- Akerlof et al. (1999) Akerlof C., et al., 1999, Nature, 398, 400
- Amati et al. (2002) Amati L., et al., 2002, A&A, 390, 81
- Balman et al. (2009) Balman S., et al, 2009, GCN, 9485, 1
- Band et al. (1993) Band D., et al., 1993, ApJ, 413, 281
- Butler et al. (2007) Butler N. R., Kocevski D., Bloom J. S., Curtis J. L., 2007, ApJ, 671, 656
- Cenko et al. (2011) Cenko S. B., et al., 2011, ApJ, 732, 29
- Chevalier & Li (1999) Chevalier R. A., Li Z.-Y., 1999, ApJ, 520, L29
- Chevalier & Li (2000) Chevalier R. A., Li Z.-Y., 2000, ApJ, 536, 195
- Covino et al. (2008) Covino S., et al., 2008, MNRAS, 388, 347
- Curran et al. (2010) Curran P. A., Evans P. A., de Pasquale M., Page M. J., van der Horst A. J., 2010, ApJ, 716, L135
- Cusumano et al. (2006) Cusumano G., et al., 2006, ApJ, 639, 316
- Dai et al. (2007) Dai X., Halpern J. P., Morgan N. D., Armstrong E., Mirabal N., Haislip J. B., Reichart D. E., Stanek K. Z., 2007, ApJ, 658, 509
- Dai & Lu (1998a) Dai Z. G., Lu T., 1998a, MNRAS, 298, 87
- Dai & Lu (1998b) Dai Z. G., Lu T., 1998b, A&A, 333, L87
- Dai & Lu (1998c) Dai Z. G., Lu T., 1998c, PhRvL, 81, 4301
- Dai & Cheng (2001) Dai Z. G., Cheng K. S., 2001, ApJ, 558, L109
- de Ugarte Postigo et al. (2005) de Ugarte Postigo A., et al., 2005, A&A, 443, 841
- de Ugarte Postigo et al. (2007) de Ugarte Postigo A., et al., 2007, A&A, 462, L57
- Eichler & Granot (2006) Eichler D., Granot J., 2006, ApJ, 641, L5
- Evans et al. (2009) Evans P. A., et al., 2009, MNRAS, 397, 1177
- Fan & Xu (2006) Fan Y.-Z., Xu D., 2006, MNRAS, 372, L19
- Gao & Dai (2010) Gao Y., Dai Z.-G., 2010, RAA, 10, 142
- Gehrels et al. (2004) Gehrels N., et al., 2004, ApJ, 611, 1005
- Ghirlanda et al. (2004) Ghirlanda G., Ghisellini G., Lazzati D., ApJ, 616, 331
- Granot et al. (2002) Granot J., Panaitescu A., Kumar P., Woosley S. E., 2002, ApJ, 570, L61
- Granot (2006) Granot J., 2006, NCimB, 121, 1073
- Granot, Königl, & Piran (2006) Granot J., Königl A., Piran T., 2006, MNRAS, 370, 1946
- Granot & Ramirez-Ruiz (2010) Granot J., Ramirez-Ruiz E., 2010, arXiv1012.5101G
- Grupe et al. (2007) Grupe D., et al., 2007, ApJ, 662, 443
- Thöne et al. (2010) Thöne C. C., et al., 2010, A&A, 523, A70
- Holland et al. (2010) Holland S. T., et al., 2010, ApJ, 717, 223
- Kann, Laux, & Stecklum (2009) Kann D. A., Laux U., Stecklum B., 2009, GCN, 9436, 1
- Kouveliotou et al. (1993) Kouveliotou C., Meegan C. A., Fishman G. J., Bhat N. P., Briggs M. S., Koshut T. M., Paciesas W. S., Pendleton G. N., 1993, ApJ, 413, L101
- Liang et al. (2008) Liang E.-W., Racusin J. L., Zhang B., Zhang B.-B., Burrows D. N., 2008, ApJ, 675, 528
- Liang et al. (2010) Liang E.-W., Yi S.-X., Zhang J., Lü H.-J., Zhang B.-B., Zhang B., 2010, ApJ, 725, 2209
- Liang, Zhang, & Zhang (2007) Liang E.-W., Zhang B.-B., Zhang B., 2007, ApJ, 670, 565
- Lipkin et al. (2004) Lipkin Y. M., et al., 2004, ApJ, 606, 381
- Lupton et al. (2005) Lupton R. H., et al., 2005, AAS, 37, #133.08
- Malesani et al. (2009) Malesani D., Fynbo J. P. U., D’Elia V., de Ugarte Postigo A., Jakobsson P., Thoene C. C., 2009, GCN, 9457, 1
- Markwardt et al. (2009) Markwardt C. B., et al., 2009, GCN, 9434, 1
- Marshall et al. (2011) Marshall F. E., et al., 2011, ApJ, 727, 132
- Mason et al. (2006) Mason K. O., et al., 2006, ApJ, 639, 311
- Meszaros, Rees, & Wijers (1998) Meszaros P., Rees M. J., Wijers R. A. M. J., 1998, ApJ, 499, 301
- Monfardini et al. (2006) Monfardini A., et al., 2006, ApJ, 648, 1125
- Nousek et al. (2006) Nousek J. A., et al., 2006, ApJ, 642, 389
- Paczyński (1998) Paczyński B.,1998, American Institute of Physics Conference Series, 428, 783
- Page et al. (2007) Page K. L., et al., 2007, ApJ, 663, 1125
- Panaitescu et al. (2006) Panaitescu A., Mészáros P., Burrows D., Nousek J., Gehrels N., O’Brien P., Willingale R., 2006, MNRAS, 369, 2059
- Rau et al. (2010) Rau A., et al., 2010, ApJ, 720, 862
- Rhoads (1999) Rhoads J. E., 1999, ApJ, 525, 737
- Sakamoto et al. (2009) Sakamoto T., et al., 2009a, GCN, 9430, 1
- Sakamoto et al. (2009) Sakamoto T.,Krimm, H. A., Sbarufatti, B., Schady, P., 2009b, GCN Report, 225, 1
- Sari, Piran, & Narayan (1998) Sari R., Piran T., Narayan R., 1998, ApJ, 497, L17
- Sari et al. (1999) Sari R., Piran T., Halpern J. P., 1999, ApJ, 519,L17
- Sari & Mészáros (2000) Sari R., c P., 2000, ApJ, 535, L33
- Schady et al. (2009) Schady P., Sakamoto T., Holland S. T., Marshall F. E., 2009, GCN, 9435, 1
- Schlegel, Finkbeiner, & Davis (1998) Schlegel D. J., Finkbeiner D. P., Davis M., 1998, ApJ, 500, 525
- Shao & Dai (2007) Shao L., Dai Z. G., 2007, ApJ, 660, 1319
- Shen et al. (2009) Shen R.-F., Willingale R., Kumar P., O’Brien P. T., Evans P. A., 2009, MNRAS, 393, 598
- Updike et al. (2008) Updike A. C., et al., 2008, ApJ, 685, 361
- Urata et al. (2007) Urata Y., et al., 2007, ApJ, 668, L95
- Volnova et al. (2009) Volnova A., et al, 2009, GCN, 9611, 1
- Woźniak et al. (2006) Woźniak P. R., Vestrand W. T., Wren J. A., White R. R., Evans S. M., Casperson D., 2006, ApJ, 642, L99
- Wu et al. (2011) Wu, X. F. & Zhang, B. 2011, ApJ, submitted
- Xin et al. (2010) Xin L. P., et al., 2010, MNRAS, 401, 2005
- Xu, Huang, & Lu (2009) Xu M., Huang Y.-F., Lu T., 2009, RAA, 9, 1317
- Yamazaki (2009) Yamazaki R., 2009, ApJ, 690, L118
- Bing (2001) Zhang, B. & Mészáros, P. 2001, ApJ, 552, L35
- Zhang et al. (2006) Zhang B., Fan Y. Z., Dyks J., Kobayashi S., Mészáros P., Burrows D. N., Nousek J. A., Gehrels N., 2006, ApJ, 642, 354
- Zhang et al. (2007) Zhang B., et al., 2007, ApJ, 655, 989
- Zhang et al. (2009) Zhang B., et al., 2009, ApJ, 703, 1696
- Zheng et al. (2008) Zheng W.-K., et al., 2008, ChJAA, 8, 693