The contribution of starbursts and normal galaxies to infrared luminosity functions at 2
Abstract
We present a parameterless approach to predict the shape of the infrared (IR) luminosity function (LF) at redshifts 2. It requires no tuning and relies on only three observables: (1) the redshift evolution of the stellar mass function for star-forming galaxies, (2) the evolution of the specific star formation rate (sSFR) of main-sequence galaxies, and (3) the double-Gaussian decomposition of the sSFR distribution at fixed stellar mass into a contribution (assumed redshift- and mass-invariant) from main-sequence and starburst activity.
This self-consistent and simple framework provides a powerful tool for predicting cosmological observables: observed IR LFs are successfully matched at all 2, suggesting a constant or only weakly redshift-dependent contribution (8%–14%) of starbursts to the star formation rate density. We separate the contributions of main-sequence and starburst activity to the global IR LF at all redshifts. The luminosity threshold above which the starburst component dominates the IR LF rises from log(/) = 11.4 to 12.8 over 0 2, reflecting our assumed (1+)2.8-evolution of sSFR in main-sequence galaxies.
Subject headings:
cosmology: observations – galaxies: evolution – galaxies: luminosity function, mass function – galaxies: starburst – surveys1. Introduction
Determining the galaxy stellar mass function (MF) and the star formation rate (SFR) distributions – e.g. the infrared (IR) luminosity function (LF) – is among the foremost goals of extragalactic surveys targeting (and linking) nearby (e.g. Bell et al. 2003, Baldry et al. 2011, Sanders et al. 2003, Goto et al. 2011, Bothwell et al. 2011) and distant galaxies (e.g., Bell et al. 2007, Ilbert et al. 2010, Le Floc’h et al. 2005, Magnelli et al. 2011, Rodighiero et al. 2010). The question whether the joint evolution of MFs and IR LFs is self-consistent has received comparatively little attention, excepting studies confronting stellar MFs at 3–5 with the integrated, higher-redshift star formation (SF) history (e.g., Wilkins et al. 2008, Le Borgne et al. 2009). The common link between the stellar mass () and SFR of galaxies is the specific star formation rate (sSFR). Star-forming galaxies (SFGs) at both high and low redshifts obey a tight relation (dispersion 0.3 dex) – the “galaxy main sequence” – according to which sSFR is a constant or slowly decreasing function of (e.g., Brinchmann et al. 2004, Daddi et al. 2007, Elbaz et al. 2007, 2011, Noeske et al. 2007, Damen et al. 2009, Pannella et al. 2009, Karim et al. 2011). SFGs on the main sequence are complemented by “starbursting” galaxies (a few percent of the total population; e.g., Rodighiero et al. 2011) with highly elevated sSFRs. Differences between the shape of the IR spectral energy distribution (SED; Elbaz et al. 2011) of these two kinds of systems and the different efficiency with which they convert molecular gas to stars (Daddi et al. 2010b, Genzel et al. 2010) have given rise to the notion of “bimodal” star formation.
The stellar MF of SFGs is well-fitted by a Schechter function (e.g., Bell et al. 2007, Ilbert et al. 2010), whereas the IR LF (used here as proxy for the SFR distribution) is generally parameterized as a double-exponential (e.g., Le Floc’h et al. 2005) or double-power-law function (e.g., Magnelli et al. 2009). A possible astrophysical origin of this difference is the occurrence of burst-like and “normal” (main-sequence-like) SF activity among SFGs. The evolving shape of IR LFs hence implicitly contains information on the relative importance of the two modes of SF in the past (e.g., Franceschini et al. 2001, Béthermin et al. 2011).
In this Letter, we show how the contribution of main-sequence and starburst galaxies to IR LFs at 2 can be predicted (Section 3) using a simple scheme relying on basic observables (the evolution of sSFR in main-sequence galaxies and the sSFR distribution at fixed ; see Section 2) and starting from the evolution of the stellar MF of SFGs.
2. (s)SFR and ; basic characterization of star-forming galaxies
2.1. Stellar Mass Functions and Main-sequence Evolution at 2
Schechter function fits to the stellar MF of SFGs vary with sample selection (e.g. the color cut adopted to separate blue from red galaxies; Baldry et al. 2011) and the comparison of different measurements is additionally complicated by covariance among Schechter parameters. Nevertheless, the general consensus in the literature is that, for SFGs, the low-mass end slope and characteristic mass change little at 0 2, while the normalization is roughly constant out to 1, followed by a 3-fold drop over 1 2 (e.g., Bell et al. 2007, Pozzetti et al. 2010, Brammer et al. 2011).
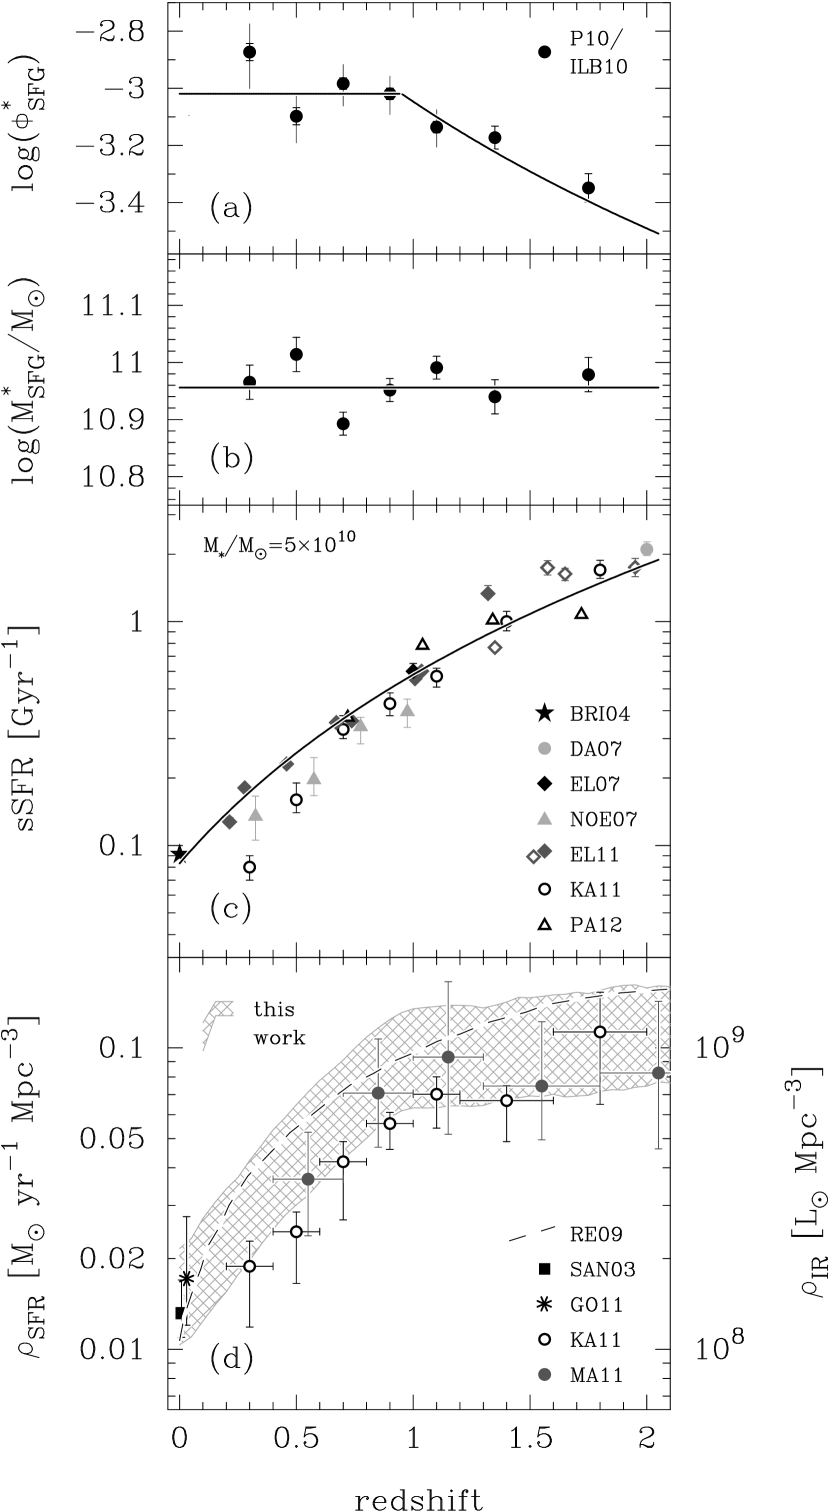
In the following we will use the fits by Peng et al. (2010) of the MFs in Ilbert et al. (2010) which include both sources with intermediate and high SF activity (i.e. should encompass the entire star-forming population). Assuming a fixed = -1.3, the error-weighted, mean characteristic mass at 2 is log(/) = 10.960.01 (Fig. 1.b111All data were converted to a WMAP-7 cosmology (Larson et al. 2011) with ( [km s-1 Mpc-1], , ) = (70.4, 0.273, 0.727) and a Chabrier (2003) IMF.). Density fluctuations in the COSMOS field at intermediate redshift (e.g. 0.3) cause significant scatter among measurements at 1. For simplicity we adopt a constant average of log() = -3.020.01 which is consistent with all data below 1 if both measurement and cosmic variance errors are accounted for (Fig. 1.a). After 1, decreases as (1+).
Fig. 1.c shows the redshift evolution of the sSFR of SFGs with 51010. This evolution is well documented in recent literature on the SF main sequence at 2. Here we use results based on a combination of mid-IR and UV data (Daddi et al. 2007, Elbaz et al. 2007, Noeske et al. 2007), far-IR data (Elbaz et al. 2011; M. Pannella et al. 2012, in preparation) and radio continuum imaging (Karim et al. 2011). Error bars denote the uncertainty on the average sSFR() rather than intrinsic scatter (generally 0.3 dex); they hence are often masked by the plotting symbols. The sSFR-measurements at 0 define a tight trend that is well-fitted by a power law (1+)2.8±0.1 (equivalent to eq. 13 in Elbaz et al. 2011) and which, furthermore, accurately connects to the = 0 measurement of Elbaz et al. (2007; underlying data from ). As a slight exception to the generally excellent agreement between the (1+)2.8-evolution and observations, the sSFR measurements of Noeske et al. (2007) are offset to lower sSFRs by about 1.5 – possibly due to their shallow mid-IR data which might also be responsible for the steeper decline of sSFR with these authors find – but seem to follow the same evolutionary slope. The sample of Karim et al. (2011) is identical to the one used to compute the MF of panels (a) and (b). As explicitly discussed by these authors, the evolution and slope/normalization of the sSFR versus relation are selection-dependent; the lower sSFRs they find at 0.5 thus reflect the growing importance of the “intermediate”-activity population at low redshift.
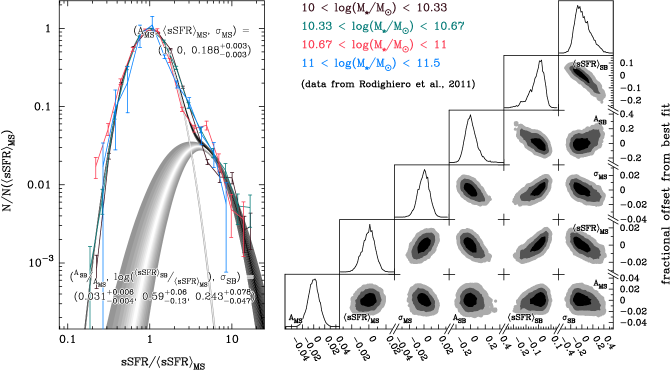
Right: double-Gaussian parameter covariance; light grey, dark grey, and black areas extend to the 3, 2 and 1 confidence contours. Offsets are parametrized in fractions of the preferred value (X {MS, SB}): amplitudes – linear; peak position and width – logarithmic. Panels along upper edge show the MCMC output distributions.
Note: in the journal Fig. 2 presents a reduced version of this plot to comply with ApJL panel restrictions.
2.2. Decomposition into Main-sequence and Starburst Contribution
Using a combination of BzK- and Herschel/PACS-selected SFGs at 1.5 2.5 from the COSMOS and GOODS fields, Rodighiero et al. (2011) showed that the sSFR-distribution of galaxies at fixed tapers out into a broad tail of starbursting galaxies beyond the SF main sequence (sSFRs of these starbursts may exceed main-sequence values more than 10-fold). By imposing a hard sSFR-cut above which SFGs are considered “starbursts”, Rodighiero et al. (2011) estimated that merely 2% of massive ( 1010) galaxies have a burst-like nature and contribute 10% to the SFR-density (SFRD). We now decompose the sSFR distributions of Rodighiero et al. (2011) into two Gaussian components (subsequently identified as main-sequence and burst-like SF activity, respectively):
The physical motivation behind this approach is that, e.g., galaxy interactions need not strongly boost SF (e.g. Di Matteo et al. 2007), and that – at fixed – it thus appears more natural if the importance of burst-like SF activity successively grows with increasing (s)SFR. We interpret the double-Gaussian shape as follows: individual SFGs are “hybrid” objects harboring both main-sequence and burst-mode SF activity in relative proportions that vary according to their sSFR. SFGs well offset from the locus where the main-sequence and starburst Gaussian have equal amplitudes are increasingly dominated by only one mode of SF.
In their analysis, Rodighiero et al. (2011; see their Fig. 2) find that the distributions of sSFR at 1.5 2.5 in four stellar mass bins spanning 10 log() 11.5 are self-similar, albeit displaced in sSFR according to (implying a slope of 0.79 for the main sequence in the SFR versus plane) and with different amplitudes that reflect the shape of the MF. This self-similarity yields much better constraints on the free parameters of the double-Gaussian decomposition than could be obtained by decomposing stellar mass bins individually. Having re-scaled the data of Rodighiero et al. (2011) to a common reference frame (see Fig. 2, left), we estimated the six free parameters describing our double-Gaussian distribution with a Monte Carlo Markov Chain (MCMC; 106 realizations). We provide best-fit parameters of a normalized222The direct fit for, e.g., galaxies at = 2 with 10.33 log(/) 10.66 gives (, , ) = (2.2 Mpc-3 dex-1, 0.893 Gyr-1, 0.243 dex) and (, , ) = (70.01.4, 0.303, 0.1880.003) in identical units. Errors quoted are 95% confidence limits. distribution (amplitude/position of the starburst Gaussian are expressed relative to the main-sequence Gaussian) in Fig. 2. The posterior probability distributions of the individual parameters are well behaved (viz., unimodal) but subject to some covariance, especially among the parameters of the starburst component (cf. Fig. 2, right).
With our double-Gaussian decomposition of the (s)SFR distribution, we obtain a modified estimate of the contribution of starburst activity to the SFRD at 2 of 14.2% (68% confidence limits) as opposed to Rodighiero et al. (2011) who find 10% when considering only sources with sSFR/ 4. We do not update the computation of the number density of starbursts in Rodighiero et al. (2011) because galaxies below their sSFR-threshold are likely hybrid sources where normal and burst-like SF coexist.
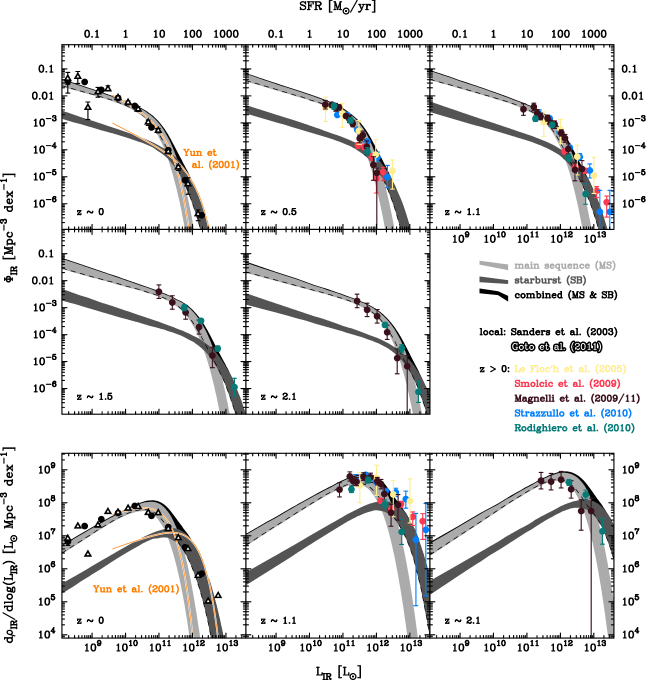
Bottom: predicted IR luminosity density distributions.
3. Results
To construct IR (8-1000 m) LFs for the interval 2 we make two assumptions: (1) the double-Gaussian decomposition of Fig. 2, performed for galaxies at 2, remains valid at all 2, implying an unchanged contribution to the SFRD of normal and burst-like SF activity; (2) the slope of the main sequence (measured to be 0.79) and the double-Gaussian decomposition do not change at masses below those studied by Rodighiero et al. (2011). The comparison of predicted IR LFs with observations will reveal whether these simplifications are justified. We also assume that low-sSFR outliers to the main sequence do not contribute significantly (e.g. Salmi et al. 2012) to the IR LF. Although little is known about the low-sSFR tail of the distributions in Fig. 2, this simplification seems justified as most of these sources are passive galaxies undergoing little obscured SF.
The mapping of the stellar MF to an IR LF is effectively a convolution of the MF and a variable double-Gaussian kernel with (1) normalization fixed by the shape of the MF and (2) main-sequence peak position that – given the redshift – is uniquely determined by the position of the SF main sequence in the (s)SFR versus plane. Thanks to our starburst vs. main-sequence decomposition, we can then also identify the individual contribution of normal and burst-like SF activity to the IR LF.
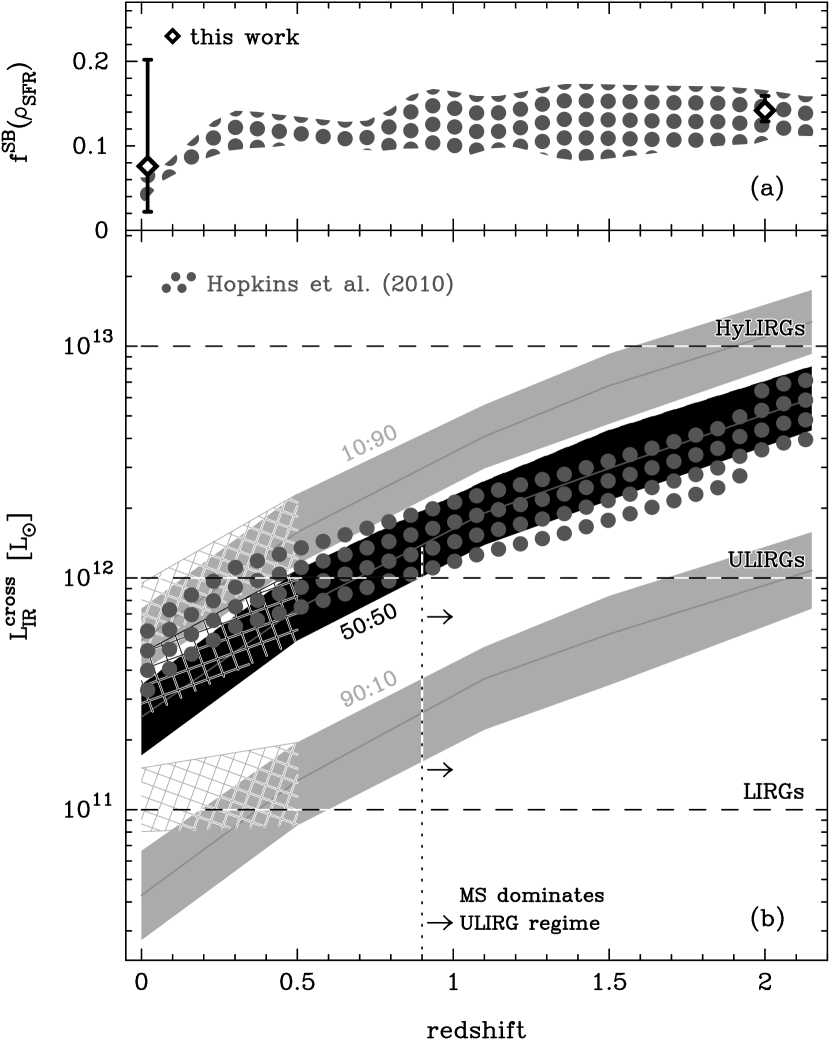
(b): Redshift evolution of the cross-over luminosity for equal contributions of normal and burst-like star formation to IR LFs (black; 68% confidence region highlighted). Light grey curves: luminosities at which main-sequence activity contributes 90% (10%) to the global IR LF. Hatched branches: low-redshift evolution assuming the best-fit , = 0) = 7.6% of panel (a). Main-sequence star formation dominates the ULIRG regime at 0.9 (dotted vertical line).
Fig. 3 shows our predicted IR LFs (see also Table 1) and luminosity density distributions for five redshift bins spanning 0 2.1. The starburst component (dark grey) has a reduced amplitude and is shifted to higher luminosities than the main-sequence contribution (light grey). We compare our prediction with measurements of the 0 IR LFs of Le Floc’h et al. (2005) and Rodighiero et al. (2010), both based on Spitzer/MIPS 24 m photometry. We also plot the LF of Magnelli et al. (2011) who combine MIPS 24 and 70 m data333The Herschel/PACS-based IR LFs in Gruppioni et al. (2010) are consistent with Spitzer studies. We refrain from overplotting their LFs because they do not help constrain the starburst contribution.. The 1.4 GHz LFs for (color-selected) SFGs in Smolčić et al. (2009) and Strazzullo et al. (2010) have been converted to by applying the IR-radio relation which holds out to at least 2 (see Sargent et al. 2010; for a corresponding analysis conducted on the sample of Smolčić et al. 2009). These observations closely agree with our predicted IR LF. At high luminosities a marginally significant excess is observed for some data points from Le Floc’h et al. (2005), Smolčić et al. (2009) and Strazzullo et al. (2010), likely caused by residual contamination from active galactic nucleus (AGN) related processes that affect mid-IR and radio continuum fluxes more than far-IR emission. Note that our “model” IR LFs deliberately include the contribution to the SFRD from SF activity in AGN hosts.
We emphasize that our formalism is “anchored” to 2 where the double-Gaussian decomposition is directly constrained by the data of Rodighiero et al. (2011). A more stringent test is whether the local IR LF can be correctly reproduced if our framework is left to evolve to = 0. In this respect, the agreement of our predicted 0 IR LF with the local IR LFs of Sanders et al. (2003) and Goto et al. (2011) far up the faint-end slope is encouraging and indicates that the simplifying assumptions noted at the beginning of this section (i.e. invariance of the decomposition with redshift and stellar mass) are legitimate. At the faint end, our LF rises as -1.4, in broad agreement with, e.g., the recent measurement of the faint-end slope (Schechter = -1.510.08) of the SFR distribution of Bothwell et al. (2011). The exact we predict depends on the slope of the sSFR- relation and the inclusion of low-sSFR outliers (neglected here) to the main sequence could also cause some additional steepening. At bright our split of the 0 LF matches an earlier double-Schechter decomposition of the local IRAS LF into a “spiral galaxy” and starburst component by Yun et al. (2001; plotted in orange in Fig. 3 over the luminosity range for which their decomposition fits their IRAS data).
Finally we plot (Fig. 1.d; hatched area) our evolutionary prediction for the SFR-density () – obtained by integrating the LFs of Fig. 3 – which is consistent with literature data. The cosmic SF history has been traced by countless studies, of which we show two recent analyses relying on extinction-free tracers of SFR (Karim et al. 2011, radio continuum; Magnelli et al. 2011, far-IR emission), plus the evolution inferred from extinction-corrected UV data in Reddy & Steidel (2009).
4. Discussion
By performing a double-Gaussian fit (Fig. 2) to the distribution of (s)SFR at fixed reported in Rodighiero et al. (2011), we have re-estimated the starburst contribution (14.2%) to the SFRD at 2. We then introduce a self-consistent framework which successfully predicts the evolution of IR LFs at all 2. This approach improves over the conceptually similar analysis of Bell et al. (2007) by quantifying the relative importance of main-sequence and burst-like SF since 2. The bimodal nature of our LF model – tabulated in Table 1 for reference – defines a cross-over IR-luminosity () above which starburst activity dominates over “quiescent” (main-sequence) SF activity. In Fig. 4.b we illustrate the evolution of from log(/) = 11.4 to 12.8 at 0 2, as well as similar thresholds (separated by approx. one decade of ) where main-sequence and starburst activity contributes 90% (10%) to the total IR LF. These thresholds evolve in parallel by a factor (1+)2.8 if we assume a redshift-invariant starburst fraction and a constant slope of the main sequence in the (s)SFR versus plane, i.e. in our framework the luminosity evolution of the SFR-distribution reflects the cosmic evolution of sSFR in main-sequence galaxies. Similarly, the density scale at mirrors the density evolution of the MF of SFGs.
We reproduce the well-known fact that most local ULIRGs are starbursts (e.g., Sanders & Mirabel 1996). At 0.9 the majority of ULIRGs are main-sequence galaxies. Importantly, however, their high SFR (100 ) is not triggered by merging as in most local ULIRGs but is a secular process linked to large gas reservoirs in these high-redshift disks (e.g., Daddi et al. 2010a, Tacconi et al. 2010). Local and distant ULIRGs are intrinsically different objects for which direct comparisons should be avoided; the selection of galaxy populations by is problematic since any conclusion will depend on the redshift-range considered.
It is natural to link starbursts to merging activity even though not all high-sSFR outliers display unmistakable signs of galaxy-galaxy interactions (e.g., Kartaltepe et al. 2011). The fact that the evolution of the IR LF is compatible with a universal starburst fraction is surprising since merger rates are expected to decrease with cosmic time (e.g., Kitzbichler & White 2008). Some cosmological hydrodynamic simulations (e.g., Hopkins et al. 2010) predict an increase of the merger-induced, burst-like contribution to the SFRD from a few percent locally to 12% (Fig. 4.a), in apparent contradiction to the approach adopted here. If one leaves the relative amplitudes of starburst and main-sequence Gaussian distributions free to vary in the fit of the local IR LF, a starburst contribution = 7.6% (68% confidence limits) to the local SFRD is derived. This value lies between the prediction of Hopkins et al. (2010) and the observationally estimated 15%-20% in, e.g., Brinchmann et al. (2004) or Kennicutt et al. (2005) and is also consistent with non-evolution out to = 2. By drawing random pairs of at = 0 and 2 from within the error distributions of our measurements we were nevertheless able to determine that there is a 75% probability that increases out to = 2. Generally speaking, the good match between our predicted and the observed LFs suggests that variations of starburst fraction with mass, as well as the neglected contribution of low-sSFR outliers to the main sequence do not strongly influence the shape of the IR LF.
The success of this simple picture at 2 motivates an extension to higher redshift using the known evolution of the sSFR (e.g. González et al. 2010) and provides a powerful framework for the prediction of cosmological observables, e.g. the evolution of molecular gas reservoirs in normal and starburst galaxies (M. T. Sargent et al. 2012, in preparation) or source counts in the IR, making use of the distinctly different SED for main-sequence and starburst galaxies (M. Béthermin et al. 2012, in preparation).
References
- Baldry et al. (2011) Baldry, I. K., Driver, S. P., Loveday, J., et al. 2011, arXiv:1111.5707
- Bell et al. (2003) Bell, E. F., McIntosh, D. H., Katz, N., & Weinberg, M. D. 2003, ApJ, 585, L117
- Bell et al. (2007) Bell, E. F., Zheng, X. Z., Papovich, C., et al. 2007, ApJ, 663, 834
- Béthermin et al. (2011) Béthermin, M., Dole, H., Lagache, G., Le Borgne, D., & Penin, A. 2011, A&A, 529, A4
- Bothwell et al. (2011) Bothwell, M. S., Kenicutt, R. C., Johnson, B. D., et al. 2011, MNRAS, 415, 1815
- Brammer et al. (2011) Brammer, G. B., Whitaker, K. E., van Dokkum, P. G., et al. 2011, ApJ, 739, 24
- Brinchmann et al. (2004) Brinchmann, J., Charlot, S., White, S. D. M., et al. 2004, MNRAS, 351, 1151 (BRI04)
- Chabrier (2003) Chabrier, G. 2003, PASP, 115, 763
- Daddi et al. (2007) Daddi, E., et al. 2007, ApJ, 670, 156 (DA07)
- Daddi et al. (2010a) Daddi, E., et al. 2010a, ApJ, 713, 686
- Daddi et al. (2010b) Daddi, E., et al. 2010b, ApJ, 714, L118
- Damen et al. (2009) Damen, M., Labbé, I., Franx, M., et al. 2009, ApJ, 690, 937
- Di Matteo et al. (2007) Di Matteo, P., Combes, F., Melchior, A.-L., & Semelin, B. 2007, A&A, 468, 61
- Elbaz et al. (2007) Elbaz, D., et al. 2007, A&A, 468, 33 (EL07)
- Elbaz et al. (2011) Elbaz, D., Dickinson, M., Hwang, H. S., et al. 2011, A&A, 533, A119 (EL11)
- Franceschini et al. (2001) Franceschini, A., Aussel, H., Cesarsky, C. J., Elbaz, D., & Fadda, D. 2001, A&A, 378, 1
- Genzel et al. (2010) Genzel, R., et al. 2010, MNRAS, 407, 2091
- González et al. (2010) González, V., Labbé, I., Bouwens, R. J., et al. 2010, ApJ, 713, 115
- Goto et al. (2011) Goto, T., Arnouts, S., Inami, H., et al. 2011, MNRAS, 410, 573 (GO11)
- Gruppioni et al. (2010) Gruppioni, C., Pozzi, F., Andreani, P., et al. 2010, A&A, 518, L27
- Hopkins et al. (2010) Hopkins, P. F., Younger, J. D., Hayward, C. C., Narayanan, D., & Hernquist, L. 2010, MNRAS, 402, 1693
- Ilbert et al. (2010) Ilbert, O., Salvato, M., Le Floc’h, E., et al. 2010, ApJ, 709, 644 (ILB10)
- Karim et al. (2011) Karim, A., et al. 2011, ApJ, 730, 61 (KA11)
- Kartaltepe et al. (2011) Kartaltepe, J. S., Dickinson, M., Alexander, D. M., et al. 2011, arXiv:1110.4057
- Kennicutt (1998) Kennicutt, R. C., Jr. 1998, ARA&A, 36, 189
- Kennicutt et al. (2005) Kennicutt, R. C., Lee, J. C., Akiyama, S., Funes, J. G., & Sakai, S. 2005, in AIP Conf. Proc. 783, The Evolution of Starbursts (Melville, NY: AIP), 3
- Kitzbichler & White (2008) Kitzbichler, M. G., & White, S. D. M. 2008, MNRAS, 391, 1489
- Larson et al. (2011) Larson, D., Dunkley, J., Hinshaw, G., et al. 2011, ApJS, 192, 16
- Le Borgne et al. (2009) Le Borgne, D., Elbaz, D., Ocvirk, P., & Pichon, C. 2009, A&A, 504, 727
- Le Floc’h et al. (2005) Le Floc’h, E., et al. 2005, ApJ, 632, 169
- Magnelli et al. (2009) Magnelli, B., Elbaz, D., Chary, R. R., Dickinson, M., Le Borgne, D., Frayer, D. T., & Willmer, C. N. A. 2009, A&A, 496, 57
- Magnelli et al. (2011) Magnelli, B., Elbaz, D., Chary, R. R., Dickinson, M., Le Borgne, D., Frayer, D. T., & Willmer, C. N. A. 2011, A&A, 528, A35 (MA11)
- Noeske et al. (2007) Noeske, K. G., Weiner, B. J., Faber, S. M., et al. 2007, ApJ, 660, L43 (NOE07)
- Pannella et al. (2009) Pannella, M., Carilli, C. L., Daddi, E., et al. 2009, ApJ, 698, L116
- Pannella et al. (2012) Pannella, M., et al. 2012, in prep. (PA12)
- Peng et al. (2010) Peng, Y.-J., Lilly, S. J., Kovač, K., et al. 2010, ApJ, 721, 193 (P10)
- Pozzetti et al. (2010) Pozzetti, L., Bolzonella, M., Zucca, E., et al. 2010, A&A, 523, A13
- Reddy & Steidel (2009) Reddy, N. A., & Steidel, C. C. 2009, ApJ, 692, 778 (RE09)
- Rodighiero et al. (2010) Rodighiero, G., et al. 2010, A&A, 515, A8
- Rodighiero et al. (2011) Rodighiero, G., Daddi, E., Baronchelli, I., et al. 2011, ApJ, 739, L40
- Salmi et al. (2012) Salmi, F., Daddi, E., Elbaz, D., et al. 2012, ApJ, submitted
- Sanders & Mirabel (1996) Sanders, D. B., & Mirabel, I. F. 1996, ARA&A, 34, 749
- Sanders et al. (2003) Sanders, D. B., Mazzarella, J. M., Kim, D.-C., Surace, J. A., & Soifer, B. T. 2003, AJ, 126, 1607 (SAN03)
- Sargent et al. (2010) Sargent, M. T., Schinnerer, E., Murphy, E., et al. 2010, ApJ, 714, L190
- Scoville et al. (2007) Scoville, N., Aussel, H., Benson, A., et al. 2007, ApJS, 172, 150
- Smolčić et al. (2009) Smolčić, V., et al. 2009, ApJ, 690, 610
- Strazzullo et al. (2010) Strazzullo, V., Pannella, M., Owen, F. N., et al. 2010, ApJ, 714, 1305
- Tacconi et al. (2010) Tacconi, L. J., et al. 2010, Nature, 463, 781
- Wilkins et al. (2008) Wilkins, S. M., Trentham, N., & Hopkins, A. M. 2008, MNRAS, 385, 687
- Yun et al. (2001) Yun, M. S., Reddy, N. A., & Condon, J. J. 2001, ApJ, 554, 80
| log() | log( [Mpc-3 dex-1]) | log() | log() |
|---|---|---|---|
| 8.10 | -1.22 | -1.26 | -2.40 |
| 8.20 | -1.26 | -1.30 | -2.44 |
| 8.30 | -1.30 | -1.33 | -2.47 |
| 8.40 | -1.34 | -1.36 | -2.51 |
| 8.50 | -1.37 | -1.40 | -2.55 |
| 8.60 | -1.41 | -1.43 | -2.59 |
| 8.70 | -1.45 | -1.47 | -2.63 |
| 8.80 | -1.48 | -1.51 | -2.67 |
| 8.90 | -1.52 | -1.55 | -2.70 |
| 9.00 | -1.56 | -1.59 | -2.74 |
| 9.10 | -1.60 | -1.63 | -2.78 |
| 9.20 | -1.63 | -1.67 | -2.82 |
| 9.30 | -1.67 | -1.71 | -2.85 |
| 9.40 | -1.71 | -1.75 | -2.89 |
| 9.50 | -1.75 | -1.79 | -2.93 |
| 9.60 | -1.79 | -1.82 | -2.97 |
| 9.70 | -1.83 | -1.86 | -3.01 |
| 9.80 | -1.87 | -1.90 | -3.05 |
| 9.90 | -1.90 | -1.94 | -3.08 |
| 10.00 | -1.94 | -1.98 | -3.12 |
| 10.10 | -1.98 | -2.01 | -3.15 |
| 10.20 | -2.02 | -2.05 | -3.19 |
| 10.30 | -2.06 | -2.09 | -3.23 |
| 10.40 | -2.10 | -2.13 | -3.27 |
| 10.50 | -2.15 | -2.18 | -3.31 |
| 10.60 | -2.18 | -2.22 | -3.35 |
| 10.70 | -2.22 | -2.26 | -3.39 |
| 10.80 | -2.27 | -2.30 | -3.43 |
| 10.90 | -2.32 | -2.36 | -3.47 |
| 11.00 | -2.38 | -2.42 | -3.51 |
| 11.10 | -2.44 | -2.48 | -3.55 |
| 11.20 | -2.51 | -2.54 | -3.60 |
| 11.30 | -2.57 | -2.61 | -3.64 |
| 11.40 | -2.65 | -2.70 | -3.69 |
| 11.50 | -2.75 | -2.80 | -3.73 |
| 11.60 | -2.86 | -2.92 | -3.79 |
| 11.70 | -3.00 | -3.06 | -3.85 |
| 11.80 | -3.15 | -3.23 | -3.91 |
| 11.90 | -3.33 | -3.43 | -3.99 |
| 12.00 | -3.52 | -3.65 | -4.08 |
| 12.10 | -3.73 | -3.91 | -4.17 |
| 12.20 | -3.96 | -4.22 | -4.29 |
| 12.30 | -4.19 | -4.58 | -4.42 |
| 12.40 | -4.43 | -5.00 | -4.57 |
| 12.50 | -4.67 | -5.48 | -4.74 |
| 12.60 | -4.89 | -6.02 | -4.94 |
| 12.70 | -5.14 | -6.62 | -5.15 |
| 12.80 | -5.40 | -7.30 | -5.41 |
| 12.90 | -5.71 | -8.05 | -5.71 |
| 13.00 | -6.04 | -8.87 | -6.04 |
| 13.10 | -6.39 | -9.79 | -6.39 |
| 13.20 | -6.76 | -10.78 | -6.76 |
| 13.30 | -7.22 | -11.85 | -7.22 |
| 13.40 | -7.67 | -13.01 | -7.67 |
| 13.50 | -8.16 | -14.28 | -8.16 |
| 13.60 | -8.75 | -15.65 | -8.75 |
Note. — MS: main sequence; SB: starburst; tot: MS+SB. LFs at 1 follow by applying a luminosity scaling (1+)2.8 with density fixed for 1 and with density varying according to (1+)-2.4 at 1 2.