ZnMoO4: a promising bolometer for neutrinoless double beta decay searches
Abstract
We investigate the performances of two scintillating crystals operated as bolometers, in view of a next generation experiment to search the neutrinoless double beta decay of 100Mo. We present the results of the vs discrimination, obtained through the scintillation light as well as through the study of the shape of the thermal signal alone. The discrimination capability obtained at the 2615 keV line of is 8 , using the heat-light scatter plot, while it exceeds 20 using the shape of the thermal pulse alone. The achieved FWHM energy resolution ranges from 2.4 keV (at 238 keV) to 5.7 keV (at 2615 keV). The internal radioactive contaminations of the crystals were evaluated through a 407 hours background measurement. The obtained limit is Bq/kg for 228Th and 226Ra. These values were used for a Monte Carlo simulation aimed at evaluating the achievable background level of a possible, future array of enriched Zn100MoO4 crystals.
keywords:
Double Beta Decay , Bolometers , ZnMoO4PACS:
23.40B , 07.57K , 29.40M1 Introduction
Double Beta Decay (DBD) searches became of critical importance after the discovery of neutrino oscillations. Plenty of experiments are now in the construction phase and many others are in R&D phase [1, 2, 3, 4]. The main challenges for all the different experimental techniques are the same [5]: i) increase the active mass, ii) decrease the background, and iii) increase the energy resolution.
Thermal bolometers are ideal detectors for this survey: crystals can be grown with a variety of interesting DBD-emitters and multi kg detectors can be operated with excellent energy resolution [6]: perhaps most critical to the next generation experiments.
The Cuoricino experiment [7], an array of 62 crystal bolometers, demonstrated not only the power of this technique, but also that the main source of background for these detectors arises from surface contaminations of radioactive -emitters. particles, emitted from radioactive contaminations located on the surfaces of the detector or of passive elements facing them, can lose part of their energy in a few m and deposit the rest in the crystal bolometer. This produces an essentially flat background starting from the Q-value of the decays (several MeV) down to low energies, completely covering, therefore, the region of the Qββ values. Moreover simulations show that this contribution will largely dominate the expected background of the CUORE experiment [8, 9] in the region of interest, since there is no possibility to separate this background from the two DBD electrons. The natural way to discriminate this background is to use a scintillating bolometer [10]. In such a device the simultaneous and independent readout of the heat and of the scintillation light permits to discriminate events due to , and neutrons thanks to their different scintillation yield. Moreover, if the crystal is based on a DBD emitter whose transition energy exceeds the 2615 keV -line of , the environmental background due to natural ’s will decrease abruptly.
100Mo is a very interesting -isotope because of its large transition energy keV [11] and a considerable natural isotopic abundance [12]. Several inorganic scintillators containing molybdenum were developed in the last years. [13] is an example of crystal recently tested as a cryogenic detector giving very promising results [14].
In this work we present the results obtained with two crystals of superior quality with respect to the sample previously studied. This work is focused on the recent observation [15] that the thermal signal induced by and / particles shows a slightly different time development. This feature seems to be explained [16] by the relatively long scintillation decay time (of the order of hundreds of s) observed in some scintillating crystals (e.g. molybdates). This long decay, combined with an high percentage of non-radiative de-excitation of the scintillation channel, will transfer phonons (i.e. heat) to the crystal. This extremely tiny, but measurable, time dependent phonon release has a different absolute value for isoenergetic and particles due to their different scintillation yield.
The possibility to have a bolometer in which the background is identified without the need of an additional light detector is particularly appealing since it translates in a simplified set-up.
After an exhaustive description of the vs discrimination power, presented in Sec. 3, in Sec. 5 we present a detailed Monte Carlo simulation of the background performances of a possible future experiment based on a crystal array. Within the Lucifer Project [17], an array of enriched Zn82Se crystals operated as scintillating bolometers, there is also the option of having part of the detectors made of 100Mo enriched crystals. The present work, though based on small size crystal samples, shows the performance that could be reached by a small scale DBD decay experiment based on Zn100MoO4 crystals.
2 Experimental details
High quality crystals were developed in the Nikolaev Institute of Inorganic Chemistry (NIIC, Novosibirsk, Russia). Starting material for the crystal growth were High Purity ZnO (produced by Umicore) and MoO3, synthesized by NIIC. Crystals up to 25 mm in diameter and 60 mm in length were grown by the low-thermal-gradient Czochralski technique in a platinum crucible with a size of mm mm [18].
In this paper we present the result of two separate runs, both carried out in an Oxford 200 3He/4He dilution refrigerator located deep underground in the Laboratori Nazionali del Gran Sasso (average depth3650 m w.e. [19]).
The first run was dedicated to the study of the discrimination capability of bolometers, while the second one was devoted to the evaluation of the internal contaminations of the sample.
In the first run two different crystals were tested in order to study the reproducibility of the background rejection over different samples. The samples were a 27.5 g colourless cylinder ( mm mm) and a 29.9 g slightly orange parallelepiped (28.518.413.2 mm3).
The crystals were held by means of four S-shaped PTFE supports fixed to cylindrical Cu columns. They were surrounded (with no direct contact) by a plastic reflecting sheet (3M VM2002). The Light Detector (LD) [20] is constituted by a 36 mm diameter, 1 mm thick pure Ge crystal absorber. The Ge wafer is heated up by the absorbed photons and the temperature variation is proportional to the scintillation signal. The set-up of the detectors is schematized in Fig. 1.
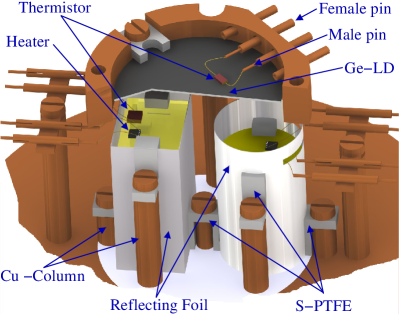
The temperature sensor of the crystals is a 3x3x1 mm3 Neutron Transmutation Doped (NTD) germanium thermistor, the same used in the Cuoricino experiment. It is thermally coupled to the crystal via 9 glue spots of 0.6 mm diameter and 50 m height. The temperature sensor of the LD has a smaller volume (3x1.5x0.4 mm3) in order to decrease its heat capacity, increasing therefore its thermal signal. A resistor of 300 k, realized with a heavily doped meander on a 3.5 mm3 silicon chip, is attached to each absorber and acts as a heater to stabilize the gain of the bolometer [21, 22]. The details of the electronics and the cryogenic facility can be found elsewhere [23, 24, 25].
The heat and light pulses, produced by a particle interacting in the absorber and transduced in a voltage pulse by the NTD thermistors, are amplified and fed into a 18 bit NI-6284 PXI ADC unit. The trigger is software generated on each bolometer and when it fires waveforms 0.6 s long, sampled at 2 kHz, are saved on disk. Moreover, when the trigger of a crystal fires, the corresponding waveform from the LD is recorded, irrespective of its trigger.
As the main goal of the measurements was to test the discrimination capability of the detectors between and events, a 238U/234U source was faced to the crystals, on the opposite side with respect to the LD. The source was covered with a 6 m thick Mylar film, in order to “smear” the ’s energies down to the Qββ energy region. The calibration of the crystals is performed through a movable a source inserted between the Dewar housing the cryostat and the external lead shield. The energy calibration of the LD is achieved thanks to a 55Fe X-ray source, producing two X-rays at 5.9 and 6.5 keV, faced to the LD.
In the second run only the best performing bolometer (the cylindrical crystal) was characterized. The source was removed and the crystal was surrounded by several layers of ultrapure polyethylene in order to shield the bolometer against the surface contamination of the copper structure. In this measurement the lack of space prevented us from mounting the LD. However this was not a problem, as the previous run convincingly demonstrated that the pulse shape analysis can provide an extremely good background rejection without the need for the light detection.
2.1 Data Analysis
To maximize the signal to noise ratio, the pulse amplitude is estimated by means of an optimum filter technique [26, 27]. The filter transfer function is built from the ideal signal shape and the noise power spectrum . is estimated by averaging a large number of triggered pulses (so that stochastic noise superimposed to each pulse averages to zero) while is computed averaging the power spectra of randomly acquired waveforms not containing pulses. The amplitude of a signal is estimated as the maximum of the filtered pulse. This procedure is applied for the signal on the bolometer. The amplitude of the light signal, instead, is estimated from the value of the filtered waveform at a fixed time delay with respect to the signal of the bolometer, as described in detail in Ref. [28]. The detector performances are reported in Table 1. The baseline resolution, FWHMbase, is governed by the noise fluctuation at the filter output, and does not depend on the absolute pulse amplitude. The rise () and decay times () of the pulses are computed as the time difference between the 10% and the 90% of the leading edge, and the time difference between the 90% and 30% of the trailing edge, respectively.
| Crystal | Rwork | Signal | FWHMbase | ||
|---|---|---|---|---|---|
| [M | [V/MeV] | [keV] | [ms] | [ms] | |
| Cylinder | 3.7 | 140 | 0.6 | 17 | 50 |
| Parallel. | 4.7 | 320 | 1.2 | 8 | 33 |
| LD | 8.8 | 1700 | 0.16 | 4 | 11 |
| Cylinder∗ | 2.5 | 200 | 0.7 | 17 | 48 |
After the application of the optimum filter, signal amplitudes are corrected for temperature and gain instabilities of the set-up thanks to a monochromatic power injection in the Si heater taking place every few minutes. The is calibrated using the most intense -peaks from the source, while the LD is calibrated using the 55Fe X-ray doublet.
The FWHM energy resolution obtained on the cylindrical (parallelepiped) crystal ranges from 2.5 0.1 (2.4 0.1) keV at 238 keV to 3.8 0.9 keV (7.6 1.3) at 2615 keV. The energy resolution on the 5407 keV + recoil line (due to a weak internal contamination of 210Po ) can be evaluated only on the long background run for the cylindrical crystal and gives 5.3 1.1 keV. The FWHM energy resolution on the LD, evaluated on the 55Fe X-ray doublet, is 321 9 eV. Experimental resolutions are worse than theoretical ones in agreement with the observed performance of macro-bolometers [29].
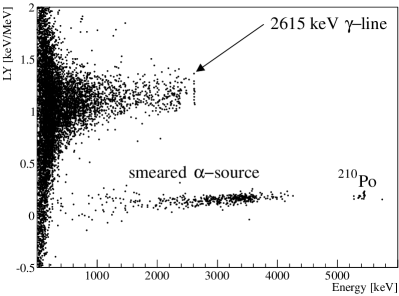
The light-to-heat energy ratio as a function of the heat energy is shown for the calibration spectrum in Fig. 2. and decays give rise to very clear separate distributions. In the upper band, ascribed to events, the 2615 keV -line is well visible. The lower band, populated by decays, shows the continuum rate induced by the degraded source as well as the 210Po doublet.
The Light Yield (LY), defined as the ratio between the measured light (in keV) and the nominal energy of the event (in MeV), was measured for the most intense -lines giving 1.10 0.03 keV/MeV and 0.78 0.02 keV/MeV for the cylinder and for the parallelepiped, respectively. These values are constant from 0.2 to 2.6 MeV and are not corrected for the light collection efficiency. The LY of the cylindrical crystal is well in agreement with the one reported in [14, 30], while the parallelepiped shows a lower LY.
The Quenching Factor (QF), defined as the ratio of the LYα/LYβ/γ for the same energy release, was evaluated on the 5407 keV -line and results 0.18 for both crystals.
3 vs discrimination
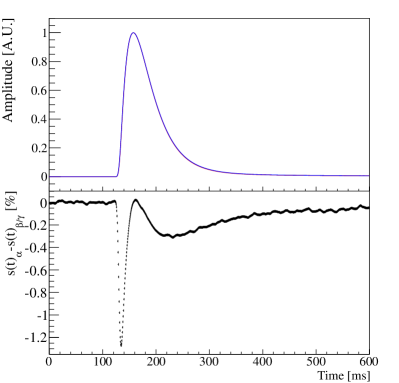
As reported in [14, 15], Molybdate crystals can provide vs discrimination by making use of the thermal information only. In Fig. 3 the ideal signal shape for the two event classes is shown together with the percentage difference -. Pulse shapes are obtained by averaging pulses (obtained in the same calibration measurement of Fig. 2) in the energy range 2610-2620 keV and aligned at the maximum. Differences at a level of a few per mille are visible both in the rise and decay of the thermal pulse 111We will refer to pulses from the cylindrical bolometer throughout the rest of the text. However, the parallelepiped bolometer showed consistent results..
To fully exploit this feature several shape variables have been studied: , , TVL, TVR, . The Test Value Left (TVL) and Right (TVR) are defined as:
| (1) | ||||
| (2) |
All quantities in the above equations refer to the optimum filtered pulses: yi is the pulse, A and iM its amplitude and maximum position, si the ideal signal pulse scaled to unitary amplitude and aligned to yi, wl(r) the left(right) width at half maximum of si. The maximum of the ideal pulse is aligned with the maximum of the filtered pulse, fractional delays are handled with a linear interpolation of the data samples.
Finally, was computed as the sum of the squared fit residuals normalized to the noise RMS, using si as a fit function of the central part of the pulse. This algorithm is described in detail in [31].
Bolometers are nonlinear detectors [32], i.e. the shape of the signal slightly depends on the amount of released energy. This implies that also the shape parameters (evaluated with respect to an energy independent pulse, si) will show such a dependence. To remove such a dependency variables were linearized in the 2300-3200 keV energy range.
This procedure, moreover, allowed to enlarge the data sample on which the pulse shape analysis was performed.
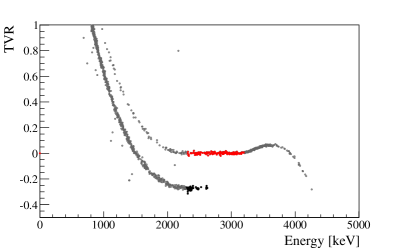
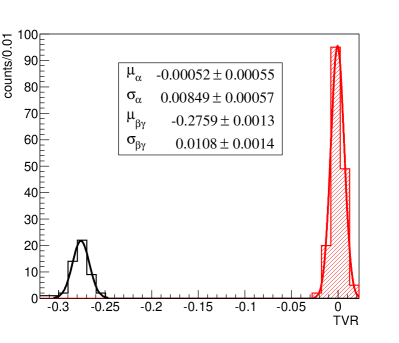
Fig. 4 shows the TVR variable as a function of the energy. As for the case of Fig.2, and events are distinctly separated. Events in the linearized energy region and belonging to the upper () band are shown in red while events, in the same energy interval, belonging to the lower () band are shown in black. The discrimination power (DP) between the two distributions is usually quantified as the difference between the average values of the two distributions normalized to the square root of the quadratic sum of their widths:
| (3) |
The above definition does not imply any probabilistic meaning, it was used for the sake of comparison with similar quantities reported in published papers [14, 15].
The TVR distribution (see bottom panel in Fig. 4) exhibits a discrimination power of 20. This is a very impressive result. For comparison, the Light Yield DP for the same events (Fig. 2) is 8. The separation achievable with the shape algorithm alone is therefore much more powerful than the one obtained using the information of the light detector and allows to reject events to any desirable level.
Results for all the shape parameters are reported in Tab. 2. Considering the outstanding TVR performance compared to other variables, it was not worth combining them into a multivariate analysis. For completeness, TVR and scintillation were combined [33] into a Fisher linear discriminant analysis [34, 35], resulting in a discrimination power of 24. The two variables showed only a modest correlation: +23(-25) for the () events.
| Shape Variable | DP |
|---|---|
| 4.9 | |
| 4.6 | |
| TVL | 4.2 |
| TVR | 20.0 |
| 6.2 |
4 Internal contaminations
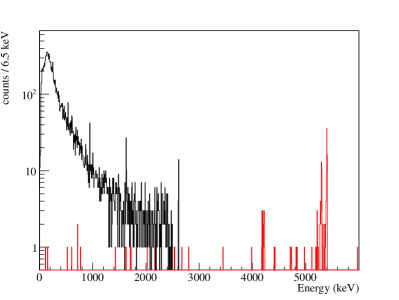
As pointed out in Sec. 2, the internal contaminations were evaluated in a second, dedicated run. In this run only the cylindrical crystal was measured. The set-up of the detector was identical to the one sketched in Fig. 1, but this time the LD was not present. In order to avoid surface radioactivity, the Cu facing the crystal was covered by several layers of polyethylene, the same used in CUORE Crystal Validation Runs [36]. The detector was run in similar temperature conditions of the previous run (see Tab. 1). The obtained energy spectrum, consisting of a sum of background and calibration spectra (totalling 407 hours), is presented in Fig. 5.
The induced background shows clearly three peaks. Two of them are identified as induced by 210Po (internal, 5407 keV, and on surface, 5304 keV) decay, while the third one is due to an internal contamination of . No other structure is visible on the spectrum, resulting in a flat continuum. In particular no events are recorded above 6 MeV, implying no decays induced by the most dangerous radionuclides for DBD searches, namely the ones that undergo / decay with Q-values larger than Qββ (see Sec. 5.2.1). The evaluated internal radioactive contaminations are presented in Tab. 3.
| Chain | nuclide | activity |
|---|---|---|
| Bq/kg | ||
| 32 | ||
| 228Th | 32 | |
| 238U | 238U | 350 90 |
| 234U | 110 | |
| 230Th | 68 | |
| 226Ra | 32 | |
| 210Po | 1660 200 |
5 Background simulation
5.1 General consideration
The study of background issues for an experiment aiming at reaching high sensitivity on 0DBD search can be divided into different types of sources depending on their position. In the following we will analyze in detail the “near sources” (crystal and copper mounting structure contaminations). “Far sources” (radioactive contaminations in the experimental apparatus, mainly the refrigerator and its external shields) and “environmental sources” (contribution present at the experimental site: mainly muons, neutrons and rays) are instead closely dependent on the experimental apparatus and environment in which the set-up is installed. A detailed description concerning these categories of sources in Cuoricino, the inspirer of this configuration can be found in [37].
Background induced by far sources is produced by -rays since ’s and ’s can be easily shielded. The choice of an isotope with a Q-value exceeding 2615 keV (by far the most intense -high energy- natural -line emitted by the decay of , belonging to the decay chain) allows to greatly reduce this background. Above this energy there are only extremely rare high energy ’s from 214Bi: the total Branching Ratio (BR) in the energy window from 2615 up to 3270 keV is 0.15 %.
In this frame it is mandatory to take into account also coincidence events that can occur in one crystal. The most relevant case is represented by the decay of . In this decay, for example, there is 85 % probability that the 2615 keV is emitted in cascade with the 583 keV . In fact, as we will evaluate in Sec. 5.2.2, this mechanism represents the largest source of background above 2615 keV. On the other hand it is clear that the probability of simultaneous interaction in the same crystal strongly depends on the relative distance from the detector. Moreover the lower energy is easily shielded compared to the higher energy one, so that this type of background can be completely neglected, in the case of “far sources”, with the installation of a proper shielding.
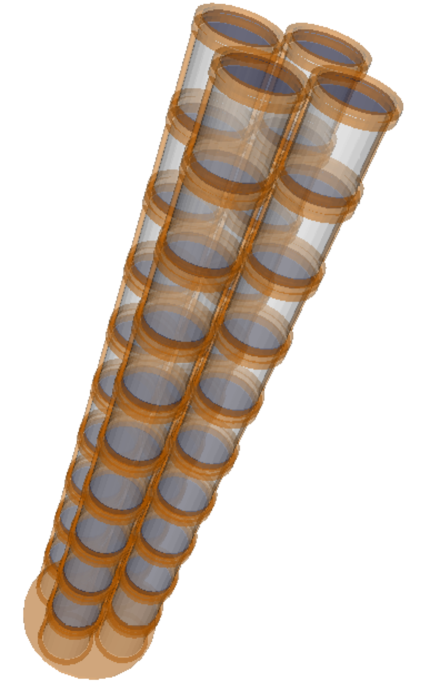
Finally the last contribution that must be considered, for what concerns environmental sources, is the one coming from neutron and muon interactions in the detector. For these we consider the results reported in [37, 38] by the CUORE collaboration, for a modular bolometric detector operated underground, with a geometrical configuration similar to the one proposed here (see Figure 6). The change in the molecular compound does not heavily affect the background rates. Indeed, as in the case of crystals, none of the isotopes of have high neutron cross sections, the main parameter that could affect the background. External neutrons yield an integrated contribution in the 3-4 MeV region 10-5 [37], while external muons - operating the array in anticoincidence - yield a contribution of 10-4 in the 2-4 MeV region [38].
5.2 Near sources
The region of interest (ROI) for the evaluation of the background is a few FWHM wide and centered at the 0DBD Q-value. For crystals the ROI has therefore been chosen between 3014 and 3054 keV. All the background levels quoted in the following have been defined running dedicated Monte Carlo simulations based on Geant4 code. A tower-like detector (see Fig. 6) was simulated, made out of 40 detectors ( crystal + Ge LD) arranged in a modular configuration of 10 floors with 4 crystals each. The crystals here considered are cylinders (h = 60 mm, = 60 mm) faced to Ge slabs of h = 0.5 mm, = 60 mm.
The total mass of the detectors is 29.3 kg, which corresponds to 1.20 kg of 100Mo in the case of non enriched crystals and to a mass of 11.22 kg in the case of enriched crystals at the 90% level. The design of the detectors is done in such a way as to reduce the amount of inert material facing the detector and at the same time to overcome the problem of differential thermal contractions between the detector and structure. The most “massive” materials employed for the detectors assembly are copper (skeleton structure) and PTFE (detector holders), and the mass ratio between these two components is about 100:2. The contribution of PTFE is neglected due to the reduced mass and relatively high radio-purity of this material [39]. Thus the only relevant near sources of background are radioactive contaminations of the copper structure and of the scintillating crystals themselves. In both cases not only ’s, but also ’s contribute to the counting rate in the 0DBD region.
The contamination of the Ge wafers, if any, will not be a problem: I) high purity Ge slab will be used as LD’s with negligible radioactive internal contaminations, II) radioactive decay in the LD produce thermal pulses with a different shape than events produced by scintillation light. These events can therefore be easily recognized and rejected.
In the following sections, all the possible near sources will be considered separately.
5.2.1 Crystal bulk contaminations
In the case of crystal bulk contaminations the main contribution to the background rate in the ROI arises from the / emissions of the natural radioactive chains. Indeed the kinetic energy of ’s emitted by U and Th daughters are always far above the ROI. The emitters that give an important contribution to the background are ( chain), 214Bi and 210Tl (238U chain).
has a Q-value of 5 MeV and decays through a channel with a half-life of 3 min. It gives rise to a continuous spectrum which, in combination with ’s emitted in the re-assessment of the daughter nucleus, can produce events falling in the ROI. However, the background induced by this isotope can be effectively reduced by means of delayed coincidences between the signal and the emitted by its precursor, 212Bi (Q-value=6.2 MeV). The coincidence pattern to be studied would be an event in the 0DBD region preceded by an decay of 6.2 MeV. Provided that the counting rate is not too high, the dead time introduced by this method is low or even negligible.
In the 238U decay chain the only contribution above 2.7 MeV comes from the decay of 214Bi and 210Tl. 214Bi decays with a BR of 99.98% (Q-value=3.27 MeV) to 214Po which decays with a very short half-life (163 s) and a Q-value of 7.8 MeV. Since the rise time in our bolometers is of the order of ms, the events add up to -events producing events with energies higher than 7.8 MeV (the so called Bi-Po’s). These events therefore do not produce background into the ROI. In the residual 0.02% of cases, 214Bi -decays to 210Tl that is a emitter with a Q-value of 5.5 MeV and an half-life of 1.3 min. The background induced by this emitter can be easily rejected with a cut on the delayed coincidences between the 210Tl signal and the 214Bi , as it happens for 212Bi.
For the sake of completeness we neglect, at this level, internal contaminations of “exotic” long lived, high energy (Q3 MeV, 0.3 years) emitters, the most dangerous being 42Ar (42K), 106Ru (106Rh) and 126Sn (126Sb).
5.2.2 Copper bulk contamination
Copper is the most abundant material in the experimental set-up near the detectors. The most important contribution to
the counting rate in the ROI might be given by 214Bi high energy ’s, and by ’s at 583 and 2615 keV
that, being emitted in cascade, can sum up to 3.2 MeV.
A proper selection of high quality copper would be enough to guarantee
a negligible contribution from these sources.
Indeed, simulating a bulk contamination of 19 Bq/kg in 228Th and 16 Bq/kg in 226Ra (limits on NOSV copper [40])
in the detector copper structure, the overall contribution in the ROI is 2.400.04 10-4 .
Considering the same bulk contaminations for the copper of the 10 mK shielding (the inner thermal shielding, 2 mm thick) the total background expected is 1.400.05 10-4 . The background due to the other, more distant, thermal shielding and the other far parts of the cryostat is lower and therefore, negligible.
5.2.3 Surface contaminations
An important contribution to the background of the experiment may arise from surface contamination, specially from degraded coming out mostly from surfaces of inert materials facing the detector [8, 9]. Two procedures can be applied for its reduction: rejection based on pulse shape analysis (or the scintillation signals) and the use of anticoincidences between the detectors of the array. This last possibility is, however, useful only for crystals surface contaminations. It does not allow in any way to recognize the background due to surface contamination of inert material facing the detectors. Taking into account the discrimination power obtained both with pulse shape analysis and scintillation signals described in Sec. 3, this background source can be completely neglected.
5.2.4 / pile-up
Finally, one has to take into account that for slow detectors, like bolometers, even a feeble / emission with Q3 MeV can produce an unwanted background due to the difficulty to recognize and reject pile-up on the rise time of the thermal pulse. Indeed independent signals can randomly add generating a background that extends even beyond the ROI.
This background depends mainly on 3 factors: the time within which is impossible to distinguish two separate events, the rate of / interactions and their energy distribution. With respect to the rate due to / events arising from near sources or internal contamination, it can be easily evaluated given the contaminations of Sec. 5.2.1 and Sec. 5.2.2. This rate is of the order of 0.1 mHz. Even considering the far sources (that are negligible in the ROI but contribute in the 0–2615 keV region) the total rate is well below 1 mHz.
In fact it turns out that the main contribution arises from the 2DBD of 100Mo, due to its relatively “fast” decay time. The expected rate in a 90% enriched crystal (h = 60 mm, = 60 mm) is 5.45 mHz. Unfortunately, the energy spectra of the 2DBD exhibit a maximum at rather high energy ( 1.25 MeV) with a “broad” distribution, so that the pile-up energy spectrum distribution falls very close to the 0-ROI.
The pile-up is recognized through the pulse shape analysis of the optimally filtered pulses. The time window in which we are not able to distinguish two pulses depends mostly on two parameters: the noise of the baseline and the relative pulse height of the two pulses. Our simulation (involving a dedicated pulse shape and noise generator) shows that the time in which two pulses cannot be recognized is definitely smaller than /10. Here we conservatively assume as 5 ms the time in which we are not able to distinguish two different pulses. Giving this as input, we performed a Monte Carlo simulation of the 2DBD of 100Mo. The irreducible 2DBD pile-up evaluated in the ROI is .
5.3 Total background evaluation
In this section we report the background level that could be reached taking into account the above mentioned sources. When quoting background rates, we assume to operate the detectors in anticoincidence, thus recording only single hit events. Background contributions due to sources described in Sec. 5.2.1, Sec. 5.2.2, and Sec. 5.2.4 are reported in the last column of Tab. 4.
| source | position | background |
|---|---|---|
| [ ] | ||
| U chain | crystals bulk | 1.160.1 10-5 |
| Th chain | crystals bulk | 2.180.04 10-4 |
| 2DBD pile-up | crystals bulk | 1.960.36 10-3 |
| U+Th chains | Cu frame bulk | 2.400.04 10-4 |
| U+Th chains | Cu shield bulk | 1.400.05 10-4 |
The background reported for internal contaminations in U and Th chains takes into account the suppression obtained with delayed coincidences at 5 . The dead time therefore introduced is 0.01% for U chain and 2.0% for Th chain. The inefficiency introduced by those events where the decay occurs near the crystal surface and the particle escapes the crystal is of about 0.1%. This evaluation is based on Monte Carlo simulations. In this case we assume to loose any possibility of delayed coincidence, and we compute the background as the sum of the fraction of the untagged events due to the escape and the fraction of the untagged events because they are out of the maximum allowed delayed coincidence window.
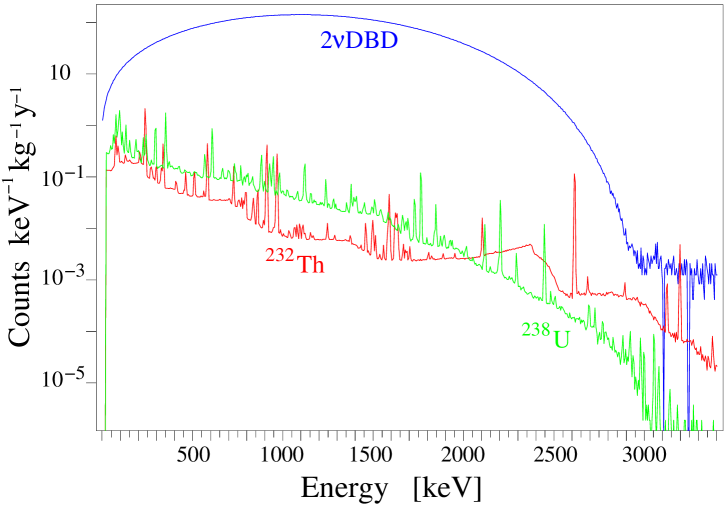
Contribution due to the other “near sources” (i.e. the Cu frames and the Cu 10 mK shield bulk contaminations) are evaluated considering both the 214Bi high energy -lines and the ’s cascade. The induced background spectra due to and 238U in the Cu frames is reported in Fig. 7.
As can be seen from Tab. 4 and from Fig. 7, the main contribution to the background is definitely due to unrecognized 2DBD pile-up of 100Mo. The only way to reduce this background will be to reduce the size of a single crystal but, as we shall see shortly, this would be useless for an experiment with a mass of 11.22 kg of 100Mo such as the one here investigated.
5.4 Experimental sensitivity
The maximum sensitivity reachable by a 0DBD experiment corresponds to the “zero background” condition. This occurs when ( 1 [41], where is the background level per unit mass, energy, and time, is the detector mass, is the measuring time and is the FWHM energy resolution. For a “standard” live-time for a 0DBD experiment (i.e. 5 years), an energy resolution of 5 keV and a detector mass of 30 kg the “zero background” condition will be reached with a background of 1.510-3 .
Considering the different sources of background discussed in the previous sections and summarized in Tab. 4, with the detector array described above, for an enrichment of 90%, in 5 years of data taking we are able to fulfill the “zero background” condition.
For such an experiment, for a neutrino mass of we will expect between 1.7 and 13.9 counts of 0DBD depending on the Nuclear Matrix Element [42, 43, 44, 45].
6 Conclusions
We successfully tested two crystals as bolometers. The separation achievable on the shape of the thermal signal alone is much more powerful than the one obtained using the information of the light detector and allows to reject events to any desirable level. Furthermore we would like to point out a very important consideration in favour of the pulse shape discrimination. The light collection generally depends on the size of the scintillating crystal, due to self absorption mechanisms. Since the LY of the is rather small, this could imply a decrease in the achievable discrimination power obtainable through the light detection, moving from a few tenth grams crystals to a few hundreds grams crystals. On the contrary, this mechanism will enhance the pulse shape discrimination since the self absorbed light signal will convert into heat, summing up with the non-radiative de-excitations that makes possible the vs discrimination.
Moreover, even without any kind of material selection, the internal contaminations in 228Th and 226Ra are already at an extremely low level, never obtained in any crystal compound based on Molybdenum. The projection of these results to a small-size experiment foresees a possible background level close to zero.
7 Acknowledgements
This work was made in the frame of the LUCIFER experiment, funded by the European Research Council under the European Union’s Seventh Framework Programme (FP7/2007-2013)/ERC grant agreement n. 247115. Thanks are due to E. Tatananni, A. Rotilio, A. Corsi, B. Romualdi and F. De Amicis for continuous and constructive help in the overall set-up construction.
8 References
References
- Avignone et al. [2008] F. T. Avignone, S. R. Elliott, J. Engel, Double Beta Decay, Majorana Neutrinos, and Neutrino Mass, Rev. Mod. Phys. 80 (2008) 481.
- Barabash [2011] A.S. Barabash, Double beta decay experiments, Phys. of Part. and Nucl. 42 (2011) 613.
- [3] N. Ackerman, et al, Observation of Two-Neutrino Double-Beta Decay in 136Xe with the EXO-200 Detector, Phys. Rev. Lett. 107 (2011) 212501.
- [4] A. Gando, et al, Measurement of the Double-Beta Decay Half-life of in KamLAND-Zen, arXiv:1201.4664v1 (2012).
- Pirro [2006] S. Pirro, Prospects in double beta decay searches, Eur. Phys. J. A27 (2006) 25–34.
- Cardani et al. [2012] L. Cardani, et al., Performance of a large TeO2 crystal as a cryogenic bolometer in searching for neutrinoless double beta decay , JINST 7 (2012) P01020.
- Andreotti et al. [2011] E. Andreotti, et al., 130Te Neutrinoless Double-Beta Decay with Cuoricino, Astropart.Phys. 34 (2011) 822.
- Arnaboldi et al. [2004] C. Arnaboldi, et al., CUORE: A Cryogenic Underground Observatory for Rare Events, Nucl. Instrum. Meth. A. 518 (2004) 775.
- Pavan et al. [2008] M. Pavan, et al., Control of bulk and surface radioactivity in bolometric searches for double-beta decay, Eur.Phys.J. A36 (2008) 159.
- Pirro et al. [2006] S. Pirro, et al., Scintillating double beta decay bolometers, Phys. Atom. Nucl. 69 (2006) 2109.
- Rahaman et al. [2008] S. Rahaman, et al., Q value of the 100Mo Double-Beta Decay, Phys. Lett. B662 (2008) 111–116.
- Bohlke et al. [2007] J. Bohlke, et al., J. Phys. Chem. Ref. Dat 34 (2007) 57.
- Ivleva et al. [2008] L. Ivleva, et al., Crystallography Reports 53 (2008) 1087.
- Gironi et al. [2010] L. Gironi, et al., Performance of crystal as cryogenic scintillating bolometer to search for double beta decay of molybdenum, JINST 5 (2010) P11007.
- Arnaboldi et al. [2011] C. Arnaboldi, et al., A novel technique of particle identification with bolometric detectors, Astropart. Phys. 34 (2011) 797–804.
- Gironi [2011] L. Gironi, Pulse Shape Analysis with scintillating bolometers, J Low Temp. Phys.DOI 10.1007/s10909-012-0478-x (2012).
- Ferroni [2010] F. Ferroni, Lucifer: A new technique for double beta decay, Nuovo Cimento C 033 (2010) 27–34.
- Galashov et al. [2010] E.N. Galashov, et al., Growing of 106CdWO4 , ZnWO4 and scintillation crystals for rare events search by low thermal gradient Czochralski technique, Functional Materials 17 (2010) 504.
- [19] M. Ambrosio, et al., Observation of the shadowing of cosmic rays by the Moon using a deep underground detector, Phys. Rev. D59 (1998) 012003.
- S. Pirro et al. [2006] S. Pirro, et al., Development of bolometric light detectors for double beta decay searches, Nucl. Instrum. Methods 559 (2006) 361.
- Alessandrello et al. [1998] A. Alessandrello, et al., Methods for response stabilization in bolometers for rare decays, Nucl. Instrum. Meth. A 412 (1998) 454.
- Arnaboldi et al. [2003] C. Arnaboldi, G. Pessina, E. Previtali, A programmable calibrating pulse generator with multi- outputs and very high stability, IEEE Trans. Nucl. Sci. 50 (2003) 979.
- S. Pirro et al. [2006] S. Pirro, et al., Further developments in mechanical decoupling of large thermal detectors Nucl. Instrum. Methods 559 (2006) 672.
- S. Pirro et al. [2006] C. Arnaboldi, G. Pessina, S. Pirro, The cold preamplifier set-up of Cuoricino: Towards 1000 channels, Nucl. Instrum. Methods 559 (2006) 826.
- C. Arnaboldi et al. [2004] C. Arnaboldi, et al., The front-end readout for Cuoricino, an array of macro-bolometers and MIBETA, an array of -bolometers , Nucl. Instrum. Methods 559 (2006) 361.
- Gatti and Manfredi [1986] E. Gatti, P. F. Manfredi, Processing the signals from solid state detectors in elementary particle physics, Riv. Nuovo Cimento 9 (1986) 1.
- Radeka and Karlovac [1967] V. Radeka, N. Karlovac, Least-square-error amplitude measurement of pulse signals in presence of noise, Nucl. Instrum. Methods 52 (1967) 86.
- Piperno et al. [2011] G. Piperno, S. Pirro, M. Vignati, Optimizing the energy threshold of light detectors coupled to luminescent bolometers, JINST 6 (2011) P10005.
- Bellini et al. [2010] F. Bellini, et al., Response of a bolometer to alpha particles, JINST 5 (2010) P12005.
- J.W. Beeman et al. [2011] J.W. Beeman, et al., Potential of a next generation neutrinoless double beta decay experiment based on scintillating bolometers, arXiv:1112.3672v1 (2011).
- Di Domizio et al. [2011] S. Di Domizio, F. Orio, M. Vignati, Lowering the energy threshold of large-mass bolometric detectors, JINST 6 (2011) P02007.
- Vignati [2010] M. Vignati, Model of the Response Function of Large Mass Bolometric Detectors, J.Appl.Phys. 108 (2010) 084903.
- Hoecker et al. [2007] A. Hoecker, P. Speckmayer, J. Stelzer, J. Therhaag, E. von Toerne, H. Voss, TMVA: Toolkit for Multivariate Data Analysis, PoS ACAT (2007) 040.
- Fisher [1936] R. A. Fisher, The use of multiple measurements in taxonomic problems, Annals of Eugenics 7 (1936) 179–188.
- Srivastava [1983] E. Srivastava, M.S. Carter, An introduction to applied multivariate statistics., New York-Amsterdam-Oxford: Northland (Elsevier Science Publishing Co., Inc.). X (1983).
- Alessandria et al. [2012] F. Alessandria, et al., CUORE crystal validation runs: results on radioactive contamination and extrapolation to CUORE background., arXiv:1108.4757v2 (2011).
- Bucci et al. [2009] C. Bucci, et al., Background study and monte carlo simulations for large-mass bolometers, European Physical Journal A 41 (2009) 155–168.
- Andreotti et al. [2010] E. Andreotti, et al., Muon-induced backgrounds in the Cuoricino experiment, Astropart. Phys. 34 (2010) 18–24.
- Aprile et al. [2011] E. Aprile, et al., Material screening and selection for XENON100, Astropart. Phys. 35 (2011) 43–49.
- [40] G. Heusser, M. Laubenstein, H. Neder, in: Radioactivity in the environment, volume 8, (2006) Edited by P.P. Povinec and J.A. Sanchez-Cabeza, Elsevier, p. 495
- Cremonesi [2011] O. Cremonesi, Neutrinoless Double Beta Decay Searches, in: Journal of Physics: Conference Series, volume 335, IOP Publishing, p. 012007.
- Šimkovic et al. [2008] F. Šimkovic, A. Faessler, V. Rodin, P. Vogel, J. Engel, Anatomy of the 0 nuclear matrix elements, Phys. Rev. C 77 (2008) 045503.
- Civitarese and Suhonen [2009] O. Civitarese, J. Suhonen, Nuclear matrix elements for double beta decay in the QRPA approach: A critical review, J. Phys. Conf. Ser. 173 (2009) 012012.
- Men ndez et al. [2009] J. Men ndez, A. Poves, E. Caurier, F. Nowacki, Disassembling the nuclear matrix elements of the neutrinoless decay, Nuclear Physics A 818 (2009) 139.
- Barea and Iachello [2009] J. Barea, F. Iachello, Neutrinoless double- decay in the microscopic interacting boson model, Phys. Rev. C 79 (2009) 044301.