The fate of high redshift massive compact galaxies in dense environments
Abstract
Massive compact galaxies seem to be more common at high redshift than in the local universe, especially in denser environments. To investigate the fate of such massive galaxies identified at we analyse the evolution of their properties in three cosmological hydrodynamical simulations that form virialised galaxy groups of mass hosting a central massive elliptical/S0 galaxy by redshift zero. We find that at redshift the population of galaxies with is diverse in terms of mass, velocity dispersion, star formation and effective radius, containing both very compact and relatively extended objects. In each simulation all the compact satellite galaxies have merged into the central galaxy by redshift 0 (with the exception of one simulation where one of such satellite galaxy survives). Satellites of similar mass at are all less compact than their high redshift counterparts. They form later than the galaxies in the sample and enter the group potential at , when dynamical friction times are longer than the Hubble time. Also, by the central galaxies have increased substantially their characteristic radius via a combination of in situ star formation and mergers. Hence in a group environment descendants of compact galaxies either evolve towards larger sizes or they disappear before the present time as a result of the environment in which they evolve. Since the group-sized halos that we consider are representative of dense environments in the CDM cosmology, we conclude that the majority of high redshift compact massive galaxies do not survive until today as a result of the environment.
keywords:
galaxies: formation — hydrodynamics — methods: numerical — methods: N-body simulations.1 Introduction
High redshift massive galaxies are observed to have a wide range of properties. Van Dokkum et al. (2009) report on a massive compact galaxy at redshift with velocity dispersion km s-1, stellar mass of and an effective radius of kpc and van de Sande et al. (2011) present a compact galaxy with dynamical mass of and velocity dispersion of km s-1 at redshift . In a complete sample of luminous early type galaxies in the Hubble Ultra Deep Field of Daddi et al. (2005) roughly half of the galaxies in the sample have effective radii of kpc (see also Szomoru et al. 2010) while Mancini et al. (2010) derive for a sample of 12 ultra massive early-type galaxies at effective radii comparable to those of local ellipticals. Also Onodera et al. (2010) report the detection of a massive galaxy at with properties fully consistent with those of today’s giant ellipticals. In the local universe the massive, compact objects seem not exist anymore (see e.g. the SDSS sample, York et al. 2000, as presented in van de Sande et al. 2011) and at fixed stellar mass early-type galaxies were generally more compact and denser at earlier times (Cappellari et al. 2009, van de Sande et al. 2011). However, consensus in this debate has not yet been reached, Szomoru, Franx & van Dokkum (2011) found that the number density for passively evolving massive compact galaxies declines with time whereas new work (Carollo et al in prep.) shows that this number density constant stays versus redshift.
Mechanisms to grow a compact elliptical galaxy in size have been investigated in the literature, such as accretion of stars from minor and major mergers as well as redistribution of angular momentum of the in situ stellar component (e.g. Khochfar & Silk 2006, Naab et al. 2007, 2009; Oser et al. 2010; Hopkins et al. 2010; Bezanson et al. 2009; Feldmann et al. 2010, F10 hereafter). Such mechanisms can in principle turn an ultra-compact high-z galaxy into an early-type galaxy with a much larger effective radius and lower density, comparable to that of present-day ellipticals. Recently, Oser et al. (2011) have used 40 cosmological re-simulations of massive, individual (’field’) galaxies to show that the simulated galaxies having at are compact with high velocity dispersion. Those galaxies then grow in size until mostly due to minor mergers111The importance of merging for size growth has also been pointed out by recent observational work (e.g., Bluck et al. 2011, Whitaker et al. 2011, Newman et al. 2011, Mármol-Queraltó et al. 2012). to become more consistent with the local (SDSS) sizes. However, it is unclear whether galaxy formation simulations in the context of the CDM model can reproduce not only the existence of extremely compact galaxies at high redshift but also the fact that a large spread in the properties of massive galaxies already exists at high redshift based on the latest observations. In addition, little is known about the connection between early-type galaxies existing at low and high redshift besides the difference in the typical densities and effective radii. Simulations have the potential to shed light on this issue, as they have done already in the case of disc galaxies (e. g. Brooks et al. 2010). F10 have studied the evolution of massive early-type galaxies at the centre of virial groups with mass in cosmological simulations analysing their structural evolution from to . In a complementary study, Feldmann, Carollo & Mayer (2011) (FCM11 hereafter) have investigated the environmentally-driven evolution of the non-central group members in one of these groups focussing on the galaxy population present at . Here, on the other hand, we discuss the properties of galaxies identified to be massive at , comparing them with observations of massive galaxies at and establishing the evolutionary connection with the final member galaxies of the groups at . We note that each of these three simulations of group haloes shows several () massive galaxies already at redshift 2.
We show that at redshift the population of massive galaxies is diverse in terms of mass, velocity dispersion and effective radius (although generally more compact than the local counterparts), in agreement with the picture emerging from the observations. Despite their variety at high redshift in all the three simulations the main progenitors evolve into fairly typical massive early-type galaxies at redshift zero, with similar stellar masses, sizes and velocity dispersions. We discuss the implications of the latter result in the general galaxy formation picture. We find that all (but one) of the massive galaxies selected at redshift merge to form the most massive central galaxy at redshift zero in each simulation. Today’s massive satellite galaxy population did not exist already at high z. The massive satellite galaxies selected at redshift 0 acquire most of their stellar mass much later than and are found to be less compact than the high redshift sample.
In Section 2, we present our initial conditions, numerical techniques and the methodology for the analysis. In Section 3, we discuss the evolution of the properties of the massive galaxies selected at redshift two and zero. Section 4 discusses the role of formation time and the influence of missing physics and numerical resolution. We conclude and summarise in Section 5.
2 Simulations
We analysed a set of three cosmological smoothed particles hydrodynamics (SPH) simulations at the galaxy group scale originally presented and described in F10. The groups called G1, G2 and G3 have similar virial masses at redshift 0 () but different merger histories and environments.
Those galaxy groups were selected from a DM-only simulation (Hahn et al. 2007) based on their halo masses. The re-simulation of those patches were performed in the WMAP3 cosmology (Spergel et al. 2007) using several layers of resolution enclosing each galaxy group with gas particles added to the highest resolution regions. The initial power spectrum has been calculated using linger (Bertschinger 1995) and the refinements were generated using grafic-2 (Bertschinger 2001). All groups were evolved to redshift at standard resolution where the dark matter has been sampled with particles of mass (where ) and the gas with particles having initial mass of . The gravitational (spline) softening length used was and kpc for the dark and baryonic particles, respectively. Additionally, a high-resolution version of G2 was evolved down to z using eight times better mass and two times better force resolution. In this paper we are reporting the results from the high-resolution version of G2 and from the standard resolution versions of G1 and G3. We additionally use the standard resolution run of G2 to analyse the influence of numerical resolution.
The simulations were performed using the parallel TreeSPH code Gasoline (Wadsley et al. 2004). The code includes radiative cooling for a primordial mixture of helium and (atomic) hydrogen. Because of the lack of molecular cooling and metals, the efficiency of our cooling functions drops rapidly below K. Star formation and feedback is modelled as in Stinson et al. (2006); stars spawn from cold, Jeans unstable gas particles in regions of converging flows. Once a gas particle is eligible for spawning stars, it does so based on a probability distribution function with a star formation rate parameter that has been tuned to match the Kennicutt (1998) Schmidt Law. Each star particle is treated as a single stellar population with Scalo IMF (Miller & Scalo 1979). Feedback from supernovae Type Ia and II is included in the simulation. The latter are modelled using the blastwave scenario from McKee and Ostriker (1977), which involves shutting-off the cooling for gas encompassed by the blast-wave over a duration comparable to the Sedov plus snowplaugh phases (10-20 Myr). Such model for star formation and feedback has proven to be successful in simulating the formation of realistic disc galaxies at both low and high mass scales (Mayer, Governato & Kaufmann 2008; Governato et al. 2010; Guedes et al. 2011). At sufficiently high resolution it is even possible to form disc galaxies and ellipticals/S0s in the same simulation (FCM11).
In all the simulations a population of relatively massive main progenitors, which are star forming and host reservoirs of cold gas, evolve to massive, gas-poor early-type systems supported by stellar velocity dispersion. By redshift zero those central galaxies are resembling either elliptical or S0 galaxies.
2.1 Methodology of the analysis
We select all galaxies at redshift with stellar masses using a friends of friends (fof) algorithm with a linking length of kpc. The stellar masses of those galaxies are calculated by adding up all stellar particles in a sphere of radius (physical) kpc around the centre of the stellar particles. At redshift all quantities are calculated within a radius of kpc around the centre. While the choice of this radius is arbitrary to some extent the changes in stellar masses stay small when the radius is varied within a factor of (F10). This has been quantified in FCM11, who showed that a radius of kpc encloses of the stellar mass of the galaxies at . We correct for star formation in the unresolved centres of the galaxies following the minimal star formation correction approach described in detail in the appendix of F10. Masses and effective radii derived using the correction are shown as error bars in the Fig. 2.
We define the effective radius as the radius which includes half of the stellar mass within (physical) kpc at ( kpc for ) around the centre of the respective galaxy. The stellar velocity dispersion has been calculated along a randomly chosen line of sight (LOS) through the galaxy and as well along two additional LOS orthogonal to the others. The quoted velocity dispersion is averaged over all the results from the different LOS and errors come from the difference of the average and the minimal (maximal) value of dispersions, respectively.
Additionally, in the high-resolution version of G2 we select a population of massive galaxies (referred to as ’satellite’ galaxies) at redshift 0 with stellar masses , i.e. with masses equivalent to those of the sample. The central galaxy has been excluded from the sample. These five satellites are then traced back to . All the quantities are calculated within a radius of kpc around the centre at all redshifts given that those galaxies do not extend beyond that significantly. We have adapted the minimal star formation correction approach of F10 for the satellites: The average minimal amount of star formation of Gyr-1 in the satellites within the inner softening length (which is potentially artificial) has been removed from the inner region, as described in the appendix of F10. Again, values derived using the correction are shown as error bars in the respective figure.
3 The evolution of massive galaxies
3.1 The nature of massive galaxies at redshift 2
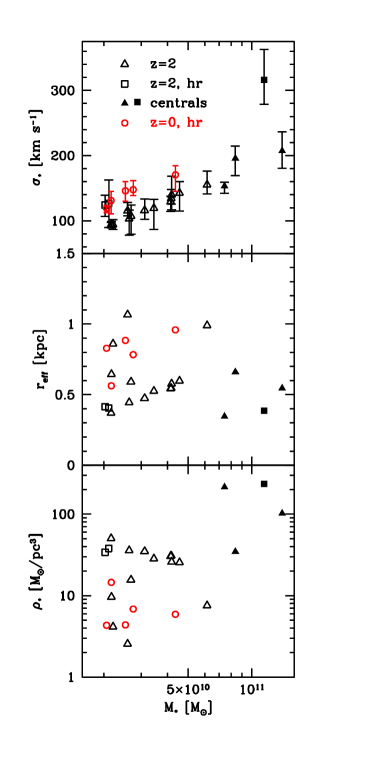
The 16 massive galaxies identified at redshift 2 (6 galaxies in G1, 3 in G2, and 7 in G3) form loose associations with maximal distances between the most massive and any other selected galaxy of up to physical kpc222In this maximal case, G1, all but one of the selected galaxies were distributed along one of the main filaments. Only one of those galaxies lies within the virial radius of the main progenitor of one of the later central galaxies (in group G1). Fig. 1 shows the spread in properties (stellar mass and stellar velocity dispersion) of the selected galaxies. The galaxies have masses between and within the central (physical) kpc and velocity dispersions from to km/s within the effective radius with rather big errors (i.e., results are dependent on the line of sight). Note that also the degree of rotational support of those galaxies vary: one of the main progenitors showed a , whereas the other main progenitors are having values and many of the (especially the lower mass) galaxies reach values of (Fig. 3) and show a disc-type morphology. The gas content within the 10 kpc sphere lies between and for the later satellite galaxies, for the later central galaxies the gas fractions are for G1 and G3 and go down to in the case of early forming (see section 4.1) central object of G2. The most massive progenitor of the central object at of group G2 already reaches at redshift 2. This, combined with its high velocity dispersion and its small effective radius (see Fig. 2), makes this object similar to the observations by van Dokkum et al. (2009), although the galaxy formed in G2 shows smaller values of mass, velocity dispersion and effective radius. Note, that at redshift 2 none of the G2 satellites selected at redshift 0 (see section 3.3 has a stellar mass (as would be needed for selection at ). In fact, all of those satellites have stellar masses already at , see Fig. 2.
3.2 The time evolution of massive galaxies selected at redshift 2
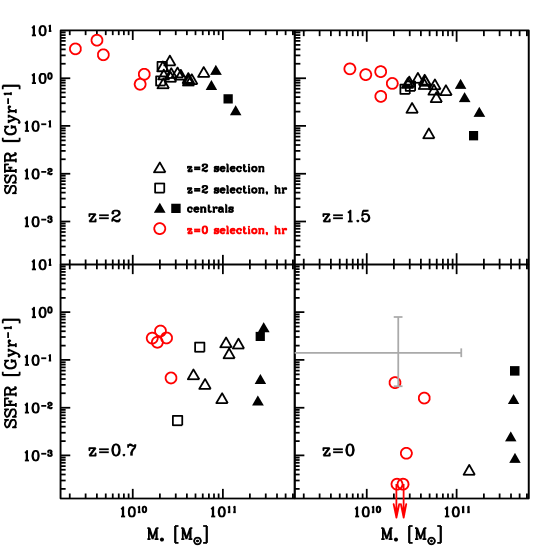
In all the simulations all of the massive galaxies selected at redshift 2 merge subsequently to one massive galaxy at redshift 0 in the respective simulation, with only one exception of one additional galaxy surviving. This is illustrated in Fig.2, where the evolutionary tracks of all the massive galaxies are shown: In group G1 and G2 all progenitors merge into the same object until redshift 0 whereas all but one galaxy in G3 merge to the massive central galaxy. The timescales for those mergers with the central object are mainly set by the initial distance (and orbit) from the central galaxy and given the low mass ratios between the primary and the secondary object () the dynamical friction time-scale is bound to be very short, even accounting for the effect of tidal mass loss, ( Gyr) (Taffoni et al. 2003). Therefore the infalling galaxies spiral in to the central in just one/two orbits after they enter the main halo. The only companion galaxy surviving to redshift zero does not merge because it forms far enough from the primary of group G3 to enter the virial radius only shortly before redshift zero. We note that those mergers are not completely dry despite the gas removal by tidal and ram pressure stripping: the massive galaxies merging to the central object are showing gas contents of to within the inner 10 kpc measured at the time when the distance between the main galaxy and the infalling secondary falls below kpc for the first time. When measured at the time when satellites enter for the first time the virial radius of the main object, the gas fractions are to , with satellites crossing the virial radius at high redshift showing the highest gas fractions and those entering late having the lowest ones. The low gas fractions might reflect the excessive star formation in the poorly resolved centres of the galaxies (see also F10). An excessive star formation is even more problematic in simulations adopting weak feedback. For example, Oser et al. (2010) argue that the weak feedback prescription used by Naab et al. (2007, 2009) artificially enhances gas consumption in all galaxies at early times and speculate that the inclusion of blastwave SN feedback such as ours would alleviate this problem. The presence of significant gas components in some of the satellites down to low redshift is a reassuring aspect of our simulations, although, owing to the use of a low star formation density threshold and a relatively low resolution in the gas phase relative to recent zoom-in simulations of lower mass objects (Guedes et al. 2011), the effect of feedback is likely still underestimated. To take the effects of excessive star formation in the poorly resolved centres of the galaxies into account, we show the specific star formation rates (SSFR) measured within a sphere of 10 kpc but excluding all the star formation occurring within the inner sphere with radius of one softening length (as in F10 and FCM11) in Fig. 4. In our sample of galaxies at redshifts and star formation is generally more efficient at higher redshift and for star forming galaxies ( Gyr-1) fairly constant versus mass at a given redshift (see e.g. Peng et al. 2010). The SSFR found at redshift 0 lie in the lower part of observational findings for the local Universe (Salim et al. 2007, see Fig. 4) and we note that at redshift 0 several galaxies have a very low SSFR and are basically not star forming anymore.
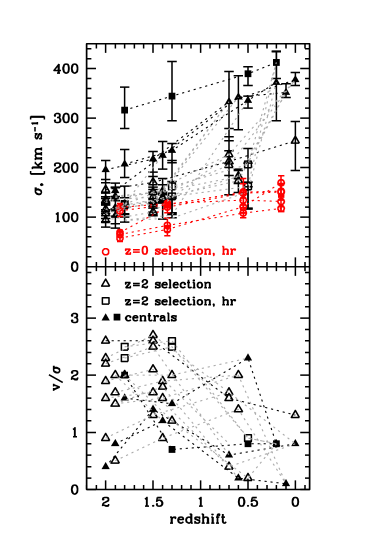
A high fraction of galaxies is highly rotationally supported (disc-like) at redshift 2 (see Fig. 3), similar as seen in observations of massive galaxies at (van der Wel et al. 2011). The amount of rotational support decreases over time for the simulated galaxies, likely due to mechanisms as mergers and tidal stirring. Tidal stirring, namely repeated tidal shocks due to close encounters with the central galaxy of the group (Mayer et al. 2001), begins to operate after galaxies have entered the virial radius of the main galaxy, see Fig. 3. Tidal stirring can only become effective after redshift 1.5, once a significant number of galaxies have entered the virial radius of the respective main galaxy (see also FCM11 for further environmental effects). While the fraction of highly rotationally supported (disc-like) objects is decreasing as the galaxies are falling into higher densities environments (which seems to agree with the observed morphology-density relation, e.g. Postman and Geller 1984, Goto et al. 2003) we caution that due to the selection of the galaxies fixed at redshift 2 (and since we neglect galaxies that cross the mass threshold at a later time) the derived fractions of various classes of rotational support are not directly comparable with observational mass-selected samples.
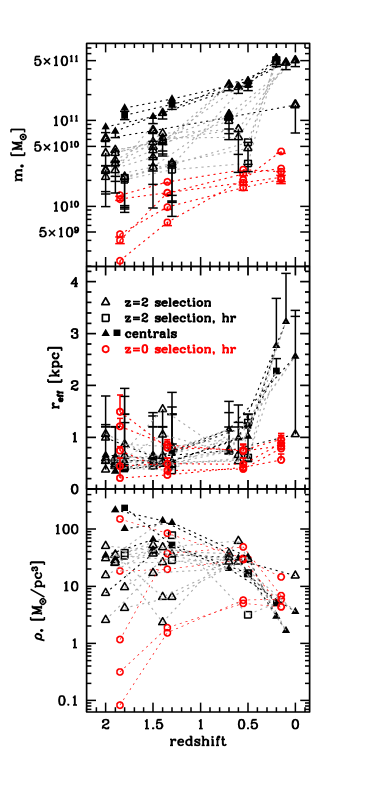
Fig. 2 and 3 show the evolution of stellar masses, effective radii, stellar densities, stellar velocity dispersions and rotational support ( measured for effective radius) at redshift 2, 1.5, 0.7 and 0. Fig. 2 demonstrates that the spread in mass in the progenitors of a factor at redshift 2 disappears and those galaxies evolve into a homogeneous (with respect to mass) population of central galaxies at redshift 0. The high-resolution run produces comparable masses as the standard run. The one object of G3 which does not merge with the central object grows in stellar mass as well but stays a factor of lower in mass.
All the main progenitors show an effective radius kpc (Fig. 2). Group G2 shows besides the massive central galaxy only two galaxies above the mass-cut at , both showing low velocity dispersion and low stellar mass. The effective radii of the central galaxies grow then significantly until redshift 0, mostly by acquiring a stellar envelope (see F10 and also Szomoru et al. 2011). While all three simulations end up with a central galaxy of similar mass at redshift 0 the evolutionary paths were rather different as shown in F10. The central galaxies of groups G1 and G3 both experienced two major galaxy mergers between and . Those major mergers add significant amounts of stellar mass to the central galaxies, see Fig. 7 in F10. The central galaxy of group G2 does not experience any major merger during that epoch and also not below . It grew from minor mergers and in situ star formation (see also Oser et al. 2011). In Fig. 3 the stellar velocity dispersions are shown. At redshift 2 the range in velocity dispersion covers a wide range from high stellar velocity dispersion for compact massive galaxies to values typical for intermediate ellipticals.
The galaxies are generally more compact (i.e. smaller effective radii and higher stellar velocity dispersion versus a given mass) than the local sample of quiescent galaxies in SDSS as shown by van de Sande et al. 2011 and follow more closely the observational data of (massive, compact) galaxies compiled by those authors (see also Newman et al. 2010). For the progenitor of today’s satellite population in simulation G2, see next section.
3.3 Tracing today’s satellites backwards in time
FCM11 found the progenitors of the satellite population to be discy, blue, gas-rich star forming galaxies, which have assembled half their mass as late as to . We find additionally, that the massive satellite population is less compact (has higher effective radii in the same mass bin, smaller effective densities and also have smaller maximal masses and smaller maximal velocity dispersions, see Fig. 1) than the massive galaxies selected at redshift 2. Tracing those satellites back in time shows that at redshift 1.5 the stellar masses of all those satellites were less (the mass threshold needed for selection at ) and two were less massive than (Fig. 2). At redshift 0 four out of the five are residing within the virial radius of the main object (one of these galaxies being at it apocenter outside ), whereas at none of them was within the virial radius of the main galaxy. At the progenitors of those satellites were forming by mostly “in situ” star formation (see also Oser et al. 2010) far away from the main galaxy at distances ranging from to times the virial radius (at from to times the virial radius) of the most massive galaxy, being farther away than the massive galaxies selected at redshift and also farther away than the turnaround radius at those times (, see Cupani et al. 2008). Therefore these galaxies fell in later333These galaxies seem to be part of a “second generation” of massive galaxies: forming later in the outskirts, thus reaching the central area of halo later. than the massive galaxies selected at redshift 2. Since the virial masses of the selected satellites are typically a factor 20 to 100 smaller than the one of the central galaxy, dynamical friction is then not strong enough to merge those satellites with the central (Taffoni et al. 2003) once they fell into the virial radius of the central and the satellites are predicted to settle into inner orbits. Note that at , especially for the low mass objects, the low number of stellar particles of those galaxies made the measurements the stellar velocity dispersion and effective radii less reliable than for the more massive galaxies. Also, some of these galaxies just formed and are about to collapse further (i.e., to smaller effective radii). These two effects become apparent especially in Fig. 2 where the large effective radii for low-mass objects increase the size of the parameter space substantially.
4 The role of formation time, numerical resolution and missing physics in shaping structural properties of galaxies
4.1 Formation time and compactness
We note that the most peculiar object in our sample, the most massive galaxy in the simulation G2 at (i.e. the most massive progenitor of the central object at ) is the most massive galaxy in our sample and also is the object in which star formation begins earlier than in any other galaxy, at (a statement independent on resolution since it is true in both the standard and high resolution simulation of G2). In groups G1 and G3 the objects which formed stars first did not merge until after to the later central object. Also, if the formation time of a galaxy is defined as the time when the object has acquired of its stellar mass at we find that massive galaxy in G2 forms the earliest, at , whereas the central objects of G1 and G3 form at . The choice of the 20% criterion is somewhat heuristic but appears to reflect conservatively the rate of stellar mass build up in the different galaxies (smaller reference mass fractions to define formation time highlight even more the correlation between stellar mass at and formation time). At the respective formation epoch the stars of the main galaxies can also be characterised as sitting at the deepest points of the potential well: a fraction of and of the main galaxy stars are among the of the stars having the lowest potential in the whole G1, G2 and G3 simulation, respectively.
After redshift the mass in the central kpc of the central galaxies stays roughly constant but their total mass increases by a factor of . The new stellar material is accreted (or formed in-situ) outside the central region (F10). Therefore the effective radii increase until . Another main mechanism for increasing the effective radius at work in the simulations are mergers, both minor and major, as described in Naab et al. (2009). Typically our massive satellites, after a first decrease of the effective radius during the formation phase, undergo an increase of size owing to all the mechanisms just mentioned, except that mergers play a more important role in the most massive progenitors of the central galaxy. Furthermore, since the satellites selected at merge with the central galaxy, and the galaxies selected at do not have enough time to grow until due to their late formation, the overall effect of the various mechanisms behind size growth is weaker than in the centrals.
4.2 Resolution tests and potential additional physics
The results presented in the last section might be affected by missing numerical resolution (our standard runs do not quite reach the number of particles needed for convergence as suggested in Naab et al. (2007) but the high-resolution run does). Stellar velocity dispersion can in principle be inflated by two-body heating from massive halo particles, but can also be lowered by a larger softening length (as it might be the case when comparing G2 at standard and high resolution). Also, all cosmological simulations of galaxy formation are suffering from e.g. artificial angular momentum loss since galaxy progenitors at high-z are poorly resolved (Kaufmann et al. 2007); this could lead to an artificially increased velocity dispersion and higher central densities. The only cosmological simulation existing to date that satisfies the resolution criteria of Kaufmann et al. (2007) is the ERIS simulation (Guedes et al. 2011) which however follows the formation of a galaxy in a halo almost 30 times less massive that those considered here. On the other hand the star formation and feedback parameters have been kept fixed while increasing the resolution, while recent results on smaller mass scales show that central densities are influenced by the appropriate choice of these parameters, in particular the star formation density threshold (see e.g. Governato et al. 2010, Guedes et al. 2011). Comparing the results of our standard G2 simulation with the high resolution G2 run we found that the mass of the respective objects agree quite well (Fig. 2) but the velocity dispersion in the high resolution run was found to be somewhat larger () and the effective radius smaller ( than in the standard run measured at . This shows that, if anything, we are erring on the side of underestimating the compactness of our galaxies, and suggests that we are not dominated by numerical angular momentum loss but rather by e..g. softening, that tends to reduce densities and typical central velocities. Most importantly, since all these effects will be present mostly at high z, we argue that the trends versus time identified in this work are fairly robust.
Additional physical effects not implemented in our simulations, such as feedback from active galactic nuclei (AGN), might play an important role in the formation of massive galaxies, especially for more massive systems than the ones studied here (Naab et al. 2007, Teyssier et al. 2011). F10 argue against the a major role of AGN feedback at the mass of groups because early-type galaxies at have global properties close to those of observed galaxies, with only central densities and total stellar masses somewhat on the high side relative to typical observed early-types. A mild effect of AGN feedback, which mostly self-regulates star formation at the centre but does not drive strong baryonic outflows, might be enough to solve the problem. Such a scenario might be the closest to reality, perhaps more realistic than the popular ”quasar mode” feedback, according to recent galaxy simulations that implement directly radiative transfer of the X-ray and ionising radiation released as a result of accretion onto the central AGN (Kim et al. 2011). A very high resolution cosmological simulation with the inclusion of an educated model of AGN feedback, along with more realistic modelling of the multi-phase interstellar medium and subsequent star formation processes (Robertson & Kravtsov 2008), will be needed to really assess the importance of AGN feedback in the evolution of early-type galaxies.
5 Summary and Conclusions
We analysed three ”zoom-in” cosmological simulations where the main haloes have final virial masses of and host a massive central early-type galaxy at (F10). We identified 16 massive galaxies at high redshift in those three simulations, which fall into the main halos sooner or later. We showed that at redshift the population of massive galaxies is very diverse in terms of mass, velocity dispersion and effective radius. A high fraction of them has significant rotation, is disk-like and gas-rich, lending theoretical support to the observational results by van der Wel et al. (2011), who argue that the majority of the compact massive galaxies at are disc dominated based on the shapes inferred from the photometry (see also Genzel et al. 2006; 2008). In particular, the main progenitors of the central galaxies at are objects with a sizable disc component; all but one of the galaxies have a mean at .
The population of galaxies at comprises relatively massive members (from to ) living in over-dense, yet unbound associations of order a Mpc in size that will later assemble the potential of a virialised group (for detailed results on the central objects see F10). While we find one compact, massive object resembling the extreme galaxy described in van Dokkum et al. (2009) no galaxy with low velocity dispersion and large effective radius comparable to typical early type galaxies at low redshift, or to the object described in Onodera et al. (2010), has been identified in our sample at . Despite the diversity in properties, masses and merger histories of the galaxies in the sample at , the central galaxies at , which are assembled partly by merging and interactions between the progenitors and partly by accretion of gas and in situ star formation, at end up roughly with the same stellar mass, a few , and with relatively similar morphologies (F10).
In all the three simulations only the most massive progenitor survives until , since the other massive galaxies identified at merge with it (with the exception of simulation G3 where one additional galaxy survives). The massive satellites selected at (less compact than their counterparts) were not physically associated with the massive galaxies at since they became bound to the growing group potential later on (their stellar mass also crossed our threshold for selection much later).
Our findings suggest that is not surprising that today’s massive galaxy population is generally less compact than a population of similar stellar mass at ; the compact population identified at simply does not exist anymore today and no new galaxies form with similar structural properties in the meantime. They either became the most massive, central galaxy (several mechanisms as mergers, acquisition of a stellar envelope can increase the radii of such galaxies) or they merged with the central object. Today’s massive satellite population formed later far from the central galaxy (at a distance corresponding to times its virial radius at ) and with relatively small masses that yield long dynamical friction times, preventing merging with the central galaxy. Moreover, they form at a time where typical characteristic densities at virialisation are much lower than for galaxies already in place at , which naturally explains their typical characteristic densities.
Also the observed spread in velocity dispersion of massive galaxies at high redshift is easily understandable in a CDM Universe since galaxies at e.g. might be at different points in assembling a substantial fraction of their final mass. This is mostly the result of the different assembly history of the central galaxies at , which is the criterion that we originally used in F10 to select the candidate halos at a given mass scale at to re-simulate at higher resolution with the zoom-in technique.
These findings are in agreement with the picture of a diverse population of massive galaxies at put forward by the observational work of van Dokkum et al. (2011). Similarly, the results of our simulations are along the lines of the findings of Cassata et al. (2011)(massive passively evolving early-type galaxies form compact for redshifts , growing later in size, and late forming early-type galaxies are larger444Note, that the majority of our massive galaxies are still forming stars at high redshift.). We also note that our results on the size growth of the central galaxies ( at ) agree with the observational findings of Carollo et al. (in preparation) and also with the simulation work of Oser et al. (2011). However, we argue that our work discusses massive galaxy evolution in a more typical setting than the latter, since by choosing a group environment rather than field objects we have been able to study the evolution of massive galaxies that are not centrals, either at high or low redshifts, an evolution that is driven by environmental effects. For a population of field galaxies we do not expect a similar growth in the average size of the population to occur (due to destruction of the compact population by merging) simply because the average merger rate should be lower for field objects. Such an environmental dependence of the mass-size relation has already been suggested by observational work (Raichoor et al. 2011, Cooper et al. 2011). Therefore, our work and that of Oser et al. (2011) can be viewed as complimentary.
While our results do not reflect a statistical analysis of thousands of galaxies we argue that they should be fairly general for relatively dense environments. Indeed the three simulations were chosen to have different merger histories and larger scale environments, ranging from G1 being an isolated group in the cosmic web to G3 having a nearby cluster and two other virialised groups within 5 Mpc (F10). Most importantly, haloes at the mass scale are fairly representative of dense environments at low redshift, namely the environments in which massive galaxies are more common (see Eke et al. 2004). The number density for haloes with masses to is Mpc-3 based on the works of Macciò et al. (2007). For comparison, the number density for all cluster-sized haloes with is only Mpc-3 (and Mpc-3).
All the ultra massive galaxies () in our sample, as well as in the Oser et al. (2011) sample, were compact at , and no object at has been observed in those two samples with properties similar to local giant ellipticals, like the object described in Onodera et al. (2010). We argue that we miss such a galaxy in our sample because of the selection imposed by our halo mass scale at . We speculate that the ultra massive extended galaxies might be born earlier in halos of even higher masses. They would therefore begin to grow in mass and size earlier and develop lower concentrations by (the galaxy in Onodera et al. 2010) has indeed has a stellar mass higher than that of our sample at ). Such galaxies should end up in the cluster potentials at . A future test of this idea would be a comparison of the number density of, respectively, dense giant ellipticals and extended giant ellipticals at redshift , with the number densities of, respectively, group and cluster haloes in a CDM universe.
Acknowledgements
T. K. acknowledges financial support from the Swiss National Science Foundation (SNF).
References
- Bertschinger (1995) Bertschinger, E. 1995, arXiv:astro-ph/9506070
- Bertschinger (2001) Bertschinger, E. 2001, ApJS, 137, 1
- Bezanson et al. (2009) Bezanson, R., van Dokkum, P. G., Tal, T., Marchesini, D., Kriek, M., Franx, M., & Coppi, P. 2009, ApJ, 697, 1290
- Bluck et al. (2011) Bluck, A. F. L., Conselice, C. J., Buitrago, F., et al. 2011, arXiv:1111.5662
- Brooks (2010) Brooks, A. 2010, New Horizons in Astronomy: Frank N. Bash Symposium 2009, 432, 17
- Cappellari et al. (2009) Cappellari, M., et al. 2009, ApJ, 704, L34
- Cassata et al. (2011) Cassata, P., et al. 2011, arXiv:1106.4308
- Cooper et al. (2011) Cooper, M. C., Griffith, R. L., Newman, J. A., et al. 2011, MNRAS, 1893
- Cupani et al. (2008) Cupani, G., Mezzetti, M., & Mardirossian, F. 2008, MNRAS, 390, 645
- Daddi et al. (2005) Daddi, E., et al. 2005, ApJ, 626, 680
- Eke et al. (2004) Eke, V. R., Baugh, C. M., Cole, S., et al. 2004, MNRAS, 348, 866
- Feldmann et al. (2010) Feldmann, R., Carollo, C. M., Mayer, L., Renzini, A., Lake, G., Quinn, T., Stinson, G. S., & Yepes, G. 2010, ApJ, 709, 218
- Feldmann et al. (2011) Feldmann, R., Carollo, C. M., & Mayer, L. 2011, ApJ, 736, 88
- Genzel et al. (2006) Genzel, R., et al. 2006, Nature, 442, 786
- Genzel et al. (2008) Genzel, R., et al. 2008, ApJ, 687, 59
- Governato et al. (2010) Governato, F., et al. 2010, Nature, 463, 203
- Goto et al. (2003) Goto, T., Yamauchi, C., Fujita, Y., Okamura, S., Sekiguchi, M., Smail, I., Bernardi, M., & Gomez, P. L. 2003, MNRAS, 346, 601
- Guedes et al. (2011) Guedes, J., Callegari, S., Madau, P., & Mayer, L. 2011, arXiv:1103.6030
- Hahn et al. (2007) Hahn, O., Porciani, C., Carollo, C. M., & Dekel, A. 2007, MNRAS, 375, 489
- Hopkins et al. (2010) Hopkins, P. F., Bundy, K., Hernquist, L., Wuyts, S., & Cox, T. J. 2010, MNRAS, 401, 1099
- Kaufmann et al. (2007) Kaufmann, T., Mayer, L., Wadsley, J., Stadel, J., & Moore, B. 2007, MNRAS, 375, 53
- Kennicutt (1998) Kennicutt, R. C., Jr., 1998, ApJ, 498, 541
- Khochfar & Silk (2006) Khochfar, S., & Silk, J. 2006, ApJ, 648, L21
- Kim et al. (2011) Kim, J.-h., Wise, J. H., Alvarez, M. A., & Abel, T. 2011, ApJ, 738, 54
- Macciò et al. (2007) Macciò, A. V., Dutton, A. A., van den Bosch, F. C., Moore, B., Potter, D., & Stadel, J. 2007, MNRAS, 378, 55
- Mancini et al. (2010) Mancini, C., et al. 2010, MNRAS, 401, 933
- Mayer et al. (2001) Mayer, L., Governato, F., Colpi, M., Moore, B., Quinn, T., Wadsley, J., Stadel, J., & Lake, G. 2001, ApJ, 547, L123
- Mayer et al. (2008) Mayer, L., Governato, F., & Kaufmann, T. 2008, Advanced Science Letters, 1, 7
- Mármol-Queraltó et al. (2012) Mármol-Queraltó, E., Trujillo, I., Pérez-González, P. G., Varela, J., & Barro, G. 2012, arXiv:1201.2414
- McKee & Ostriker (1977) McKee, C. F., & Ostriker, J. P. 1977, ApJ, 218, 148
- Miller & Scalo (1979) Miller, G. E., & Scalo, J. M. 1979, ApJS, 41, 513
- Naab et al. (2007) Naab, T., Johansson, P. H., Ostriker, J. P., & Efstathiou, G. 2007, ApJ, 658, 710
- Naab et al. (2009) Naab, T., Johansson, P. H., & Ostriker, J. P. 2009, ApJ, 699, L178
- Newman et al. (2010) Newman, A. B., Ellis, R. S., Treu, T., & Bundy, K. 2010, ApJ, 717, L103
- Newman et al. (2011) Newman, A. B., Ellis, R. S., Bundy, K., & Treu, T. 2011, arXiv:1110.1637
- Onodera et al. (2010) Onodera, M., Daddi, E., Gobat, R., et al. 2010, ApJ, 715, L6
- Oser et al. (2010) Oser, L., Ostriker, J. P., Naab, T., Johansson, P. H., & Burkert, A. 2010, ApJ, 725, 2312
- Oser et al. (2011) Oser, L., Naab, T., Ostriker, J. P., & Johansson, P. H. 2011, arXiv:1106.5490
- Peng et al. (2010) Peng, Y.-j., et al. 2010, ApJ, 721, 193
- Postman & Geller (1984) Postman, M., & Geller, M. J. 1984, ApJ, 281, 95
- Raichoor et al. (2011) Raichoor, A., Mei, S., Stanford, S. A., et al. 2011, arXiv:1109.0284
- Robertson & Kravtsov (2008) Robertson, B. E., & Kravtsov, A. V. 2008, ApJ, 680, 1083
- Salim et al. (2007) Salim, S., et al. 2007, ApJS, 173, 267
- Spergel et al. (2007) Spergel, D. N., et al. 2007, ApJS, 170, 377
- (45) Stadel J., 2001, PhD Thesis, U. Washington
- Stinson et al. (2006) Stinson, G., Seth, A., Katz, N., Wadsley, J., Governato, F., & Quinn, T. 2006, MNRAS, 373, 1074
- Szomoru et al. (2010) Szomoru, D., et al. 2010, ApJ, 714, L244
- Szomoru et al. (2011) Szomoru, D., Franx, M., & van Dokkum, P. G. 2011, arXiv:1111.3361
- Taffoni et al. (2003) Taffoni, G., Mayer, L., Colpi, M., & Governato, F. 2003, MNRAS, 341, 434
- Teyssier et al. (2011) Teyssier, R., Moore, B., Martizzi, D., Dubois, Y., & Mayer, L. 2011, MNRAS, 414, 195
- van der Wel et al. (2011) van der Wel, A., et al. 2011, ApJ, 730, 38
- van de Sande et al. (2011) van de Sande, J., Kriek, M., Franx, M., et al. 2011, ApJ, 736, L9
- van Dokkum et al. (2009) van Dokkum, P. G., Kriek, M., & Franx, M. 2009, Nature, 460, 717
- van Dokkum et al. (2011) van Dokkum, P. G., Brammer, G., Fumagalli, M., et al. 2011, arXiv:1108.6060
- (55) Wadsley J., Stadel J., Quinn T., 2004, NewA, 9, 137
- Whitaker et al. (2011) Whitaker, K. E., Kriek, M., van Dokkum, P. G., et al. 2011, arXiv:1112.0313
- York et al. (2000) York, D. G., et al. 2000, AJ, 120, 1579