High spin band structures in doubly-odd 194Tl
Abstract
The high-spin states in odd-odd 194Tl nucleus have been studied by populating them using the 185,187Re(13C, xn) reactions at 75 MeV of beam energy. A coincidence measurement has been performed using the INGA array with a digital data acquisition system to record the time stamped data. Definite spin-parity assignment of the levels was made from the DCO ratio and the IPDCO ratio measurements. The level scheme of 194Tl has been extended up to 4.1 MeV in excitation energy including 19 new -ray transitions. The band, in the neighboring odd-odd Tl isotopes show very similar properties in both experimental observables and calculated shapes. Two new band structures, with 6-quasiparticle configuration, have been observed for the first time in 194Tl. One of these bands has the characteristics of a magnetic rotational band. Cranked shell model calculations, using a deformed Woods-Saxon potential, have been performed to obtain the total Routhian surfaces in order to study the shapes of the bands and the band crossing in 194Tl. The semiclassical formalism has been used to describe the magnetic rotational band.
pacs:
21.10.Re; 23.20.Lv; 23.20.En; 21.60.Cs; 27.80.+wI Introduction
The Thallium nuclei, with proton number Z = 81, are situated in a transition region between the deformed prolate rare earth nuclei and the spherical lead nuclei at Z = 82. The proton Fermi level in Tl lies below the Z = 82 shell closure and near the 2s1/2 orbtal. The ground state spin-parity of the heavier odd-A Thalium isotopes, are accordingly, 1/2+ odd-Tl1 ; odd-Tl2 ; odd-Tl3 . However, the intruder 9/2-[505] and 1/2-[541] Nilsson states, originating from the h9/2 orbital above Z = 82, are also available near the Fermi surface for oblate and prolate deformations, respectively. The experimental evidence comes from the observation of a low lying 9/2- isomeric state and strongly coupled rotational bands built on this in the odd-A Thalium isotopes odd-Tl4 ; 1 ; 2 ; 3 ; 4 . The neutron Fermi surface, for the Tl and Hg isotopes in the region lie near the top of the orbital and decoupled bands with this configuration have been identified in odd-A Hg (Z = 80) isotopes in this region 5 ; 6 . Therefore, in even-mass Tl isotopes in this region, collective rotational bands based on the configuration are expected. Such bands have been experimentally observed in a few odd-odd Tl isotopes 7 ; 8 ; 9 ; 10 ; 11 ; 12 ; 13 . But in most of the cases, there are ambiguities on level energies, spins and parities. Recently, experimental studies on the structures of 190Tl 7 and 198Tl 13 have been reported with definite spin-parity assignment of the band. In 190Tl, this band, which shows a low spin signature inversion, was reported to have an oblate structure. Whereas in 198Tl, the possible chiral structure associated with this band was interpreted with a triaxial deformation. Therefore, in order to understand the possible transition from oblate to triaxial shape induced by the change in the neutron Fermi surface of Tl nuclei, it is important to chracterize the band systematically in an isotopic chain. But the high spin data on the other odd-odd Tl nuclei are scarce. Moreover, both the protons and the neutrons occupy high-j orbitals so, different kinds of collective and single particle excitations, like magnetic rotation, are expected. Although several magnetic rotational bands have been observed in Pb and Hg nuclei in this region 14 ; 15 , no such bands are reported for Tl isotopes.
The knowledge of high spin states in 194Tl was very limited prior to the present work although several superdeformed bands have been reported for this nucleus by F. Azaiez et al., but these bands were not connected with the normal deformed bands aza90 ; aza91 . The normal deformed high spin states in 194Tl were studied by Kreiner et al. 9 and a level scheme was obtained using two Ge(Li) detectors. Although indication of rotatonal bands based on the configuration was reported in that work, no definite spin-parity assignments could be done. Possible observation of chiral partner bands in 194Tl has been claimed recently 194Tl2009 but no such level scheme has been reported till date. In this work, we have studied the -ray spectroscopy of 194Tl with the aim, in particular, to compare the band structures in odd-odd Tl isotopes and to search for a possible magnetic rotational band.
II Experimental Method and Data Analysis
The -ray spectroscopy of 194Tl has been studied at 14-UD BARC-TIFR Pelletron at Mumbai, India using the Indian National Gamma Array (INGA). The INGA consisted of 15 clover HPGe detectors with BGO anti-Compton shields at the time of the experiment. The excited states of 194Tl were populated by fusion evaporation reactions 185,187Re(13C, xn)194Tl at the beam energy of 75 MeV. The target was a thick (18.5 mg/cm2) natural rhenium target. The recoils were stopped inside the target. The isotopic ratio of 185Re and 187Re in the natural rhenium is 37:63. According to the PACE-IV calculations, the 4n and 5n channels are the dominant ones at the beam energies encompassed inside the target in this experiment. The beam energy at the exit of the target was calculated to be below the coulomb barrier. The clover detectors were arranged in six angles with 2 clovers each at 40∘ and 65∘ while four clovers were at 90∘ and three were at -23∘ angles. The average count rate in each crystal was limited to 4k/sec. The clover detectors were calibrated for ray energies and efficiencies by using 133Ba and 152Eu radioactive sources.
Recently, a digital data acquisition (DDAQ) system, based on Pixie-16 modules developed by XIA LLC ta08 , has been adopted for the INGA. This system has provision for the digitization of 96 channels of 24 clover detectors (maximum number of clover detectors that can be put in INGA) with 100 MHz sampling rate. This DDAQ system was used in the present experiment for the data collection. Time stamped data were collected when at least two clovers (Compton suppressed) were fired in coincidence. A time window of 150 ns was set for this coincidence between the fast triggers of individual channels and the coincidence trigger was kept open for 1.5 s. The BGO signals from the anti-Compton shields of the respective clovers were used for vetoing the individual channels. The detailed description of the DDAQ has been given in the Refs. dsp1 ; dsp2 .
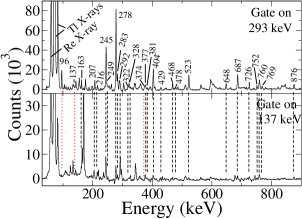
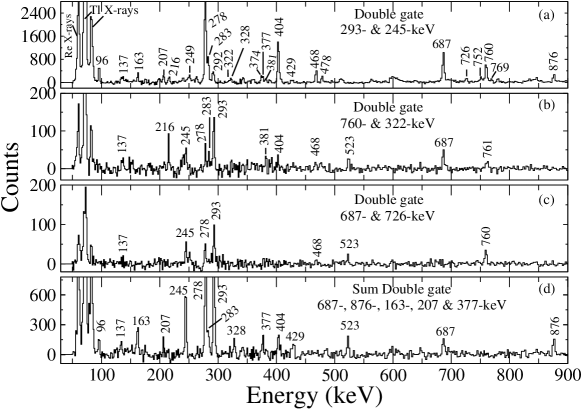
The data sorting routine “Multi pARameter time-stamped based COincidence Search program (MARCOS)” developed at TIFR, sorts the time stamped data to generate a - matrix and a -- cube in a Radware compatible format for further analysis. To construct these, a coincidence time window of 400 ns was selected. The RADWARE software 16 was used for the analysis of the matrix and the cube. The - matrix contained about 2.4 109 coincidence events. To construct the level scheme of 194Tl, the coincidence and the intensity relations of the rays were used. Gates were put on the known -ray transitions for determining the coincidence relations. Single and double gated -ray spectra from the - matrix and -- cube are shown in Figs. 1 and 2, respectively. The relevance of these spectra in the level scheme will be discussed in the next section. The intensity of the rays were obtained from the - matrix using a single gated spectrum.
The multipolarities of the -ray transitions have been determined from the angular correlation analysis using the method of directional correlation from the oriented states (DCO) ratio, following the prescriptions of Krämer-Flecken et al.17 . For the DCO ratio analysis, the coincidence events were sorted into an asymmetry matrix with data from the 90∘ detectors () on one axis and -23∘ detectors () on the other axis. The DCO ratios (for the ray , gated by a ray of known multipolarity) are obtained from the intensities of the rays (Iγ) at two angles and , as
| (1) |
By putting gates on the transitions with known multipolarity along the two axes of the above matrix, the DCO ratios are obtained for each ray. For stretched transitions, the value of RDCO would be close to unity for the same multipolarity of and . For different multipolarities and mixed transition, the value of RDCO depends on the detector angles ( and ) and the mixing ratio (). The validity of the RDCO measurements was checked with the known transitions in 194Tl and with the calculated values. In the present geometry, the calculated value of RDCO angcor for a pure dipole transition gated by a stretched quadrupole transition is 1.65 while for a quadrupole transition gated by a pure dipole, the calculated value is 0.61. These compare well with the experimental values of 1.69(3) and 0.58(2), respectively, for the known pure dipole (293-keV, ) and stretched quadrupole (687-keV, ) transitions.
The use of clover HPGe detectors allowed us to assign definite parities to the excited states from the measurement of the integrated polarization asymmetry (IPDCO) ratio, as described in 18 ; 19 , from the parallel and perpendicular scattering of a -ray photon inside the detector medium. The IPDCO ratio measurement gives a qualitative idea about the type of the transitions (). The IPDCO asymmetry parameters have been deduced using the relation,
| (2) |
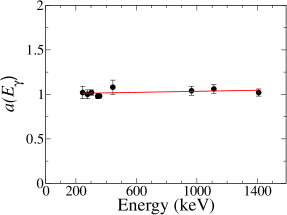
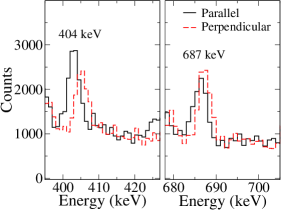
where and are the counts for the actual Compton scattered rays in the planes parallel and perpendicular to the reaction plane. The correction due to the asymmetry in the array and response of the clover segments, defined by ) = , was checked using 152Eu and 133Ba sources and was found to be 1.004(1); which is close to unity, as expected. The data of ) and the fitting are shown in Fig. 3. By using the fitted parameter ), the of the rays in 194Tl have been determined. A positive value of indicates an electric type transition where as a negative value favors a magnetic type transition. The could not be measured for the low energy and weaker transitions. The low energy cut off for the polarization measurement was about 200 keV, in this work. The validity of the method of the IPDCO measurements was confirmed from the known transitions in 194Tl. The parallel () and perpendicular ()*) count for two rays in 194Tl are shown in Fig. 4. It shows that the magnetic (404-keV) and the electric (687-keV) transitions can easily be identified.
II.1 Experimental Results
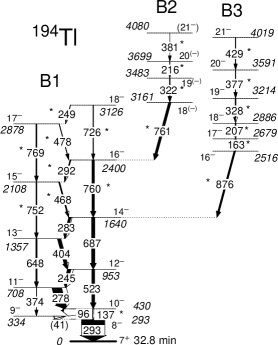
The level scheme of 194Tl, as obtained in the present work, is shown in Fig. 5. A total of 19 new rays have been found and placed in the level scheme. They are marked as “*” in the level scheme of Fig. 5. The deduced excitation energy, spin and parity of the excited levels and the multipolarity of the rays, together with the other relevent information concerning their placement in the proposed level scheme of 194Tl, are summarized in Table I.
| 111Relative -ray intensities normalized to 100 for the 293.1-keV ray. | Deduced | |||||
| (keV) | (keV) | Multipolarity | ||||
| 96.1(1) | 430.0 | 5.95(9) | 1.59(17)222From 686.7-keV () DCO gate. | - | M1+E2 | |
| 136.9(2) | 430.0 | 2.73(6) | 0.96(14)222From 686.7-keV () DCO gate. | - | E2 | |
| 162.5(1) | 2679.0 | 2.24(4) | 1.67(20)222From 686.7-keV () DCO gate. | - | M1 | |
| 207.1(1) | 2886.1 | 2.16(4) | 1.72(18)222From 686.7-keV () DCO gate. | - | M1 | |
| 215.5(2) | 3698.6 | 1.40(2) | 1.51(14)222From 686.7-keV () DCO gate. | - | M1+E2 | |
| 244.9(1) | 953.2 | 14.92(41) | 1.61(5)222From 686.7-keV () DCO gate. | -0.10(2) | M1(+E2) | |
| 248.6(3) | 3125.5 | 0.94(2) | 1.64(19)222From 686.7-keV () DCO gate. | -0.13(10) | M1+E2 | |
| 278.4(1) | 708.4 | 41.86(62) | 1.62(3)222From 686.7-keV () DCO gate. | -0.14(1) | M1(+E2) | |
| 283.2(1) | 1640.0 | 10.00(15) | 1.85(14)333From 648.3-keV () DCO gate. | -0.24(4) | M1(+E2) | |
| 291.9(2) | 2399.6 | 3.06(7) | 1.46(10)444From 293.1-keV () DCO gate. | - | M1+E2 | |
| 293.1(1) | 293.1 | 100.0(4) | 1.69(3)222From 686.7-keV () DCO gate. | 0.07(2) | E1 | |
| 322.2(1) | 3483.0 | 2.04(6) | 1.13(9)444From 293.1-keV () DCO gate. | - | M1+E2 | |
| 327.7(2) | 3213.8 | 3.37(5) | 1.71(23)222From 686.7-keV () DCO gate. | -0.25(6) | M1 | |
| 373.8(2) | 708.4 | 1.17(4) | 0.95(14)222From 686.7-keV () DCO gate. | - | E2 | |
| 376.9(1) | 3590.7 | 1.91(5) | 1.67(21)222From 686.7-keV () DCO gate. | -0.22(8) | M1 | |
| 381.3(2) | 4079.8 | ) | 0.40(4) | - | - | - |
| 403.5(1) | 1356.7 | 12.67(19) | 1.85(5)444From 293.1-keV () DCO gate. | -0.05(2) | M1+E2 | |
| 428.6(2) | 4019.3 | 1.03(2) | 1.69(37)222From 686.7-keV () DCO gate. | - | M1 | |
| 468.4(1) | 2108.5 | 4.13(7) | 1.50(7)222From 686.7-keV () DCO gate. | -0.20(8) | M1+E2 | |
| 478.3(2) | 2877.6 | 1.70(3) | 1.73(24)222From 686.7-keV () DCO gate. | -0.13(10) | M1+E2 | |
| 523.1(1) | 953.2 | 11.87(18) | 0.68(2)444From 293.1-keV () DCO gate. | 0.08(3) | E2 | |
| 648.3(1) | 1356.7 | 5.42(8) | 0.65(4)444From 293.1-keV () DCO gate. | 0.39(5) | E2 | |
| 686.7(1) | 1640.0 | 13.62(20) | 0.58(2)444From 293.1-keV () DCO gate. | 0.08(4) | E2 | |
| 725.8(3) | 3125.5 | 2.27(6) | 0.57(6)444From 293.1-keV () DCO gate. | - | E2 | |
| 751.8(2) | 2108.5 | 3.80(6) | 0.54(4)444From 293.1-keV () DCO gate. | 0.27(8) | E2 | |
| 759.5(2) | 2399.6 | 10.84(24) | 1.03(14)555From 725.8-keV () DCO gate. | 0.30(10) | E2 | |
| 761.1(2) | 3160.8 | 10.23(43) | 0.58(9)666From 468.4-keV () DCO gate. | - | E2 | |
| 769.1(2) | 2877.6 | 3.87(6) | 0.68(3)444From 293.1-keV () DCO gate. | 0.07(4) | E2 | |
| 876.4(1) | 2516.4 | 6.90(11) | 0.67(4)444From 293.1-keV () DCO gate. | 0.11(3) | E2 |
The 2- ground state (not shown in Fig. 5) and the 7+ isomeric state, (T32.8 min) were known in 194Tl from the beta decay studies ensdf . No -ray transition was known to decay from the isomeric state. The excitation energy of this state was also not known. Both the ground and the isomeric states decay by electron capture decay. The excitation energies of the states, in the level scheme presented in Fig. 5, have been given with respect to the 7+ isomeric state as was presented in Refs. 7 ; 13 for 190,198Tl. In the present work, the level scheme of 194Tl has been extended up to an excitation energy of MeV and (21-) spin and is a much improved one compared to the previouly known level scheme reported in Ref. 9 . The proposed level scheme is based on the following arguments.
A 293-keV ray from the 8- to the 7+ isomeric state in 194Tl was known, from the systematics of the Tl isotopes, to be a hindered E1 transition. The DCO ratio and the positive value of the IPDCO ratio, obtained in the present work, confirm this assignment. A 137-keV ray has been observed in the present work which is in coincidence with the known 293-keV transition from the 8- to the 7+ state as can be seen from Fig. 1 (top panel). A spectrum gated by this 137-keV line, shown in the bottom panel of Fig. 1, shows all the rays in 194Tl present in the 293-keV gated spectrum, except for the lines at 96 keV and 374 keV. This ray is also observed in the double gated spectra shown in Fig. 2. This clearly indicates that there is a 137 keV -ray transition above the 293-keV transition and in parallel to the 96-keV transition. It established the 334-keV level as the previously unknown energy upon which the rest of the band is built. The DCO ratio for the 137-keV ray has been measured in this work gated by the 687-keV ray which was known to be a quadrupole () transition 9 . The value of this ratio comes out to be close to unity (see Table-I) indicating the stretched quadrupole nature of the 137-keV transition. Although, the energy of this ray is too low for the IPDCO measurement but the M2 assignment for this low-energy transition may be completely ruled out from the lifetime consideration. Therefore, considering the 137-keV ray as an transition, spin and parity of the 430-keV level has been assigned, in this work, as 10-. The 374-keV ray was reported as a tentative one in Ref.9 . The double gated spectrum of 293- and 245-keV shown in Fig. 2(a) has a peak at 374 keV which confirms its placement. The nature of this transition is also evident from the measured RDCO value (close to unity) gated by a known transition. The placement of the above rays indicates that there should be a 41-keV transition from the 9- to the 8- state. This low energy highly converted () transition has not been observed in this work as our experimental set up was not suited to detect such transitions.
It can be seen from Fig. 2(a) that all the rays reported in Ref. 9 have been observed in the present work up to the 1640-keV state. However, the 748.6-, 741.9-, 458.6-, 289.4- keV rays, reported in Ref. 9 and placed above the 1640-keV state, were not observed. Instead, we have observed a cascade of 468-, 292-, 478- and 249-keV rays above the 1640-keV state along with the cross-over transitions. These rays have been placed above the 687-keV ray in band B1 as they satisfy the corresponding coincidence relations. It may be pointed out that a more efficient experimental set up was used in the present work than the earlier work. With the observation of these transitions, the negative parity ground band B1 has been extended up to an excitation energy of 3.13 MeV and a spin of 18.
We have also observed two other band like structures B2 and B3, for the first time in 194Tl. They are placed above the 16- and the 14- states of the band B1, respectively. The lines belonging to these bands have been seen in the single and double gated spectra shown in Fig. 1 and Fig. 2(a). The spectrum in Fig. 2(b) (double gate on 760- and 322-keV) shows the rays belonging to the band B2. The spectrum also shows the 761-keV ray, indicating its double placement. The 687-keV line is observed in this spectrum but not the 726-keV line. The 216- and the 381-keV rays, belonging to this band, are also observed in this spectrum. The double gated spectrum of 687- and 726-keV [Fig. 2(c)] shows the 760-keV line, slightly lower in energy than the one in Fig. 2(b). Therefore, the higher energy transition (i.e 761-keV) of the 760-keV doublet has been assigned as the linking transition between the bands B2 and B1. Therefore, the lower energy transition (i.e 760-keV) of the doublet corresponds to the member of the band B1. The 216-, 322- and 381-keV rays are not observed in the spectrum of Fig. 2(c) and hence, they form the members of the band B2.
To get an unambiguous value for the DCO ratios for the 760-and 761-keV transitions, the gating transitions were selected carefully. The DCO ratio values of the doublet cannot be distinguised for any choice of a pure gating transition below the 14- level. However, in the 468-keV gate, the 760-keV transition (in the band B1) would be absent and an unambiguous value of DCO ratio can be obtained for the 761-keV linking transition. The 468-keV transition has been found to be an transition with very little or no admixture from the negative value of its IPDCO ratio. So, the 468-keV dipole transition was chosen to obtain the DCO ratio of the 761-keV linking transition and similarly, the 726-keV quadrupole transition has been chosen as the gating transition to obtain the DCO ratio value of the 760-keV in-band transition. The DCO ratios of the 760- and 761-keV transitions, obtained in this way, suggest that both of them are quadrupole transitions. The IPDCO ratio, measured for the in-band 760-keV transition, clearly suggests that it is an transition. The IPDCO ratio could not be obtained for the 761-keV transition and an character for this linking transition has been assumed to assign the parity of the band B2, tentatively, as negative. The character for the 761-keV transition could not, however, be ruled out and, hence the parity of the band B2 could be positive as well. A lifetime measurement of the 18(-) state is necessary to overcome this ambiguity. The Weisskopf estimate of the halflives corresponding to and character of this transition would be pico-sec and nsec, respectively. In the present work, we could not distinguish these two halflives.
The 876-keV ray has been observed in the double gated spectrum in Fig. 2(a) but not in the double gated spectrum in Fig. 2(b) or 2(c). This ray was observed with any combination of double gates below the 1640-keV level but was not observed with any ray above this level. This indicates that the 876-keV ray must decay to the 14- state of the band B1. The cascade of rays in the band B3 has been observed in Fig. 2(a). A sum of double gated spectra, constructed from the combination of the 687-, 876-, 163-, 207 & 377-keV rays, is shown in Fig. 2(d). This spectrum clearly shows the 163-, 207-, 328-, 377- & 429-keV rays belonging to this band. The nature of the 876-keV ray is evident from its DCO and IPDCO ratios. Therefore, the bandhead of the band B3 has been assigned as 16-. The ordering of the s in this band are based on their total intensities. However, since the cross over transitions in this band were not observed, the ordering of the levels may be considered as somewhat tentative. The spins and parities of the states in this band are assigned from the measured DCO and the IPDCO ratios of the -ray transitions, wherever possible. The RDCO values of these transitions are very close to the expected values for pure dipole transitions. The negative values obtained for the IPDCO ratios for the 328- and the 377-keV transitions, together with their RDCO values, give clear evidence that they are predominantly M1 in nature. Since the other rays are in-band with the 328- and the 377-keV M1 transitions, so, we have assigned M1 nature for all the rays in this band.
III Discussion
The high spin band structure in 194Tl, obtained in the present work, can be discussed in the light of the neighboring isotopes. Ground state band structures in the odd-odd Tl isotopes in region are similar to band B1 in 194Tl. 190Tl and 198Tl are the other two isotopes for which definite excitation energies, spins and parities are known for this band. However, it is interesting that the structure of this band in these two nuclei has been interpreted differently. In 190Tl, this band was interpreted with oblate deformation 7 while in 198Tl, a possible chiral structure has been reported with triaxial deformation 13 . We have compared different properties of the ground state band in the odd-odd Tl isotopes and have shown that they look very similar.
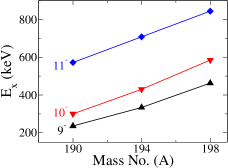
The configurations of the first few excited states in 194Tl are attributed by the following arguments. The ground state of the odd-A Tl isotopes are 1/2+ corresponding to the 3 orbital near the proton Fermi level. In the isotone 193Hg, the experimentally observed 5/2- and 13/2+ states lie very close (within 40- and 141-keV, respectively) to the 3/2- ground state ensdf1 . These states correspond to the , and orbitals, respectively, near the neutron Fermi level. Correspondingly, the configurations of the ground state (2-) and the 7+ isomeric state in the odd-odd 194Tl nucleus have been attributed to and configurations, respectively. The 8- state, at the excitation energy of 293-keV, in this nucleus, has been interpreted as the band head of the configuration 9 . These orbitals lie near the proton and the neutron Fermi levels of 194Tl for an oblate deformation. The excitation energies of the 9-, 10- and 11- states in this band for 190,194,198Tl nuclei are shown in Fig. 6, with respect to the excitation energy of the 7+ isomeric state. It can be seen that the energies of these states increase smoothly with mass number A, as expected.
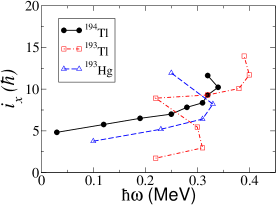
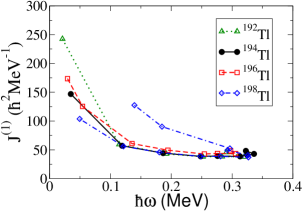
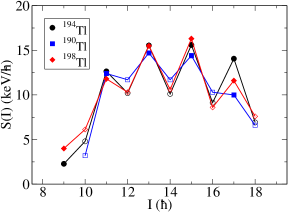
The alignment () for the band B1 in 194Tl is shown in Fig. 7 as a function of the rotational frequency . The alignments for the neighboring odd-A nuclei 193Tl and 193Hg are also shown in Fig. 7 which have been deduced from the corresponding level schemes reported by Reviol et al. 22 and Hubel et al. 6 , respectively. It can be seen that the band in 194Tl has an initial alignment of about 5. This value is in good agreement with the value obtained from the initial alignments of the neighboring odd-A nuclei using the additivity rule 20 ; 21 . There is a gain in alignment of about 5 at rotational frequency of MeV which is similar to 190Tl and 198Tl. The similarity between these odd-odd Tl isotopes are also reflected in their kinetic moments of inertia (J(1)) values as shown in Fig. 8. This indicates similar deformation in these nuclei. The particle alignments in these isotopes are also taking place at about the same frequency. In the present work, the band B1 in 194Tl could be extended just beyond the band crossing at MeV.
The band crossing phenomena in the odd-odd Tl isotopes can be understood from the band crossings in the even-even core of Hg isotopes and the band crossings in the odd-A Tl isotopes. In 192Hg 6 , the first two observed band crossings, at MeV and at MeV, were interpreted as due to the alignments of the neutrons (G AB and AB ABCD crossing, following the nomenclature of Hubel et al. 6 ). The alignment of the protons takes place at even higher frequencies. The band crossings in the odd-Z 193Tl nucleus, in which the first proton crossing is blocked, were also interpreted as due to the alignments of the same neutrons. The crossing frequency of MeV in 194Tl agrees well with the value in 192Hg. Therefore, the observed band crossing in doubly-odd 194Tl may be attributed to the alignment of a pair of neutrons in the orbital. The similarity and the systematic trend of the observed AB ABCD crossing frequencies for 190Hg ( MeV), 192Hg ( MeV) and 194Hg ( MeV) 6 are also in good agreement with the crossing frequencies of 192Tl ( MeV), 194Tl ( MeV) and 196Tl ( MeV).
A low spin signature inversion has been observed in the rotational bands in odd-odd nuclei in various mass regions, involving high-j configurations. In particular, the signature inversion has been reported for the prolate deformed odd-odd nuclei in the rare earth region with a configuration stag1 . In the A 190 region, the low-spin signature inversion for a band associated with an oblate configuration has been reported for the first time in 190Tl 7 . In the present work, a similar signature inversion has also been observed in 194Tl. The signature inversion in a band can be identified experimentally in the plot of energy staggering, defined by , where is the energy of the state with spin , as a function of the spin. The same has been plotted in Fig. 9 for the negative parity yrast band of 194Tl along with those for 190,198Tl. The staggering plots of these three nuclei show remarkably similar behavior with low-spin signature inversion at the same spin value of 11. A J-dependent residual interaction was used to interpret the signature inversion in 190Tl 7 . The similarity in the staggering plots suggest that the residual interaction remains almost unchanged for the heavier odd-odd isotopes of 194,198Tl.
The similarities in the band crossing frequencies, the moments of inertia, the signature inversion and the staggering plots for the above three nuclei suggest that the high spin properties of the ground state band in all the odd-odd Tl isotopes in region are very similar and therefore, they are expected to have similar structure. In the present work, we have not observed any indication of a chiral side band in 194Tl unlike in 198Tl.
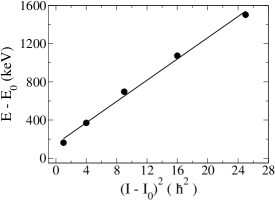
The band B3 in 194Tl is a negative parity band with band head spin of 16 at an excitation energy of 2.5 MeV. This band has been extended up to 21 with predominnatly transitions. No cross over transitions could be observed in this band. The band B3 lies at an energy which is somewhat higher than the crossing of the 2- and 4-quasiparticle configurations of the band B1. Therefore, the band B3 seems to be a 6-quasiparticle band with two more protons in the h9/2 and s1/2 orbitals. The configuration of the band B3 could, therefore, be assigned as . The respective proton and neutron orbitals constitute the 2-quasiparticle states in this nucleus at the lower excitation energies (2- state, 7+ state and the 8- band head of the band B1). The experimental initial aligned angular momentum of 7, deduced for this band, is consistent with the above configuration. The particle-hole configuration of this band with proton particles in high-j, high- and neutron holes in high-j, low- orbitals (for an oblate deformation) is favorable for magnetic rotation (MR) and therefore, the excited states, in this band, may be generated by the shear mechanism. This band, with 3 particle-hole pairs, seems to follow the same general features of MR bands 15 ; mrband . For the MR bands, the level energies () and the spin () in the band follow the pattern where, E0 and I0 are the energy and the spin of the band head, respectively. The plot of vs. for this band is shown in Fig. 10. The solid line is the fit of the data using the above relation. The good agreement of the data with the fitted curve, in this plot, clearly indicates that the band B3 closely follows the above relation. Considering a higher limit of the intensity of the unobserved crossover transitions as the level of the background in our data, the lower limit of the ratio has been estimated to be 28 . This compares well with the typical value of 20 for a MR band. The dynamic moment of inertia J MeV-1 obtained for this band is also within the typical value of J MeV-1 for an MR band. All these indicate that the band B3 is, most likely, an MR band.
The band like structure B2 lies at an excitation energy of 3.16 MeV with the band head spin of 18. The parity of this band remains tentative and this band is also not well developed. Therefore, characterization of this band at this moment would be rather prematured. However, from the systematics of the odd-A Tl nuclei, it appears that this band may be generated with an additional proton pair in the i13/2 orbital with the 4-quasiparticle configuration of the band B1 above its band crossing.
III.1 TRS calculations
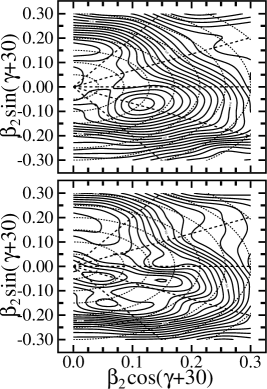
In order to get an idea about the shape of the Tl nuclei for different configurations, the total Routhian surface (TRS) calculations have been performed, in the deformation mesh points, where and are the quadrupole deformation parameters, with minimization in the hexadcapole deformation , for the bands B1 and B3 in 194Tl. The Hartee-Fock-Bogoliubov code of Nazarewicz et al. naza1 ; naza2 was used for the calculations. A deformed Woods-Saxon potential and pairing interaction were used with the Strutinsky shell corrections method. The procedure has been outlined in Refs. gm1 ; gm2 . The contour plots of the TRSs are shown in Fig. 11 for the 2-quasiparticle configuration corresponding to the band B1 (top panel) and for the 6-quasiparticle configuration corresponding to band B3 (bottom panel) in 194Tl. These surfaces were calculated at the rotational frequencies of MeV and 0.16 MeV, respectively. The plots clearly show minima in the TRS at an oblate deformation ( is prolate and is oblate) with and for the band B1 and a near spherical shape with and for the band B3.
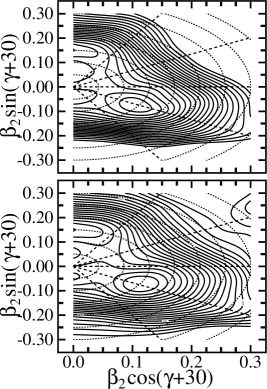
The surfaces calculated for the same 2-quasiparticle configuration as in band B1 are shown in Fig. 12 for 196Tl and in 198Tl. The minima for these nuclei are also found to be at the oblate deformation with very similar values. The similarity in the calculated shapes for these nuclei corroborates well with the observed similarities in the properties of the bands in odd-odd Tl nuclei. The oblate shapes in all these three nuclei are predicted to persist over a rotational frequency range up to the band crossing. After the band crossing, the shape of 194Tl remains almost the same with deformation and . The lack of quadrupole deformation calculated for the band B3 in 194Tl is consistent with the non-observation of transitions and the conjecture of MR nature of this band.
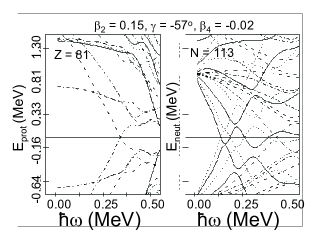
The calculated quasiparticle Routhians for the protons (Z = 81) and the neutrons (N = 113) in 194Tl are shown in left and right panels, respectively, of Fig. 13 for the deformation parameters and corresponding to the minimum in the TRS in Fig. 11. These calculations predict the first neutron pair alignment (AB crossing) at around MeV and a second one (CD crossing) around MeV. These are in good agreement with the values obtained using similar calculations for 193Tl by Reviol et al. 22 . The same nomenclature as that of Ref. 22 has been used in our calculations to label the quasiparticle levels. The observed band crossings at MeV and at MeV in 193Tl were identified as due to the first and second neutron pair alignments by Reviol et al. The calculated crossing frequencies, however, are found to underpredict both the experimental crossing frequencies by the same amount and this discrepancy was attributed to the fact that the core deformation is not stiff as assumed in these calculations. In addition to the first proton pair alignment, as in 193Tl, the first neutron pair alignment is also blocked in the odd-odd nucleus 194Tl. Therefore, the experimental band crossing in 194Tl, observed at a rotational frequency of MeV, is due to the second neutron pair alignment. This value of the crossing frequency is in fairly good agreement with the observed second crossing in 193Tl but at a slightly lower frequency. The experimental crossing frequency in 194Tl is lowered by 0.03 MeV compared to the second crossing in 193Tl. This difference of the experimental crossing frequencies, in these two nuclei, is reproduced well in the calculated second neutron pair alignment frequencies for 194Tl ( MeV) obtained in our calculation, and that for the 193Tl ( MeV) as obtained by Reviol et al. 22 .
III.2 Semiclassical calculations for the band B3
To investigate the shears mechanism of the band B3, it has been studied by the semiclassical approach of Macchiavelli et al. 15 ; 23 ; 24 . This is based on a schematic model of the coupling of two long j vectors, ( and ), corresponding to the proton and the neutron parts of the angular momenta. This aims at extracting the information on the effective interaction between the nucleons which are involved in the shears mechanism. In this model, the shears angle (), between the two j vectors, is an important variable which can be derived using the equation
| (3) |
where, is the total angular momentum. Considering the and values of 8.5 and 13.5, respectively, for the proposed configuration of the band B3, the band head spin is calculated to be 16 , assuming perpendicular coupling. This is in excellent agreement with the observed spin of the band head of this band. The maximum spin for this configuration has been calculated as corresponding to , which is again consistent with the highest spin observed for this band in the present work. Therefore, the angular momentum along the entire range of the band is, most likely, generated through the shears mechanism. The good agreement of the initial and the final spin values of this band with the calculated ones imply that the spins are generated solely by the shears mechanism with very little or no contribution from the rotation of the core. This fact is, again, corroborated well by the small quadrupole deformation obtained for this band in the TRS calculations.
According to the prescription of Macchiavelli et al. 23 , the excitation energies of the states in shears bands correspond to the change in the potential energy because of the recoupling of the angular momenta of the shears. The excitation energies of the states in the band, with respect to the band head energy, can be written as:
| (4) |
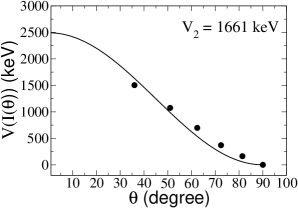
where, is the energy of the level with angular momentum , is the corresponding shears angle as given in Eqn. 3, is the band head energy and is the strength of the interaction between the blades of the shears. Therefore, can be calculated by using the experimentally observed energy levels of the shears band. In Fig. 14, the is plotted as a function of . has been extracted from this plot by a fit of Eqn. 4. The fitted curve is shown as the solid line in Fig. 14. The extracted value of comes out to be 1661 keV, which corresponds to an effective interaction of 332 keV per particle-hole pair for the suggested configuration of the band B3. This value of the effective interaction is in good agreement with the typical value of keV observed for the MR bands in Pb nuclei in this region clark01 .
IV Conclusion
The -ray spectroscopy of the high spin states in the odd-odd nucleus 194Tl has been studied in the fusion evaporation
reaction using 185,187Re target with 13C beam at 75 MeV. A new and improved level scheme of 194Tl is presented
in this work which includes 19 new -ray transitions. The DCO ratio and the polarization asymmetry ratio measurements have
been performed to assign the spins and parities of the levels. The band (B1) in this nucleus has
been extended just beyond the band crossing and up to the 18- of spin. The uncertainties in the excitation energies and
the spins in this band have been removed. The moment of inertia, alignment, the energy staggering and signature invesrion
of this band have been found to be very similar to its neighoring odd-odd isotopes. The TRS calculations predict similar
structure for these nuclei and support the observed similarity. We have not found any indication of a chiral doublet band structure
in 194Tl, unlike that which was reported for 198Tl. The observed band crossing in 194Tl could also be understood from
the band crossing in the neighboring odd-A nuclei with oblate deformation. Therefore, it needs further experimental and
theoretical investigation to understand the possible change in the structure of this 2-quaiparticle band in 198Tl, if any.
Two new side bands (B2 and B3) have been observed in this work, for the first time, in 194Tl. 6-quasiparticle configurations
for these bands have been suggested. A near spherical shape is predicted by the TRS calculations for the band B3 and is
consistent with the suggested MR nature of this band. This band has been discussed in the frame work of the semiclassical approach.
The observed band head spin and the range of the spin values of this band are in agreement with such calculations. However, to get a
microscopic understanding of this band, tilted axis cranking calculations are needed.
V Acknowledgement
The untiring effort of the operators and support staff at BARC-TIFR pelletron are acknowledged for providing a good beam of 13C. The authors gratefully acknowledge the efforts of Profs. R.G. Pillay and V. Nanal for the smooth running of the experiment and illuminating discussion. The help of the INGA community is gratefully acknowledged to set up the array and its associated electronics.
References
- (1) R.M. Diamond and F.S. Stephens, Nucl. Phys. A 45, 632 (1963).
- (2) V.T. Gritsyna and H.H. Foster, Nucl. Phys. A 61, 129 (1965).
- (3) J.O. Newton, S.D. Cirilov, F.S. Stephens and R.M. Diamond Nucl. Phys. A 148, 593 (1970).
- (4) J.O. Newton, F.S. Stephens and R.M. Diamond Nucl. Phys. A 236, 225 (1974).
- (5) R.M. Lieder et al., Nucl. Phys. A 299, 255 (1978).
- (6) A.J. Kreiner et al., Phys. Rev. C 38, 2674 (1988).
- (7) M.G. Porquet et al., Phys. Rev. C 44, 2445 (1991).
- (8) W. Reviol et al., Phys. Scr. T 56, 167 (1995).
- (9) I.G. Bearden et al., Nucl. Phys. A 576, 441 (1994).
- (10) H. Hübel et al., Nucl. Phys. A 453, 316 (1986).
- (11) C.Y. Xie et al., Phys. Rev. C 72, 044302 (2005).
- (12) A.J. Kreiner et al., Phys. Rev. C 21, 933 (1980).
- (13) A.J. Kreiner et al., Phys. Rev. C 20, 2205 (1979).
- (14) A.J. Kreiner et al., Nucl. Phys. A 308, 147 (1978).
- (15) A.J. Kreiner et al., Nucl. Phys. A 282, 243 (1977).
- (16) A.J. Kreiner et al., Phys. Rev. C 23, 748 (1981).
- (17) E.A. Lawrie et al., Phys. Rev. C 78, 021305(R) (2008).
- (18) H. Hübel, Prog. Part. Nucl. Phys. 453, 1 (2005).
- (19) R.M. Clark and A.O. Macchiavelli, Annu. Rev. Nucl. Part. Sci. 50, 1 (2000).
- (20) F. Azaiez et al., Z. Phys. A 336, 243 (1990).
- (21) F. Azaiez et al., Phys. Rev. Lett. 66, 1030 (1991).
- (22) P.L. Masiteng et al., Acta Phys. Pol. B 40, 657 (2009).
- (23) H. Tan, et al., Nuclear Science Symposium Conference Record, NSS 08, IEEE, p 3196 (2008).
- (24) R. Palit et al., Nucl. Inst. Meth. Phys. Res. A 680 90 (2012)
- (25) R. Palit, AIP Conf. Proc. 1336, 573 (2011).
- (26) D. C. Radford, Nucl. Instrum. Methods Phys. Res. A 361, 297 (1995).
- (27) A. Krämer-Flecken et al., Nucl. Instrum. Methods Phys. Res. A 275, 333 (1989).
- (28) E.S. Macias et al., Computer Phys. Comm 11, 75 (1976).
- (29) K. Starosta et al., Nucl. Instrum. Meth. Phys. Res. A 423, 16 (1999).
- (30) Ch. Droste et al., Nucl. Instrum. Meth. Phys. Res. A 378, 518 (1996).
- (31) Balraj Singh, Nucl. Data Sheets 107, 1531 (2006).
- (32) E. Achterberg, et al., Nucl. Data Sheets 107, 1 (2006)
- (33) W. Reviol et al., Nucl. Phys. A 548, 331 (1992).
- (34) R. Bengtsson and S. Frauendorf, Nucl. Phys. A 327, 139 (1979).
- (35) R. Bengtsson and S. Frauendorf, Nucl. Phys. A 314, 27 (1979).
- (36) I. Hamamoto, Phys. Lett. B 235, 221 (1990).
- (37) A.K. Jain et al., Pramana 75, 51 (2010).
- (38) W. Nazarewicz, et al., Nucl. Phys. A 512 61 (1990).
- (39) W. Nazarewicz, et al., Nucl. Phys. A 435 397 (1985).
- (40) G. Mukherjee, et al., Phys. Rev. C 64 034316 (2001).
- (41) G. Mukherjee, et al., Nucl. Phys. A 829 137 (2009).
- (42) A.O. Macchiavelli et al., Phys. Rev. C 57, R1073 (1998).
- (43) A.O. Macchiavelli et al., Phys. Rev. C 58, R621 (1998).
- (44) R.M. Clark and A.O. Macchiavelli, Nucl. Phys. A682, 415c (2001).