Subarcsecond SMA††thanks: The Submillimeter Array is a joint project between the Smithsonian Astrophysical Observatory and the Academia Sinica Institute of Astronomy and Astrophysics and is funded by the Smithsonian Institution and the Academia Sinica. observations of the prototype Class 0 object VLA1623 at 1.3 mm: A single protostar with a structured outflow cavity ?
We present 1.3-mm subarcsecond SMA observations of the prototypical Class 0 protostar VLA1623. We report the detection of 1.3-mm continuum emission both from the central protostellar component VLA1623 and two additional sources, Knot-A and Knot-B, which have been already detected at longer wavelengths. Knot-A and Knot-B are both located along the western cavity wall opened by the protostellar outflow from VLA1623. Our SMA observations moreover show that these two continuum sources are associated with bright, high-velocity 12CO(2–1) emission, slightly shifted downstream of the outflow propagation direction with respect to the 1.3-mm continuum emission peaks. The alignment of Knot-A and Knot-B along the protostellar outflow cavity, the compactness of their 1.3-mm continuum emission and the properties of the associated CO emission suggest that these two sources trace outflow features due to shocks along the cavity wall, rather than protostellar objects. While it was considered as one of the best examples of a close protobinary system so far, the present analysis suggests that the prototypical Class 0, VLA1623, is single on the scales AU probed by our SMA observations. Moreover, we present here the second robust case of compact millimeter continuum emission produced by interactions between the protostellar jet and the envelope of a Class 0 protostar, which suggests a high occurrence of these outflow features during the embedded phase.
Key Words.:
Stars: formation, circumstellar matter – Individual objects: VLA16231 Introduction
Understanding the first steps of protostar formation is a major unsolved gap in modern astrophysics. Observationally, the key to constraining protostar formation models lies in high-resolution studies of the youngest protostars. Class 0 objects, originally discovered at (sub)millimeter wavelengths are believed to be such very young accreting protostars (André et al., 1993, 2000). Because they are observed only yr after their formation, while most of their mass is still in the form of a dense envelope, Class 0 protostars are likely to retain detailed information on the initial conditions and physics of the collapse phase (see review by André et al. 2000). It is, moreover, believed that the Class 0 phase represents a pivotal stage in star formation during which the angular momentum problem (Bodenheimer, 1995) is solved through ejection processes and/or the fragmentation into multiple systems. Indeed, it has been shown that Class 0 protostars drive powerful, highly-collimated protostellar jets (Bontemps et al., 1996; Gueth & Guilloteau, 1999; Nisini et al., 2002). These jets are mostly detected through the swept-up gas forming a molecular outflow, or through a trail of high speed emission knots such as molecular bullets (Bachiller et al., 1991). The exact nature of these knots is still unclear because they could result from internal shocks within the jet or be induced by the interaction of the outflowing gas with the surrounding circumstellar medium (Moraghan et al., 2008).
VLA 16234-2417 (hereafter VLA1623) was the first Class 0 object to be identified (André et al., 1990, 1993), and it is considered to be the prototype of the class. The protostar111In the following, we refer to the system composed of the central protostellar object plus envelope as a protostar. was originally identified as a strong 1.2-mm continuum source (André et al., 1993) associated with a large-scale CO outflow (André et al., 1990), while free-free radio continuum emission, likely to be tracing the shock-ionized base of the jet, was also reported (Leous et al., 1991). High-resolution VLA observations of this object were carried out by Bontemps & André (1997), revealing a string of three candidate HH-like objects (labeled as knots A, B, and C along a western direction) closely aligned along the bipolar flow traced by the CO (André et al., 1993) and H2 emission (Dent et al., 1995). As part of a subarcsecond dust continuum survey of embedded young stellar objects with BIMA at 2.7-mm, Looney et al. (2000) found two components separated by 1.1″( 160 AU) at the position of VLA1623. The eastern 2.7-mm BIMA component is coincident with the centre of the VLA1623 envelope as traced by the larger scale OVRO 2.7-mm map (Bontemps & André, 1997). The 2.7-mm western component is coincident with the first (Knot-A in Bontemps & André 1997) of the VLA cm knots. While the eastern component, named VLA1623A, is agreed by all to be protostellar in nature, and it most likely traces the central protostellar object of VLA1623, the nature of the secondary component (VLA1623B in the naming system by Looney et al. 2000, previously VLA source labeled as Knot-A) remains unclear. Indeed, Bontemps & André (1997) proposed that it is the first in a series of knots in the jet from VLA1623, while Looney et al. (2000) argued that it is a binary component of the VLA1623 protostar. This controversy over whether VLA1623 is a binary protostar has recently been discussed at the light of 7-mm VLA observations by Ward-Thompson et al. (2011). While they suggest that the millimeter fluxes should mainly be due to dust continuum emission toward both sources, they could not firmly determine the nature of VLA1623B/Knot-A. In the following, we adopt the first naming system introduced by Bontemps & André (1997) to refer to the sources in the VLA1623 environment.
2 SMA observations and data reduction
We obtained 1.3-mm high angular resolution maps of the prototype Class 0 protostar VLA1623, with the Sub-Millimeter Array (SMA) interferometer (Ho et al., 2004). Observations were carried out on 2009 July 3 under good weather conditions (0.1), with the Very Extended configuration (longest baseline 509 m) of the array.
The central frequency was set to 220.22 GHz in the lower side band (LSB), while the upper side band was centered at 230.3 GHz. High-resolution spectral windows (0.2 MHz channels) were chosen to cover the 100 km s-1 around the rest frequencies of 12CO(2–1) at 230.538 GHz, 13CO(2–1), and C18O(2–1). Low-resolution spectral windows (3.25 MHz channels) were used to cover the rest of the bandwidth. The continuum was built from both the USB and LSB low-resolution spectral windows, excluding a 50 km s-1 spectral window around the e-CH3OH(8(1, 8)– 7( 0, 7)) rest frequency (229.8 GHz), which resulted in an effective line-free bandwidth of 3.2 GHz around a central frequency 226 GHz. The baseline solution obtained for Very Extended Configuration on 2009 July 9 was applied, and we performed absolute flux calibration using Callisto observations, while bandpass calibration was obtained by observing the bright quasar 1924-292. Phase and amplitude calibrations during the track were carried out using the quasars 1517-243 (primary calibrator located 15∘ from VLA1623, flux of 1.4 Jy at the time of the observations) and 1625-254 (secondary calibrator located 1∘ from VLA1623, flux of 0.8 Jy at the time of the observations). Less than 8 of the data was flagged during the standard reduction procedure, using the software package MIR dedicated to SMA data (Qi, 2011). By comparing the fluxes of the quasars in our calibrated maps with their tabulated fluxes in the SMA database, the final uncertainty in the flux scale was estimated to be less than 15.
The data were later imaged (inversion and cleaning) using the MAPPING software (part of the GILDAS222Grenoble Image and Line Data Analysis System, software provided and actively developed by IRAM (http://www.iram.fr/IRAMFR/GILDAS) package). The primary beam FWHM of SMA at 225 GHz is 50, and primary beam attenuation has been corrected. Natural weighting was used for imaging the data, leading to a final full-width at half maximum (FWHM) synthesized beam-size of 0.7 0.4, at a position angle of 31∘. The 1-sigma rms noise on the final continuum map is 2.1 mJy/beam. We smoothed the original spectral data by binning 2 consecutive channels, so that the final spectral maps have a spectral resolution of 0.5 km s-1. The typical 1-sigma rms noise level in the final CO maps is 80 to 120 mJy/beam per channel.
Here, we only discuss the content and analysis of the continuum and 12CO(2–1) maps, because interferometric filtering (the shortest baseline is 68 m) and low signal-to-noise ratio in our 13CO and C18O maps prevent any robust analysis without additional shorter spacing data.
3 Results
3.1 SMA 1.3-mm dust continuum map
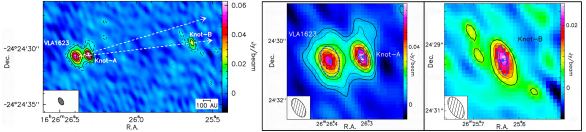
The 1.3-mm continuum map shown in the left hand panel of Figure 1 shows a total of three sources detected above the 10- level. The two central sources are coincident with the two components (VLA1623 to the east, Knot-A to the west) previously detected at both 2.7-mm (Looney et al., 2000) and 7-mm (Ward-Thompson et al., 2011). The third, westernmost source is coincident with the cm source Knot-B by Bontemps & André (1997). The separation between the two central continuum sources is 1.2, i.e 170 AU assuming a distance =1396 pc for the Oph cloud333VLBA (Loinard et al., 2008) and extinction (Lombardi et al., 2008) methods for distance determination are in favor of a slightly smaller distance (120 pc) for the Oph core. (Mamajek, 2008). Knot-B is located 10.4 away of VLA1623, i.e 1450 AU toward the west.
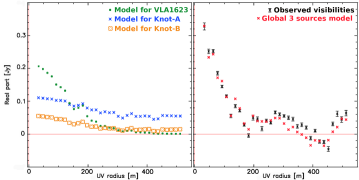
Table 1 gives the positions and deconvolved sizes (FWHMs) of the millimeter continuum sources in our SMA map, obtained by fitting the continuum visibilities (in the uv-plane) with a model that includes emission from three 2-D Gaussian sources and shown in Fig. 2. This modeling work confirms that the profile of VLA1623 is typical of an envelope profile, suggesting that this component dominates the single-dish large-scale continuum emission and is representing the centre of the protostellar envelope of VLA1623. The continuum profiles of Knot-A and Knot-B, shown in Fig. 2, show almost no dependency with baseline length, which is typical of much more compact sources.
The three sources have measured peak and integrated fluxes as reported in Table 1. The total integrated 1.3-mm emission above the 3 level on the whole primary beam field is 30080 mJy. We recover 20 of the total integrated flux of VLA1623 as seen with the IRAM-30m (1500 mJy within a region of diameter 20, see André et al. 1993). Such a low percentage is not surprising considering that our high-resolution observations do not probe the large spatial scales, and therefore filter out most of the extended envelope emission.
| Source | VLA1623 | Knot-A | Knot-B |
|---|---|---|---|
| (J2000) (1) | 16:26:26.39 | 16:26:26.31 | 16:26:25.63 |
| (J2000) (1) | -24:24:30.7 | -24:24:30.5 | -24:24:29.5 |
| FWHM (2) | 1.21.1 | 0.570.24 | 0.720.27 |
| P.A. (2) | 20∘ | 14∘ | 13∘ |
| Fpeak (mJy/beam) | 598 | 717 | 264 |
| Fint (mJy) | 17525 | 9320 | 296 |
-
(1)
The accuracy on the position of the sources, estimated from absolute positional accuracies of the calibrators observed, is 0.03.
-
(2)
Deconvolved sizes and position angles of the sources (from the modeling of our SMA visibilities, see Fig. 2.).
3.2 SMA 12CO(2–1) map
Since the shortest baseline during our SMA observations was 68 m (corresponding to a maximum spatial scale 4.7 probed in the image plane), our 12CO(2–1) map is affected by interferometric spatial filtering. For example, our SMA map recovers only 1 of the high-velocity CO(2–1) emission mapped by André et al. (1990) with their single-dish observations. Thus, not surprisingly, we do not detect the large-scale protostellar outflow observed by André et al. (1990), nor the extended emission from the envelope, which are almost entirely resolved out. We also suspect that interferometric filtering and/or self-absorption, similar to what is seen in the single-dish observations of VLA1623, are responsible for the lack of CO emission in our map near the systemic velocity (3.8 km s-1, Narayanan & Logan 2006). Therefore, we stress that the structure seen in our CO map can only trace emission from compact material, at redshifted and blueshifted velocities.
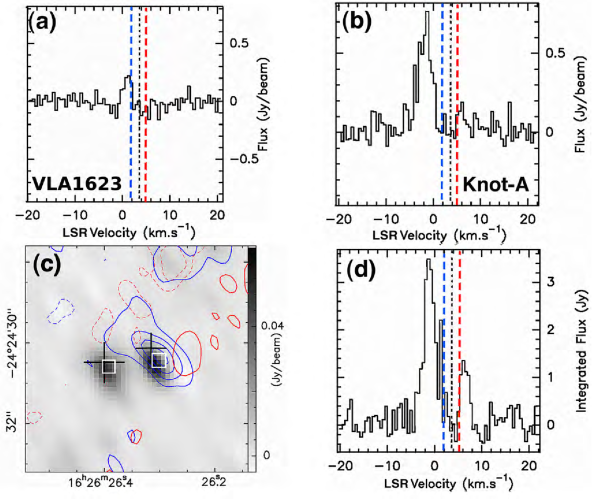
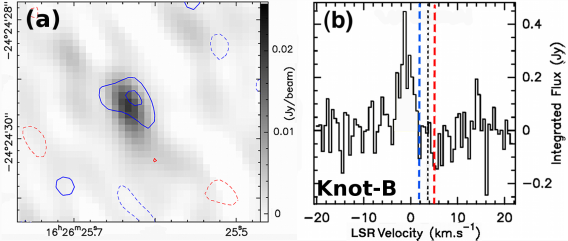
While tentative (3 detection) 12CO emission is detected towards VLA1623 (see Fig.3a), at slightly blueshifted velocities (2 km s-1), the only prominent (detections above the 5 level) emission features in our CO map are two small-scale sources, closely associated with Knots A and B. Figures 3c and 4a show the CO integrated emission contours towards Knot-A and Knot-B. In both cases, the CO emission is located right beyond the continuum peak, 0.2–0.4 downstream along the propagation direction of the VLA1623 outflow. The integrated spectra shown in Figs.3d and 4b reveal that, while the CO emission associated with Knot-A has two components (red- and blueshifted) at low projected velocities with respect to the systemic velocity of the cloud, only blueshifted CO emission is associated with Knot-B.
Our results therefore suggest that, in a region 2020 around VLA1623, the brightest compact 12CO emission structures (shifted from the systemic velocity of the cloud) are associated with Knot-A and Knot-B.
4 Nature of the detected sources
Our SMA data suggest that, while the 1.3-mm continuum emission from Knot-A and Knot-B is almost point-like, the continuum emission from VLA1623 is partially extended and its visibility curve resembles envelope profiles seen on larger scales (André et al. 1993; Ohashi et al. 1997, see electronic Figure 2). This, and the fact that the continuum emission towards VLA1623 presents the greatest integrated flux, offer further evidence that VLA1623 traces the center of the protostellar envelope seen on larger scales.
The close alignment of both Knot-A and Knot-B with the southwestern outflow cavity wall, as traced by several previous studies (André et al., 1990; Dent et al., 1995; Yu & Chernin, 1997), along with their compactness at millimeter wavelengths and their association with centimeter free-free emission first suggests that these two sources are outflow features, i.e shocks between the outflowing material from VLA1623 and the dense ambient material, rather than protostellar components. Indeed, it has been suggested (Lee et al., 2001; Cunningham et al., 2005) that the interaction between circumstellar material and outflowing material is likely to create high-density regions in the cavity walls, where the development of a shear layer could also be the site of maser and free-free emission. Interpretation of Knot-A as a protostellar companion of VLA1623, which is based on the detection of 2.7-mm continuum emission towards both sources by Looney et al. (2000), has been proposed when no millimeter continuum emission towards Knot-B had been reported yet. We stress that, while it would still be statistically possible to detect one protostellar companion (such as Knot-A) aligned with the cavity wall of the main protostellar source, the detection of two perfectly aligned companions along this axis (such as Knot-A and Knot-B) is highly unlikely.
Both Knot-A and Knot-B are associated with small-scale, low-velocity CO emission in our SMA map, detected at a position shifted by 0.2 to 0.4 from the continuum emission (downward along the outflow propagation direction). Such systematic shift between the 1.3-mm continuum and CO emission peaks does not favor a scenario where the CO emission would come from a small disk surrounding a young stellar object, because such a disk would also be traced by dust continuum emission at the position of the CO peak.
While the CO single-dish observations of VLA1623 trace only redshifted velocities for the gas towards the western outflow lobe on large scales, the two CO sources associated with Knot-A and Knot-B mostly show blueshifted CO emission. Murillo & Lay (2010) also report detecting blueshifted CO(3–2) emission along the same redshifted southwestern outflow cavity wall from VLA1623. Some detections of reverse velocity gas along outflow cavity walls have been reported (see for example the case of Serp-SMM1 by van Kempen et al. 2009b). These features can be explained as a result of the development of Kelvin-Helmholtz and Rayleigh-Taylor instabilities in outflow cavities (see for example the hydrodynamical simulations by Cunningham et al. 2005). Another explanation would be that the outflow driven by VLA1623 has an axis close to the plane of the sky, as already proposed by André et al. (1990) to explain its low projected velocities, and that it opens a cavity that has a larger opening angle than its angle with the plane of sky. Such a configuration would lead to overlapping redshifted and blueshifted CO emission detected on both sides of the source, due to the projection of the front and back edges of the cavity lobe along the line of sight (Cabrit & Bertout, 1986).
The SMA CO sources that we detect are elongated in the perpendicular direction with respect to the outflow propagation direction. This is especially visible in the case of the CO emission associated to Knot-A (FWHM 1.10.5, P.A 35∘), because it is more extended. Moreover, the CO emission associated to Knot-B has a curved shape, with an apex oriented towards the jet’s propagation direction (see Figure 4b), resembling a bow-shock shape. This suggests that the 12CO compact emission detected towards Knots A and B does not trace outflowing material, but is instead due to material interacting with the outflow. Such spatial properties are consistent with a picture where the 12CO sources originate in small-scale C-type shocks along the walls, as described in the model by Visser et al. (2011) and already suggested by van Kempen et al. (2010) towards the outflow cavity of HH 46.
Furthermore, the brightness temperature of these CO small-scale sources (60 K towards Knot-A, 30 K towards Knot-B, see Figs. 3 and 4) is higher than the CO brightness temperature from the large-scale outflowing material probed by single-dish observations (20 K). Such an increase in the CO brightness temperature in outflow cavities is generally interpreted as a signpost of gas heating, due either to outflow shocks (Bachiller & Tafalla, 1999; Hollenbach, 1997) or to ultraviolet photons produced by the protostellar accretion (van Kempen et al., 2009a).
Following the new compelling arguments brought by our SMA observations of VLA1623 presented above, we propose that Knot-A and Knot-B might represent outflow-features, due to shocks between the outflowing gas and the ambient material along the southwestern cavity wall. Emission from outflow features in the millimeter continuum maps of young protostars has already been reported by Gueth et al. (2003) towards L1157, Yen et al. (2010) towards B335, or van Kempen et al. (2009a) towards HH 46, on larger scales. While further observations of these sources are needed to assess the exact nature of the millimeter continuum emission, it is likely that the emission is due to a blend of free-free emission (from the shock) and dust continuum emission (from the local accumulation of material). The bright CO emission detected in Knots A and B might also come from column density enhancement and/or heating of the gas, similar to what was observed towards IRAS 16293 by Yeh et al. (2008), and towards HH 46 by van Kempen et al. (2010) thanks to high-J CO lines emission. Complementary molecular observations are needed to confirm the exact physical processes (shocks, photon heating) responsible for both the CO and continuum emission towards these sources.
These observations provide the clearest example so far of outflow/envelope interactions in the inner few hundred AU of protostars, resulting in compact dust continuum emission. Given the importance of outflows and jets during the early protostellar stages, such features may be common. It therefore demonstrates the need for thorough analysis of the millimeter continuum components detected close to the axes of protostellar jets, since they might be due to outflow features rather than to protostellar companions.
Finally, while it was considered as a good example of a close protobinary system so far, the present analysis suggests that VLA1623 is single on the scales AU probed by our SMA observations. This supports the conclusion of Maury et al. (2010), who propose a low rate of small-scale (1000 AU100 AU) multiplicity for Class 0 protostars, also because VLA1623 is the prototype for protostars at the Class 0 stage.
Acknowledgments: The research leading to these results has received funding from the European Community’s Seventh Framework Programme (/FP7/2007-2013/) under grant agreement No 229517.
References
- André et al. (1990) André, P., Martin-Pintado, J., Despois, D., & Montmerle, T. 1990, A&A, 236, 180
- André et al. (1993) André, P., Ward-Thompson, D., & Barsony, M. 1993, ApJ, 406, 122
- André et al. (2000) André, P., Ward-Thompson, D., & Barsony, M. 2000, Protostars and Planets IV, 59
- Bachiller et al. (1991) Bachiller, R., Martin-Pintado, J., & Fuente, A. 1991, A&A, 243, L21
- Bachiller & Tafalla (1999) Bachiller, R. & Tafalla, M. 1999, in NATO ASIC Proc. 540: The Origin of Stars and Planetary Systems, ed. C. J. Lada & N. D. Kylafis, 227–+
- Bodenheimer (1995) Bodenheimer, P. 1995, ARA&A, 33, 199
- Bontemps & André (1997) Bontemps, S. & André, P. 1997, in IAU Symposium, Vol. 182,
- Bontemps et al. (1996) Bontemps, S., André, P., Terebey, S., & Cabrit, S. 1996, A&A, 311, 858
- Cabrit & Bertout (1986) Cabrit, S. & Bertout, C. 1986, ApJ, 307, 313
- Cunningham et al. (2005) Cunningham, A., Frank, A., & Hartmann, L. 2005, ApJ, 631, 1010
- Dent et al. (1995) Dent, W. R. F., Matthews, H. E., & Walther, D. M. 1995, MNRAS, 277, 193
- Gueth et al. (2003) Gueth, F., Bachiller, S., & Tafalla, M. 2003, A&A, 401, L5
- Gueth & Guilloteau (1999) Gueth, F. & Guilloteau, S. 1999, A&A, 343, 571
- Ho et al. (2004) Ho, P. T. P., Moran, J. M., & Lo, K. Y. 2004, ApJ, 616, L1
- Hollenbach (1997) Hollenbach, D. 1997, in IAU Symposium, Vol. 182,
- Lee et al. (2001) Lee, C.-F., Stone, J. M., Ostriker, E. C., & Mundy, L. G. 2001, ApJ, 557, 429
- Leous et al. (1991) Leous, J. A., Feigelson, E. D., Andre, P., & Montmerle, T. 1991, ApJ, 379, 683
- Loinard et al. (2008) Loinard, L., Torres, R. M., Mioduszewski, A. J., & Rodríguez, L. F. 2008, ApJ, 675, L29
- Lombardi et al. (2008) Lombardi, M., Lada, C. J., & Alves, J. 2008, A&A, 489, 143
- Looney et al. (2000) Looney, L., Mundy, L., & Welch, W. 2000, ApJ, 529, 477
- Mamajek (2008) Mamajek, E. E. 2008, Astronomische Nachrichten, 329, 10
- Maury et al. (2010) Maury, A. J., André, P., Hennebelle, P., et al. 2010, A&A, 512, A40+
- Moraghan et al. (2008) Moraghan, A., Smith, M. D., & Rosen, A. 2008, MNRAS, 386, 2091
- Murillo & Lay (2010) Murillo, N. & Lay, S. 2010, in JTAM, Vol. 8, ASRROC 2010 Synposium Proceedings, 29–+
- Narayanan & Logan (2006) Narayanan, G. & Logan, D. W. 2006, ApJ, 647, 1170
- Nisini et al. (2002) Nisini, B., Giannini, T., & Lorenzetti, D. 2002, ApJ, 574, 246
- Ohashi et al. (1997) Ohashi, N., Hayashi, M., Ho, P., & Momose, M. 1997, ApJ, 475, 211
- Qi (2011) Qi, C. 2011, the MIR Cookbook for SMA, available at http://cfa-www.harvard.edu/cqi/mircook.html)
- van Kempen et al. (2010) van Kempen, T. A., Kristensen, L. E., Herczeg, G. J., et al. 2010, A&A, 518, L121
- van Kempen et al. (2009a) van Kempen, T. A., van Dishoeck, E. F., Güsten, R., et al. 2009a, A&A, 501, 633
- van Kempen et al. (2009b) van Kempen, T. A., Wilner, D., & Gurwell, M. 2009b, ApJ, 706, L22
- Visser et al. (2011) Visser, R., Kristensen, L., Bruderer, S., et al. 2011, ArXiv e-prints
- Ward-Thompson et al. (2011) Ward-Thompson, D., Kirk, J. M., Greaves, J. S., & André, P. 2011, MNRAS, 764
- Yeh et al. (2008) Yeh, S. C. C., Hirano, N., Bourke, T. L., et al. 2008, ApJ, 675, 454
- Yen et al. (2010) Yen, H.-W., Takakuwa, S., & Ohashi, N. 2010, ApJ, 710, 1786
- Yu & Chernin (1997) Yu, T. & Chernin, L. M. 1997, ApJ, 479, L63