High–field NMR of the quasi–1D antiferromagnet LiCuVO4
Abstract
We report on NMR studies of the quasi one–dimensional (1D) antiferromagnetic chain cuprate LiCuVO4 in magnetic fields up to = 30 T ( % of the saturation field ). NMR spectra in fields higher than ( T) and temperatures can be described within the model of a spin–modulated phase in which the magnetic moments are aligned parallel to the applied field and their values alternate sinusoidally along the magnetic chains. Based on theoretical concepts about magnetically frustrated 1D chains, the field dependence of the modulation strength of the magnetic structure is deduced from our experiments. Relaxation time measurements of the 51V nuclei show that depends on the particular position of the probing 51V nucleus with respect to the magnetic copper moments within the 1D chains: the largest value is observed for the vanadium nuclei which are very next to the magnetic Cu2+ ion with largest ordered magnetic moment. This observation is in agreement with the expectation for the spin–modulated magnetic structure. The magnetic phase diagram of LiCuVO4 is discussed.
pacs:
75.50.Ee, 76.60.-k, 75.10.Jm, 75.10.PqI INTRODUCTION
Magnetic frustration in quantum–spin chains () with competing nearest neighbor (NN) and next–nearest neighbor (NNN) exchange interactions yields nontrivial magnetic order which attract much attention from the theoretical point of view.Chubukov_91 ; Maeshima_05 ; Kolezhuk_05 ; Heidrich_06 ; Kecke_07 ; Hikihara_08 ; Sudan_09 ; Heidrich_09 ; Ueda_09 ; Zhitomirsky_10 ; Nishimoto_10 The conventional magnetic order with non–zero mean value of the magnetization at the magnetic ions is forbidden in 1D chains because of strong spin fluctuations even at zero temperature. In 1D chains with frustrated exchange interactions one–spin correlations decrease exponentially with the distance from spin to spin. In contrast pair, triple, and multiple correlations of adjacent spins within a chain can decrease with power–law behavior. In this case the phase is named the quasi–long range ordered phase. An external static magnetic field or a magnetic anisotropy in such 1D spin systems can establish true long–range order with multi–spin tensor order parameter.Kolezhuk_05 ; Hikihara_08 ; Sudan_09 ; Heidrich_09 It is a compelling task to find this magnetic state with tensor order parameter in real magnetic materials. There are plausible statements about possible magnetic phases in frustrated chain magnets: the first statement is that interchain interaction in real materials can cause true long–range order instead of quasi long–range order in the 1D case. For instance, quasi long–range ordered in the case of 1D the so called spin–nematic phase starts to be long–range ordered in the presence of small ferromagnetic interchain exchange interaction for the two–dimensional (2D) case, as it was concluded theoretically in Refs.(Ueda_09, ; Zhitomirsky_10, ; Nishimoto_10, ). The second statement is that spin fluctuations can be strongly depressed by interchain interactions, and conventional magnetic order with non–zero mean value of the magnetization at the magnetic ions occurs in the particular magnetic material under investigation. These serious restrictions give rise to the fact that tensor magnets are not observed experimentally yet.
The subject of our report is a high–field NMR study of the frustrated quasi one–dimensional chain cuprate LiCuVO4. In this compound, magnetic frustration is due to the intrachain NN ferromagnetic and the NNN antiferromagnetic exchange. In small magnetic fields and temperatures (with K) an incommensurate planar spiral structure of the magnetic Cu2+ moments is realized. The orientation of the spin plane is defined by the direction and value of the applied field and the crystal anisotropy. Buettgen_07 The wave vector of this structure is directed along the chains and is defined by intrachain exchange parameters and (cf. Ref. Enderle_05, ). In higher fields (with T) the collinear, spin–modulated structure is realized. In this phase spins are collinear with the direction of the applied field and their values are modulated along the chain.Buettgen_07 ; Buettgen_10 If the spiral structure can be described in the semiclassical approach,Nagamiya_62 the spin–modulated phase starts to be preferable due to quantum and thermal fluctuations. The theoretical analysis of frustrated spin chains with the intrachain exchange parameters of LiCuVO4 in the low–field range revealed a long–range ordered spin–chiral phase at . For higher fields the spin–density wave (SDW) phase is expected,Hikihara_08 ; Sudan_09 ; Heidrich_09 which is quasi long–range ordered. From the experimental point of view the low–field magnetic phases in LiCuVO4 are long–range ordered and are characterized by magnetic correlations similar to that of 1D theory. In contrast to the 1D case the spiral and spin–modulated magnetic structures of LiCuVO4 are pinned, i.e., the values of the magnetic moments at the Cu2+ ions are non zero in LiCuVO4, but strongly reduced due to spin fluctuations. Note that a SDW phase is not peculiar only in 1D frustrated systems. A long–ranged ordered SDW phase recently was detected theoretically in a 2D spin system ( = 1/2) with distorted triangular lattice.Starykh_2006 ; Starykh_2010
By further increase of the applied field in the 1D case it is expected that the spin–nematic phase develops just before the magnetically saturated phase occurs at the end. In recent experiments the magnetization curve of LiCuVO4 exhibited anomalies just before the saturation field corresponding to a new magnetic phase. Svistov_11 Probably, this phase is the spin–nematic phase with zero mean value of the magnetic moments at the Cu2+ ions. In our previous NMR studies we applied magnetic fields up to T (Refs. Buettgen_07, ; Buettgen_10, ). From those experiments we were able to conclude that for the spiral spin structure is realized. Here we show that for higher fields the spin–modulated magnetic structure is established at least up to T.
In Sec. II we present a short review of the status quo in LiCuVO4 concerning the crystallographic and magnetic structures of this compound. Sec. III is devoted to the description of experimental techniques. There are two parts of experimental results in Sec. IV: in the first are presented the NMR spectra obtained at different frequencies and temperatures, and in the second there are described relaxation properties of nuclear spins. Using the values of hyperfine constants for 7Li and 51V obtained experimentally in high–field experiments we simulated the NMR spectra for different models of magnetic structures possibly realized in LiCuVO4. According to the present theoretical concepts the collinear spin–modulated structure in LiCuVO4 constitutes a SDW phase which was predicted for 1D frustrated systems.Hikihara_08 ; Sudan_09 ; Heidrich_09 Taking into account that the strongest exchange interactions in LiCuVO4 are intrachain interactions we expect that the wave vector deduced from experiments has the same field dependence as in the 1D case.Maeshima_05 ; Hikihara_08 This assumption enables us to reconstruct the magnetic field dependence of the spin–modulated structure from our NMR spectra within the range T as documented in section V.
II CRYSTALLOGRAPHIC AND MAGNETIC STRUCTURES
LiCuVO4 crystallizes in an inverse spinel structure O4 with an orthorhombic distortion induced by a cooperative Jahn–Teller effect of the Cu2+ ions at octahedral sites. The crystal structure belongs to the space group of symmetry Imma. The elementary cell contains four magnetic ions Cu2+() with the coordinates (0,0,0), (0,1/2,0), (1/2,0,1/2), and (1/2,1/2,1/2) (see Fig. 1a). The first two ions lie in the ab–plane which is marked as I, and the latter two in the ab–plane II. From elastic neutron–diffraction experiments it was established Gibson_04 that in the low–temperature phase for and zero applied magnetic field an incommensurate planar spiral spin structure forms which has the propagation wave vector directed along the Cu2+ chains () (Fig. 1b). We parametrized the spiral of this spin structure with magnetic moments of the Cu2+ ions utilizing the coordinates , , and along the ,, and directions, respectively (Ref. Buettgen_07, ):
| (1) | |||
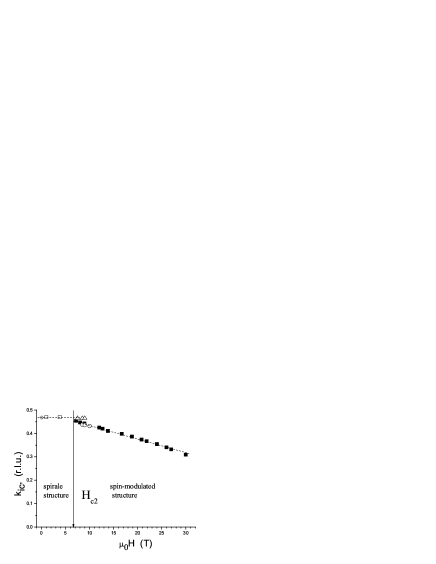
where and are orthogonal unit vectors within the ab–plane. At zero applied magnetic field , the absolute value of the propagation wave vector is kic = and the ordered Cu2+ moment amounts to (Refs. Gibson_04, ; Enderle_05, ) or (Ref. Yasui_08, ). The angle in Eq. (1) denotes an arbitrary phase shift. Figure 1b shows a stacking sequence of the above mentioned ab–planes I and II of this structure projected along the c –axis. The mutual orientation of spins of neighboring chains is the following: the nearest spins of neighboring chains within the same ab–plane are parallel, whereas nearest spins of neighboring chains from adjacent ab–planes (planes I and II in Fig. 1) are antiparallel. The magnetic susceptibility of this structure exhibits an anisotropy with slightly higher values for magnetic fields applied perpendicular to the spin plane compared to the values with the magnetic field applied within the spin plane. This fact explains the spin–flop transition of reorienting magnetic moments, when an applied magnetic field T is applied within the ab–plane of the crystal.Buettgen_07 According to our results of NMR measurements the effective magnetic moment of the Cu2+ ions within the entire field range of the incommensurate planar spiral structure is nearly constant (Ref. Buettgen_07, ). Recent results of neutron–scattering experimentsMourigal_10 show that with experimental accuracy the incommensurate wave vector does not change within this phase as it is displayed in figure 2.
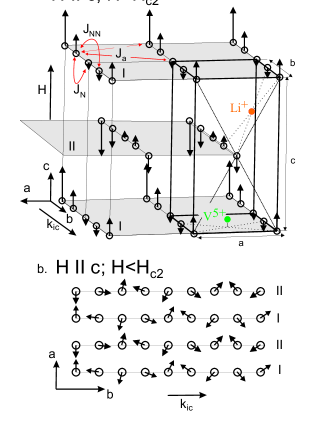
A more interesting and unexpected phase transition is observed at elevated magnetic fields T. The observation of this magnetic transition for all three directions reveals an exchange nature of this transition. The NMR spectra observed at can be well explained by the assumption that a collinear spin–modulated structure is realized.Buettgen_07 The scheme of this structure is shown in Fig. 1a and can be parametrized as:
| (2) |
where the magnetic moments of Cu2+ ions are parallel to the applied magnetic field , i.e., the unit vector . Moreover, is the magnetization of the sample per single Cu2+ ion and is the modulation strength of the structure. The angles and denote phase shifts within the particular ab–planes indexed and (cf. Fig. 1a), where .
Figure 2 summarizes all values of the incommensurate wave vector of the spin modulated structure as a function of the applied magnetic field as obtained from literature. Up to T the data are taken from Refs. Gibson_04, ; Mourigal_10, ; Masuda_11, . Additionally, the values of (solid squares) obtained for the 1D model as extracted from magnetization measurementsSvistov_11 of LiCuVO4 are plotted. In the frame work of this model the field dependence of is expected to be:Maeshima_05 ; Hikihara_08
| (3) |
The experimental values are in good agreement with each other and fit with the 1D model according to equation (3). Therefore, for the simulation of our NMR spectra of LiCuVO4 in this work we use the field dependence of the incommensurate vector defined by Eq. (3) within the entire magnetic field range under investigation. As it was elaborated in Ref. Buettgen_10, the spin–modulated phase exhibits long–range magnetic order of Cu2+ moments only within separate ab–planes, whereas the antiferromagnetic order in c–direction is only short–ranged.
III SAMPLE PREPARATION AND EXPERIMENTAL DETAILS
Single crystals of several cubic millimeters were grown as described in Ref. Prokofiev_05, . The single crystalline samples studied in the present work satisfy the following stoichiometry conditions: Li/V=0.960.05, Li/Cu=0.950.04, Cu/V=0.990.01. Thus the average composition of the sample is Li0.97CuVO4. The analysis of the sample quality is discussed in Refs. Prokofiev_04, ; Svistov_11, . The single crystal used in the present work is the identical single crystal which was studied in our previous low–field NMR experiments Buettgen_07 ; Buettgen_10 ; Svistov_11 and was denoted in Ref. Prokofiev_04, as sample from the batch 1.
The NMR experiments were performed with a phase coherent, homemade spectrometer at radio frequencies within the range MHz at the National High Magnetic Field Laboratory, Tallahassee, USA. We investigated the 7Li (=3/2, /2=16.5466 MHz/T) and 51V (=7/2, /2=11.2133 MHz/T) nuclei using spin–echo techniques with a pulse sequence 3s––3s. All NMR spectra were collected with the pulse separation = 15 s by sweeping the applied magnetic field within T at constant frequencies, and the temperatures were stabilized with a precision better than 0.02 K. Fig. 3 shows the decay of the 51V integral amplitude of the spin–echo signal on varying (the conventional experiment). The time dependence exhibits an exponential decay superimposed by pronounced oscillations which can be fitted with:Degani_72
| (4) |
where , and are dimensionless constants, and the oscillations frequency has the value of the quadrupole frequency for LiCuVO4. The origin of the oscillations due to the interaction between the nuclear quadrupole moment and a local electric field gradient was discussed in reference Kegler_06, .

IV EXPERIMENTAL RESULTS
Figures 4a and b show the NMR spectra of the 51V nuclei obtained in the magnetically ordered phase at and 0.38 K below the Neel temperature , respectively. The spin–echo spectra exhibit a single line for small applied magnetic fields and a double–horn shaped pattern for higher fields. The spectra obtained at fields less than T are in a good agreement with previous results.Buettgen_10 ; Smith_2006 The line shape of the NMR spectra do not change between T which indicates that the spin–modulated magnetic structure established in Refs. Buettgen_07, ; Buettgen_10, is robust within this extended field range. The same consideration accounts for the case of 7Li NMR spectra as the un–split, single–line patternBuettgen_07 ; Buettgen_10 for is maintained up to T (see Fig. 5, black squares).
Small sharp resonance anomalies due to metallic copper and aluminum of the experimental setup are indicated by arrows as artefacts in figures 4 and 6.
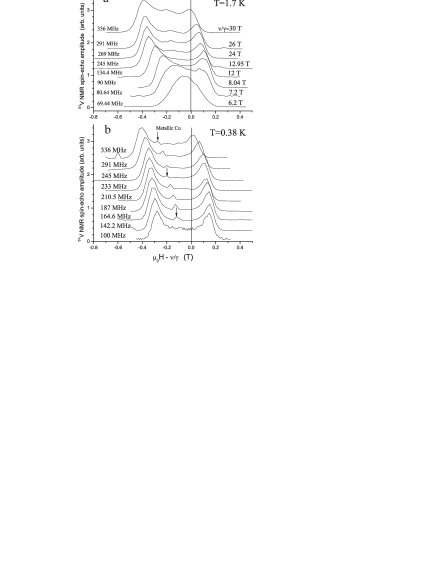

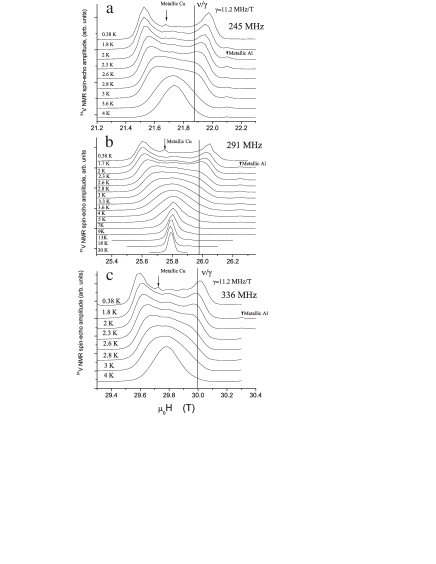
In order to trace the field dependence of the temperature evolution of the NMR spectra was studied at elevated magnetic fields , , and T (at corresponding NMR frequencies 245, 291, and 336 MHz, respectively). These measurements are given in Fig. 6 and it is observed that the transition from a single line in the paramagnetic regime to a double–horn pattern deep in the spin–modulated phase below is not very sharp. The development of the double–horn pattern toward low temperatures is accompanied by an additional unshifted spectral line at the same field of the paramagnetic signal, i.e., the paramagnetic signal survives in the magnetically long–range ordered phase at least down to temperatures around 1.7 K. Hindered due to this gradual behavior we obtain the transition temperature by integrating the area of the spectra pattern. The values of for different fields , which are plotted in the magnetic phase diagram (see Fig.11), were obtained with this procedure.
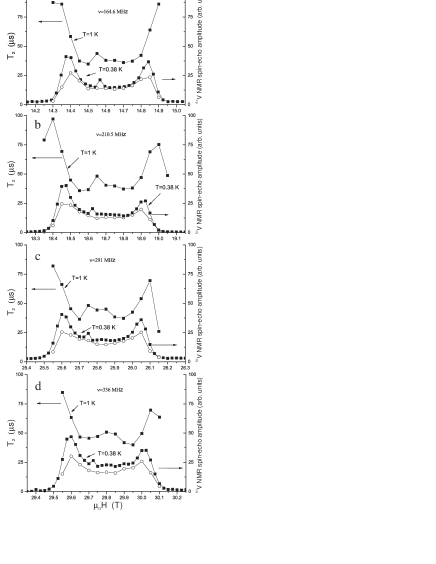
The spin–spin relaxation time of 51V depends on the particular position of the probing nuclei within the magnetically ordered structure. The field dependence of T2 for different frequencies is shown in Fig. 7 (left axis). In the same figure the NMR spectra with their characteristic double–horn shaped pattern are presented as well. The measurements were performed at K and the spectra were measured at K. From Fig. 6 it is clear that the NMR spectra of 51V nuclei do not change significantly within the temperature range K. This allows us to analyze these data together. monotonically growths toward the borders of the spectra. It is important to note that the maxima of occur at applied magnetic field values which do not coincide with the particular positions of the low– and high–field maxima of the double–horn spectra pattern.
V Discussion and Conclusion
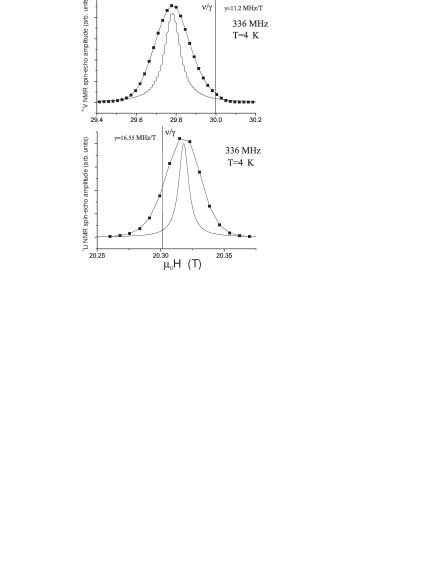
The effective magnetic field at the 7Li or 57V nuclei in LiCuVO4 is defined by three items , i.e., the externally applied field , the dipolar long–range field from magnetic neighbors , and the short–range Fermi–contact field induced by nearest neighboring magnetic moments. The 7Li and 51V nuclei have four (N) nearest magnetic neighbors, which are highlighted in Fig. 1a with dotted lines. For 7Li nuclei the nearest magnetic neighbors are from different ab–planes (I and II, respectively), whereas for 57V nuclei the nearest magnetic neighbors are located within the same ab–planes (I or II, see Fig. 1a). All copper sites in LiCuVO4 are crystallographically equivalent. This allows to define the contact fields at the nuclei under investigation (both 7Li and 57V) by the magnetic moments of their four nearest neighboring moments as , where the hyperfine coupling is a second–rank tensor. Its values were obtained from the NMR study in the paramagnetic phase. In the paramagnetic phase each magnetic ion has the same magnetic moment , where is the magnetic moment of the sample measured in an applied magnetic field , and is the number of magnetic ions. We took the value of in an applied field from Ref. Svistov_11, . The dipolar field we computed numerically and is determined in the paramagnetic phase by only one single parameter, the magnetic moment of each magnetic ion . Thus there is enough information to deduce the values of the hyperfine constants . The values of the hyperfine constants for 51V and 7Li in LiCuVO4 are T/ and T/, respectively. The value of obtained in the high–field range is consistent with the value obtained in the low–field range, whereas the value of in the low–field range was evaluated as negligible small.Buettgen_07 NMR spectra measured in the paramagnetic phase at K are shown in figure 8. The solid lines in this figure represent NMR spectra simulations with the hyperfine constants of the contact interaction as mentioned above. The line widths of the simulated spectra were left as free parameters.
The knowledge of the parameters allow to compare the experimentally obtained NMR spectra with spectra expected theoretically from different models. The amplitude of the NMR spin–echo signal is given by the number of nuclei resonating at the particular value of the effective field , but also by the spin–spin relaxation time . In order to compensate for the latter effect we multiplied the experimentally collected spectra by the factor (see Eq. (4)), where the values of have to be measured as a function of the applied magnetic field (solid squares in Fig. 7, left axis). This is the so called –correction of the spectral intensity. The resulting spectra after –correction are shown in Fig. 7 (right axis) with open circles. We conclude that the asymmetry of the uncorrected spectra (solid squares in Fig. 7, right axis) is a result of the field dependence of , whereas the positions of the characteristic maxima of the double–horn pattern do not change after the –correction.
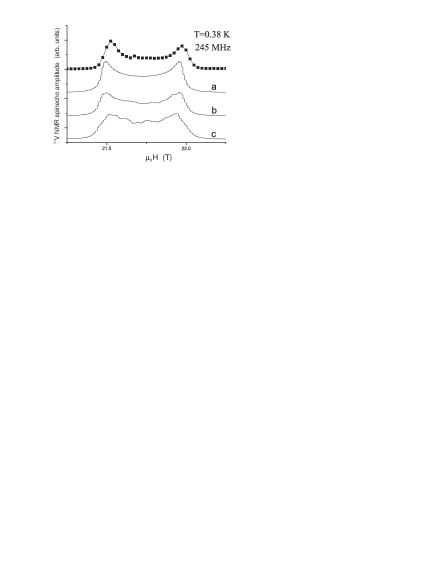
A closer inspection of the –corrected 51V NMR spectrum at K and 245 MHz ( T) is given in figure 9. Here, experimental data (solid squares) are compared with three simulations based on three different models of the magnetically ordered structure in the high–field phase of LiCuVO4 (solid lines a,b, and c in Fig. 9). The model of the magnetic structure for ’line a’ is based on Eqs. (2) and (3). Here, the model includes a long–range order of magnetic moments along the c–direction. The ’line b’ is calculated supposing the phases in Eq. (2) to be shifted by for two planes I and II nearest to the probing Li and V nuclei (see Fig. 1a), whereas the magnetic structure of the other planes, which are more distant from the probing nuclei, are also described by Eq. (2) but with random phase . This model of magnetic structure according to ’line b’ we denote as a structure with short–range order in c–direction. The underlying model of ’line c’ emanates from random phases between all ab–planes and the corresponding magnetic structure is denoted as the magnetic phase with disorder in c–direction. In the framework of these models the only fitting parameter was the modulation strength of the structure (see Eq. (2)). For the long–range and short–range ordered magnetic structures (’line a and b’) the values of at the field of T were found to be equal to . For the magnetic structure with disorder in c–direction (’line c’) the value of the fitting parameter amounts to . These fitting procedures with the three different models mentioned above were applied to all measured 51V NMR spectra collected in figure 4.
The field dependence of the modulation strength is shown in the upper panel of figure 10. The modulation strength abruptly increases just above and weakly decreases towards higher applied magnetic fields . The values of the ordered magnetic moments of the Cu2+ ions change along the chains in the range between the extremal values which are plotted in the lower panel of figure 10. The largest value of the magnetic moment aligned along the applied magnetic field asymptotically yields the highest possible value at highest magnetic fields (cf. lower panel of Fig. 10). Additionally, it is important to note that the obtained values of in case of long–range order and short–range order (i.e., model calculations ’line a’ and ’line b’ in Fig. 9, respectively) are almost the same. The third simulated magnetic structure modeled with disorder in c–direction (cf. ’line c’) yields values of which are around 20 smaller than the former ones. As the effective field at the probing 51V nuclei is predominantly given by Fermi–contact fields of Cu2+ ions from the nearest ab–plane a weak sensitivity of to the three different models of the magnetic structure is expected.
In contrast to the case of 51V NMR, the NMR spectra of 7Li are very susceptible to the magnetic order in c–direction. Here, the probing lithium nuclei are situated between adjacent planes I and II as shown in Fig. 1a, and the effective field predominantly depends on mutual orientations of spins from these neighboring planes. Simulating the case of long–range magnetic order using Eq. (2) straightforwardly accounts for the single 7Li NMR spectral line determined by the applied field and the magnetization per Cu2+ ion of the sample. Corresponding simulations of this single 7Li NMR spectral line for magnetic structures with short–range order and with disorder in c–direction, respectively, are shown in Fig. 5. Modeling the magnetic structure with short–range order in c–direction describes the observed NMR spectrum of 7Li nuclei at the best. Note that in our previous low–field study Buettgen_10 of the spin–modulated phase we preferred the magnetic structure with disorder in c–direction. However, at that time our choice was strongly based on the assumption of negligible Fermi–contact fields at the 7Li nuclei. Our new high–field spectra document a significant contribution of Fermi–contact fields acting on the lithium sites which allows us to rule out our earlier model given in Ref. Buettgen_10, . Hence, the field dependences of and (see Fig. 10, solid symbols) obtained from our NMR spectra simulation within the model of short–range ordering along the c–direction are more realistic.
Our measurements of the spin–spin relaxation time at four different NMR frequencies , and 336 MHz, accordingly four different applied magnetic fields, reveal two main results. Firstly, in the middle range of the field swept 51V NMR spectra the value of is significantly shorter than the values of at the maximas fields of the double–horn shaped spectra pattern. Secondly, the relaxation times at the low–field maxima of the NMR spectra pattern are systematically longer than measured at the high–field maxima of the spectra. This effect is more pronounced for elevated frequencies . These two results are qualitatively explained in the framework of the spin–modulated magnetic structure if we assume that the spin–spin relaxation time at the 51V nuclei is defined by fluctuations of the perpendicular components of the magnetic moments of nearest Cu2+ ions. The slowest fluctuations we expect at the copper ions with the largest module of its component of magnetic moments aligned parallel to the applied static field , i.e., in the vicinity of the maxima of the double–horn NMR spectra pattern. The parallel components of the magnetic moments reach the extremal values , where the sign belongs to the low–field maximum and the sign to the high–field maximum of the double–horn, respectively. The fastest fluctuations of the perpendicular components of the magnetic moments of nearest Cu2+ ions are expected for copper ions with zero magnetic component along the applied static field . The NMR signal from vanadium nuclei near the copper ions with zero magnetic moment is observed at applied fields in the middle range of the double-horn pattern.
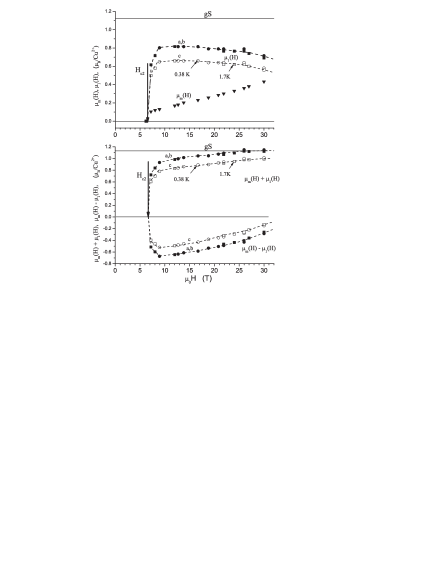
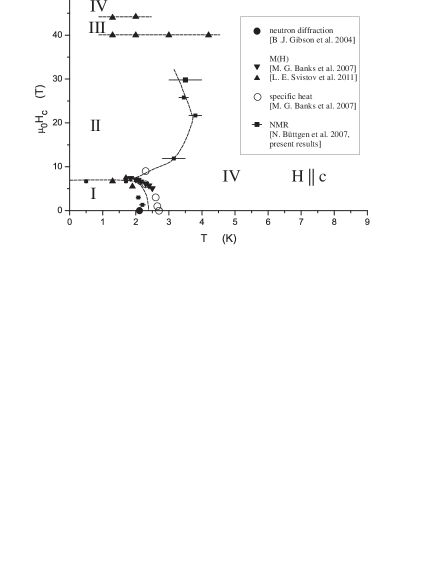
Summarizing our high-field NMR experiments we present an extension of the current magnetic phase diagramGibson_04 ; Banks_07 ; Buettgen_07 ; Svistov_11 ; Schrettle_2008 of LiCuVO4 in Fig. 11 for . This phase diagram of LiCuVO4 contains at least four phases: the planar spiral phase (I), the collinear spin–modulated phase (II), possibly the spin–nematic phase (III), and the polarized paramagnetic phase (IV). The sequence of field dependent phase transitions at temperatures is in qualitative agreement with results of recent theoretical models for the 1D case (cf. Ref. Hagiwara_11, ). As far as we know the complete magnetic phase diagram is theoretically not established up to now, even for the 1D case with frustrated intrachain exchange interactions characteristic for LiCuVO4.
In conclusion, we report on NMR studies of the quasi one–dimensional (1D) antiferromagnetic chain cuprate LiCuVO4 in high–magnetic fields which amounts up to % of the saturation field . NMR spectra within the field range T for temperatures can be described within the model of a spin–modulated phase in which the magnetic moments are aligned parallel to the applied field and their values alternate sinusoidally along the magnetic chains. The measurements of the spin–spin relaxation time at the vanadium sites reveal that depends on the particular position of the probing 51V nucleus with respect to the magnetic copper moments within the 1D chains: the largest value is observed for the vanadium nuclei which are very next to the magnetic Cu2+ ion with largest ordered magnetic moment. This observation was found in agreement with the expectation for the spin–modulated magnetic structure in LiCuVO4.
Acknowledgements.
We thank O. A. Starykh and G. Teitel’baum for useful discussions. This work is supported by the Grants 12-02-00557-à, 10-02-01105-a of the Russian Foundation for Basic Research, Program of Russian Scientific Schools, and by the German Research Society (DFG) within the Transregional Collaborative Research Center (TRR 80).References
- (1) A.V. Chubukov, Phys. Rev. B 44, 4693 (1991).
- (2) N. Maeshima, K. Okunishi, K. Okamoto, T. Sakai, and K. Yonemitsu, J. Phys. Soc. Jpn. 74, Suppl. 63 (2005).
- (3) A.K. Kolezhuk and T. Vekua, Phys. Rev. B 72, 094424 (2005).
- (4) F. Heidrich-Meisner, A. Honecker, and T.Vekua, Phys. Rev. B 74, 020403(R) (2006).
- (5) L. Kecke, T. Momoi, and A. Furusaki, Phys. Rev. B 76, 060407(R) (2007).
- (6) T. Hikihara, L. Kecke, T. Momoi, and A. Furusaki, Phys. Rev. B 78, 144404 (2008).
- (7) J. Sudan, A. Lüscher, and A.M. Läuchli, Phys. Rev. B 80, 140402(R) (2009).
- (8) F. Heidrich-Meisner, I.P. McCulloch, and A.K. Kolezhuk, Phys. Rev. B 80, 144417 (2009).
- (9) H.T. Ueda and K. Totsuka, Phys. Rev. B 80, 014417 (2009).
- (10) M.E. Zhitomirsky and H. Tsunetsugu, Europhys. Lett. 92, 37001 (2010).
- (11) S. Nishimoto, S.-L. Drechsler, R. Kuzian, J. Richter, and J. van den Brink, cond-mat arXiv:1005.5500v2 (2010).
- (12) N. Büttgen, H.-A. Krug von Nidda, L.E. Svistov, L.A. Prozorova, A. Prokofiev, W. Assmus, Phys. Rev. B 76, 014440 (2007).
- (13) M. Enderle, C. Mukherjee, B. Fäk, R.K. Kremer, J.-M. Broto, H. Rosner, S.-L. Drechsler, J. Richter, J. Malek, A. Prokofiev, W. Assmus, S. Pujol, J.-L. Raggazzoni, H. Rakoto, M. Rheinstädter, and H.M. Rønnow, Europhys. Lett. 70, 237 (2005).
- (14) N. Büttgen, W. Kraetschmer, L.E. Svistov, L.A. Prozorova, and A. Prokofiev, Phys. Rev. B 81, 052403 (2010).
- (15) R. Smith, A.P. Reyes, R. Ashey, T. Caldwell, A. Prokofiev, W. Assmus, and G. Teitel baum, Physica B 378-380, 1060 (2006)R.
- (16) T. Nagamiya, K. Nagata, and Y. Kitano, Prog. Theor. Phys. 27, 1253 (1962).
- (17) O.A. Starykh and L. Balents, Phys. Rev. Lett 98, 077205 (2007).
- (18) O.A. Starykh, H. Katsura and L. Balents, Phys. Rev. B 82, 014421 (2010).
- (19) L.E. Svistov, T. Fujita, H. Yamaguchi, S. Kimura, K. Omura, A. Prokofiev, A.I. Smirnov, Z. Honda, and M. Hagiwara, JETP Letters 93, 21 (2011).
- (20) B.J. Gibson, R.K. Kremer, A. V. Prokofiev, W. Assmus, and G.J. McIntyre, Physica B 350, e253 (2004).
- (21) Y. Yasui, Y. Naito, K. Sato, T. Moyoshi, M. Sato, and K. Kakurai, J. Phys. Soc. Jpn. 77, 023712 (2008).
- (22) M. Mourigal, M. Enderle, R.K. Kremer, J.M. Law, and B. Fåk, Phys. Rev. B 83, 100409(R) (2011).
- (23) T. Masuda, M. Hagihala, Y. Kondoh, K. Kaneko, and N. Metoki, cond-mat arXiv:1108.4255v1 (2011).
- (24) A.V. Prokofiev, I.G. Vasilyeva, and W. Assmus, J. Crystal Growth 275, e2009 (2005).
- (25) A.V. Prokofiev, I.G. Vasilyeva, V.N. Ikorskii, V.V. Malakhov, I.P. Asanov, and W. Assmus, Sol. State Chem. 177, 3131 (2004).
- (26) J. Degani and N. Kaplan, Phys. Rev. B 7, 2132 (1972).
- (27) C. Kegler, N. Büttgen, H.-A. Krug von Nidda, A. Loidl, R. Nath, A.V. Mahajan, A.V. Prokofiev, and W. Assmus, Phys. Rev. B 73, 104418 (2006).
- (28) M.G. Banks, F. Heidrich-Meisner, A. Honnecker, H. Rakoto, J.-M. Broto, R.K. Kremer, J. Phys.: Condens. Matter 19, 145227 (2007).
- (29) F. Schrettle, S. Krohns, P. Lunkenheimer, J. Hemberger, N. Büttgen, H.-A. Krug von Nidda, A.V. Prokofiev, and A. Loidl, Phys. Rev. B 77, 144101 (2008).
- (30) M. Hagiwara, L.E. Svistov, T. Fujita, H. Yamaguchi, S. Kimura, K. Omura, A. Prokofiev, A.I. Smirnov, and Z. Honda, Journal of Physics: Conference Series 320, 012049 (2011).