Calibration Issues for the CALICE 1m3 AHCAL
Abstract
The CALICE collaboration investigates different technology options for highly granular calorimeters for detectors at a future electron-positron collider. One of the devices constructed and tested by this collaboration is a 1m3 prototype of a scintillator-steel sampling calorimeter for hadrons with analogue readout (AHCAL). The light from 7608 small scintillator cells is detected with silicon photomultipliers. The AHCAL has been successfully operated during electron and hadron test-beam measurements at DESY, CERN, and Fermilab since 2005. One of main tasks for the successful data taking is to establish procedures for the equalization of cell responses and calibration of such a large number of channels.
1 Introduction
The CALICE collaboration [1] is developing a hadronic calorimeter (HCAL) with very high granularity for future linear colliders (ILC, CLIC). The collaboration built a 1 m3 physics prototype in 2005–6 [2] and currently CALICE is building an engineering prototype [3].
The AHCAL (Analogue Hadron CALorimeter) 1 m3 physics prototype [2] with 7608 active readout channels has been in test beams at the CERN SPS in 2006 and 2007, followed in years 2008 and 2009 at Fermilab. The physics prototype is made of 38 layers with scintillator tiles, interlaced with 16 mm Fe absorber plates The dimension of one layer is 90 cm x 90 cm and it contains scintillator tiles with different granularity 20 pcs of 12x12 cm2 tiles, 96 pcs of 6x6 cm2 tiles and the first 30 layers have 100 pcs of 3x3 cm2 tiles in the middle. The last 8 layers have 6x6 cm2 tiles in the middle instead. The active layers are referred to as modules, and the sum of active and passive material adds up to a total depth of 5.3 nuclear interaction lengths ().
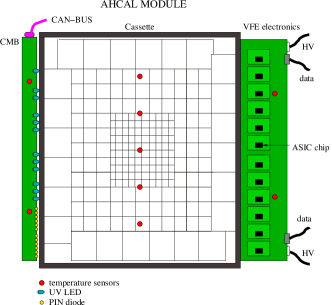
The active element of the readout is a compact photo-detector — a silicon photomultiplier SiPM with 1156 pixels, each 32 m32 m in size. The AHCAL analogue board carries 1 ASIC for 18 SiPM channels. A second board contains control and configuration electronics and provides correct voltage for each SiPM. For the calibration a board called CMB is used, see Fig 1.
The AHCAL readout chain of this prototype contains scintillator tiles with embedded wavelength-shifting fibers and small SiPM photo-detectors. The electrical signal is adjusted by a preamplifier and a shaper and digitized by a 12-bit ADC.
The variation of characteristics of the complete chain (gain, saturation) depends mainly on changes of temperature and operation voltage of the SiPM. For the correct offline reconstruction of the energy deposition, the calibration runs have to be included into the data-taking process, since the condition inside the detector can change. For purposes of monitoring the long-term stability and performance of the photodetectors the calibration system with optical fibers for a UV LED light distribution was built [4]. A calibration and monitoring board (CMB) connected to each module distributes UV light from an LED to each tile via clear fibers. The LEDs are pulsed with 10 ns wide signals steerable in amplitude. By varying the voltage, the LED intensity covers the full dynamic range from zero to saturation (about 70 times the signal of a minimum-ionizing particles — MIP). Furthermore, the LED system monitors variations of SiPM gain and signal response, both sensitive to temperature and voltage fluctuations. The LED light itself is monitored with a PIN photo-diode to correct for fluctuations in the LED light intensity.
2 Calibration procedure
For trustworthy data measurements with the AHCAL prototype we have to establish a reliable and robust calibration chain. This requires measurements with beam particles and with light from the LED monitoring system. The calibration chain is summarized in the following steps:
-
•
calibration of the cell response and cell-to-cell equalization;
-
•
monitoring of the SiPM gain and corrections for the non-linear response;
-
•
calibration to an energy scale (in GeV) with electromagnetic showers.
For an energy deposit in units of MIP of one single cell (with registered signal in ADC counts) we can write
| (1) |
where the first term is calibrated signal response in a given cell in case of a linear device. Due to the non-linearity in the SiPM response (finite number of SiPM pixels), we need to add a correction function, which is described by the second term in the Eq. 1. This correction is a function of a number of SiPM pixels, , firing for a single cell . It is related to the ADC value for the cell, , and the corresponding SiPM gain, :
| (2) |
The first term of Eq. 1 expresses the equalization of all cell responses done by the cell-by-cell calibration, see the section 2.1. The section 3 describes how to determine the gains for single cells with respect of temperature dependence. Methods how to correct for the non-linear SiPM response are introduced in the section 4.
2.1 Cell response equalization with MIPs
The cell-by-cell calibration (equalization of all cell responses) is performed using minimum-ionizing particles (MIPs) provided by a broad muon beam, illuminating all cells in the detector. For each cell, a calibration factor, , is determined from the most probable value of the measured energy spectrum for muons in ADC units, which is extracted with a fit using a Landau function convoluted with a Gaussian, as can be seen for one cell in Fig 2.
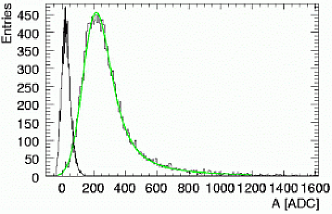
This fit accounts for the distribution of energy loss of muons in the scintillator tiles as well as for contributions from photon counting statistics and electronic noise. The combined systematic and statistical uncertainty for these fits was typically on the order of 2%. The muons are generally parallel to the beam line and perpendicular to the detector front face. In this way all cells can be calibrated at the same time, minimizing the impact of temperature induced variations.
The MIP calibration efficiency, i. e. the amount of successful MIP calibrations above the 0.5MIP threshold, is about 93% for the 2007 data set (CERN tests). The calibration fails for cells with broken electrical connection or very noisy SiPMs. The signal over noise ratio (), defined as MIP amplitude over pedestal width (see Fig. 2), is a measure for the separation of a MIP signal and noise. It is found to be 10 in 2007.
3 UV LED calibration and monitoring system

Since the SiPMs are sensitive to changes in temperature and operation voltage, the LED system has been installed to monitor the stability of the readout chain in time. The calibration system needs sufficient flexibility to perform several different tasks. Gain calibration: we utilize the self-calibration properties of the SiPMs to achieve the calibration of an ADC in terms of pixels that is needed for non-linearity corrections and for a direct monitoring of the SiPM gain. Further we monitor all SiPMs during test beam operations with a fixed intensity light pulse. Saturation: we cross check the full SiPM response function by varying the light intensity from zero to the saturation level. Our calibration boards use an UV-LED as a light source for calibration. The UV-LEDs require a special driver [5] in order to make them shine fast (10 ns) with an amplitude covering several orders of magnitude in light intensity.
3.1 SiPM gain calibration
For the extraction of the saturation curve (Eq. 1) describing the SiPM non-linearity we need to know the SiPM gain for each cell (Eq. 2). The gain is extracted from single photo-electron (p. e.) spectra taken in dedicated runs with low LED light intensity. LED light is necessary as the best determination of the gain requires a single photo-electron spectrum with a Poisson mean of about 1.5 p.e. and the mean obtained from dark noise events is below 0.5 p.e.
The SiPM gain, , is the distance between two consecutive peaks in the single photo-electron spectrum. A typical gain spectrum is shown in Fig. 3. A multi-Gaussian fit is performed to the single photo-electron peaks to determine their average relative distance. The mean of each Gaussian function in the multi-Gaussian sum is left as a free parameter and the width is dominated by electronic noise, but for large number of pixels fired the statistical contribution becomes visible, which lead to an increase of the peak width. Accordingly, the width of each peak is left as a free parameter. The uncertainty on the gain determination is mainly due to the fit and is about 2 % for fits which pass quality criteria.
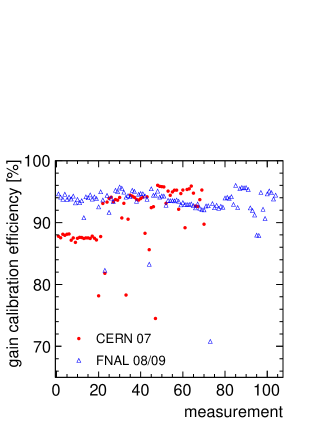
SiPM gain measurements were repeated approximately every eight hours during test beam operation. The SiPM gain varies with temperature and has to be corrected for it. The efficiency of the gain extraction is defined as the number of successful fits in one gain run divided by the number of channels which can be calibrated. Figure 4 (left) shows the efficiency of the gain extraction for a series of runs taken at CERN and FNAL, respectively. Initial problems during the system commissioning phase led to low efficiency, but after commissioning a gain extraction efficiency of about 95 % per run has been achieved. The gain efficiency was also stable after transportation and throughout the FNAL runs. Combination of several gain runs yields calibration of more than 99 % of all cells. The remaining 1 % of cells are calibrated with the average of the module to which they belong.
3.2 ASIC mode inter-calibration
The measurement of SiPM gain is performed with a special mode of the readout chip (high pre-amplification gain, CM mode). In contrast, physics data taking are performed with approximately ten times smaller electronic amplification (PM mode). The inter-calibration factor, , of the chip gain between both modes is used to determine the overall SiPM calibration factor (used in Eq. 2), .
The extraction of the inter-calibration coefficients depends on the linear response of the chip in both modes for an overlapping range of input signals. The input signal is provided by the LED system. The amplitude of the signal is varied within the linear range by varying the LED light intensity. The response in each readout mode is fit with a line, and the ratio between the two slopes is the inter-calibration coefficient for one given readout channel. Ideally, this factor should be a simple constant between the two chip readout modes, but it turns out to depend on the SiPM signal form due to the different shaping times in the two modes. For longer SiPM signals the inter-calibration is bigger than for shorter SiPM signals. The inter-calibration factors between the chip readout modes range between 4 and 13.
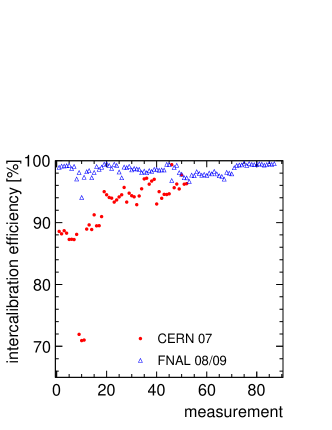
As with the gain, the inter-calibration extraction efficiency is influenced by the quality of the LED light distribution system. The inter-calibration coefficient extraction efficiency during the 2007 and the 2008 data taking periods are plotted in Figure 4 (right). After commissioning was completed, all channels with the exception of the 2 % inactive channels and the channels connected to a broken LED, could be inter-calibrated. For the missing inter-calibration values the average of the module to which a SiPM belongs is used instead.
3.3 Temperature variation
The SiPM gain and photo-detection efficiency are temperature dependent. The product of the two determines the SiPM response, which typically decreases by 3.7%/K. A procedure has been developed to correct temperature-induced variations in the calorimeter response using temperature measurements in each module. This procedure and its stability will be described in more detail in [6]. To account for the included temperature variations, the visible energy of each data set is scaled by -3.7%/K to the average temperature of the muon data used for calibration.
4 SiPM non-linearity
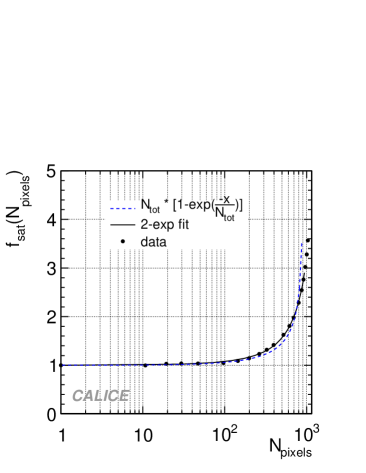
Due to the limited number of pixels and the finite pixel recovery time, the SiPM is an intrinsically non-linear device. The response function of a SiPM correlates the observed number of pixels fired, , to the effective number of photo-electrons generated, , including cross-talk and after-pulses. The response of a SiPM can be approximated by the function
| (3) |
with the maximum number of fired pixels. This formula is a useful approximation for the case of uniform light distribution over the pixels and short light pulses. In the above approximation, one can extract a correction function for the SiPM non-linear response as the residual to linearity of the inverted SiPM response function. For the analysis of measured data we use the tabulated values of a fit of the double exponential function, see Fig. 5 (left).
For studies saturation behaviour of the individual SiPMs, they were not mounted on tiles, but were bare SiPMs. Therefore, all the pixels have been illuminated with light in a homogeneous way. The measurement results for all SiPMs installed in the AHCAL are given in [2]. The maximum number of fired pixels ((bare)) for each SiPM is extracted with a fit to the measured points using Eq. 3. The spread (RMS) in the values of between all the curves is about 20 %. SiPMs with 900 have been pre-selected. This ensures not too large variations in the non-linear response function of each device.
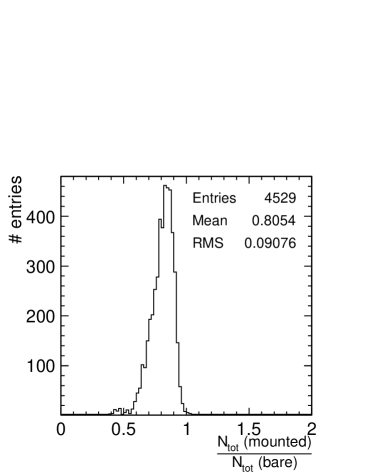
Alternatively, has also been extracted using the AHCAL LED monitoring system from measurements with the SiPM mounted on a tile ((mounted)). The saturation point in number of pixels is independent on the linearity of the light. Fig. 5 (right) shows the ratio of (mounted) to (bare). The plot shows that the maximum number of pixels in the in-situ setup is on average 80.5 % of the value determined in the laboratory setup [7] with a wide distribution (RMS=9 %). This factor is interpreted as geometric mismatch between the WLS fiber and the photodetector. The fiber has a 1 mm diameter while the SiPM active surface area is 11 mm2; the geometric ratio between areas is 79 %, in agreement with the measured value. Therefore, only a fraction of the SiPM surface is illuminated and the laboratory curves are re-scaled by the measured value of 80.5 % to correct for this effect before they are used to correct for the SiPM saturation.
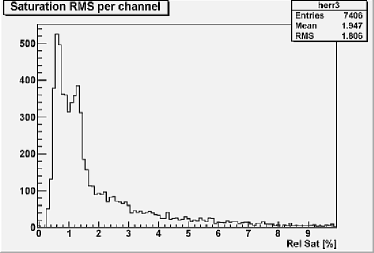
The uncertainty of the determination of the saturation point in-situ () for a single channel is lower than 3 %, if the LED light range properly covers the SiPM saturation region, and if this region is measured well below the ADC saturation. Unfortunately, these conditions are true only for a sub-sample of about 73 % channels as can be seen in Fig. 6.
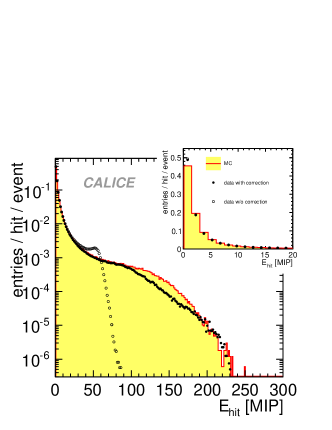
The impact of the saturation correction is seen in Fig. 7 where the energy per hit is shown with and without the correction factor applied, for 30 GeV electromagnetic showers. Whereas the correction is negligible for low signal amplitudes, it becomes significant at larger amplitudes, resulting in a strong correction for the tail of the distribution. For the maximum energy deposited in one cell for a 30 GeV the correction factor is .
5 Validation of the AHCAL calibration
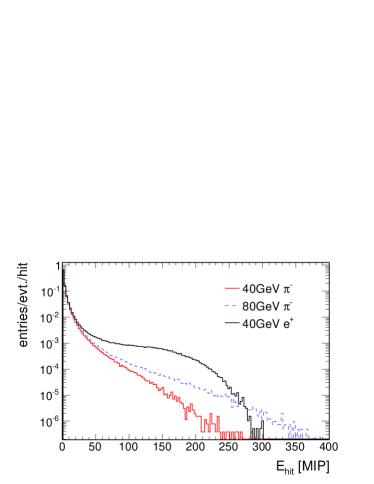
The linearity of the calorimeter response for a large range of incident particle energies is a key feature, which allows for an important test of the calibration chain. Electromagnetic showers offer the most rigorous test for non-linearity correction, since the energy deposited per single tile in an electromagnetic shower is larger than that in a hadronic shower for the same particle energy. Figure 8 shows the hit energy spectrum of a 40 GeV positron shower compared to the spectra of 40 GeV and 80 GeV pion showers. The positron shower clearly has more hits with high energy deposition, even when the total particle energy is only half that of the pion.
More results about the analysis of the electromagnetic showers measured by the AHCAL can be found in [8].
Acknowledgments
The author gratefully thanks to his colleagues from the Institute of Physics in Prague: Jaroslav Cvach, Milan Janata, Jiri Kvasnicka, Denis Lednicky, Ivo Polak, Jan Smolik and colleagues from the CALICE collaboration for their help and realization the measurements needed for this work. Special thanks go to Erika Garutti (DESY) for very valuable contributions to my presentation at LCWS11 in Granada.
References
-
[1]
CALICE home page:
https://twiki.cern.ch/twiki/bin/view/CALICE/CaliceCollaboration. - [2] C. Adloff et al., Construction and commissioning of the CALICE analog hadron calorimeter prototype, JINST 5 (2010) P05004, arXiv:1003.2662.
- [3] M. Reinecke, Towards a full scale prototype of the CALICE tile hadron calorimeter, Proc. IEEE Nucl. Science Symp. (NSS), NP3.M-76, Valencia, 23th–29th Oct 2011.
- [4] J. Zalesak, Calibration System with Optical Fibres for Calorimeters at Future Linear Collider Experiments, Proc. IEEE 2011 Nucl. Science Symp. (NSS), NP3.M80, Valencia, 23th-29th Oct. 2011, ArXiv:1201.5762
-
[5]
I. Polak, Development of Calibration system for AHCAL,
talk presented at ECFA conference in Valencia 15th Nov 2007
www-hep2.fzu.cz/calice/files/ECFA_Valencia.Ivo_CMB_Devel_nov06.pdf - [6] The CALICE collaboration, C. Adloff et al., Muon response of a highly granular Hadronic Calorimeter, in preparation.
- [7] N. Feege, Silicon Photomultipliers: Properties and and Application in a Highly Granular Calorimeter, DESY-THESIS-2008-050 (2008).
- [8] C. Adloff et al., Electromagnetic response of a highly granular hadronic calorimeter, JINST 6 (2011) P04003, arXiv:1012.434.