Star formation in the early universe: beyond the tip of the iceberg
Abstract
We present late-time Hubble Space Telescope (HST) imaging of the fields of six Swift gamma-ray bursts (GRBs) lying at . Our data include very deep observations of the field of the most distant spectroscopically confirmed burst, GRB 090423, at . Using the precise positions afforded by their afterglows we can place stringent limits on the luminosities of their host galaxies. In one case, that of GRB 060522 at , there is a marginal excess of flux close to the GRB position which may be a detection of a host at a magnitude . None of the others are significantly detected meaning that all the hosts lie below at their respective redshifts, with star formation rates SFR M⊙ yr-1 in all cases. Indeed, stacking the five fields with WFC3-IR data we conclude a mean SFR M⊙ yr-1 per galaxy. These results support the proposition that the bulk of star formation, and hence integrated UV luminosity, at high redshifts arises in galaxies below the detection limits of deep-field observations. Making the reasonable assumption that GRB rate is proportional to UV luminosity at early times allows us to compare our limits with expectations based on galaxy luminosity functions derived from the Hubble Ultra-Deep Field (HUDF) and other deep fields. We infer that a luminosity function which is evolving rapidly towards steeper faint-end slope () and decreasing characteristic luminosity (), as suggested by some other studies, is consistent with our observations, whereas a non-evolving LF shape is ruled out at % confidence. Although it is not yet possible to make stronger statements, in the future, with larger samples and a fuller understanding of the conditions required for GRB production, studies like this hold great potential for probing the nature of star formation, the shape of the galaxy luminosity function, and the supply of ionizing photons in the early universe.
1. Introduction
The drive to locate and characterize the earliest gravitationally bound objects in the Universe – the first proto-galaxies, population III & II stars and the black holes they produced – is a central theme of contemporary cosmology. It is intimately tied to the quest to understand how the Universe at large was reionized, quite possibly by the ultra-violet (UV) flux produced by these first, and still enigmatic objects. Major investments of time on large facilities continue to be spent on these ambitious goals, but progress has been hard-won. Historically, quasars were the key high-redshift beacons, thanks to their great luminosities, but the space density of bright quasars drops above and to date the most distant quasar is located at (Mortlock et al., 2011). Galaxies are, of course, much more common than quasars, and high- galaxies are likely to be present in moderate numbers in very deep near-infrared (nIR) observations. Indeed, recent nIR observations in the Hubble Ultradeep Field (HUDF) have unveiled candidate galaxies (e.g., Bouwens et al., 2011c; Bunker et al., 2010; McLure et al., 2010) discovered via the Lyman-dropout technique. The challenge of studying these sources lies in their extreme faintness (often 28th magnitude), which generally means only photometrically-derived redshift estimates are possible. Furthermore, distinguishing young, high- galaxies from old or dusty populations at moderate redshifts, or even Galactic brown dwarfs, becomes increasingly difficult when approaching the sensitivity limit of the data. Although spectroscopic redshifts have been determined for a small number of galaxies (Vanzella et al., 2011; Ono et al., 2012), this is only possible if the galaxy is a strong Ly emitter (and the emission is not completely absorbed by a partially neutral intergalactic medium), and requires a major investment of time for each target. Even in the era of extremely large telescopes, many such sources may be too faint for direct spectroscopic redshift confirmation.
The extreme luminosity of gamma-ray bursts (GRBs) makes them potentially powerful probes of the early Universe, a utility which has been widely touted since the discovery of the first afterglows (e.g., Wijers et al., 1998; Lamb & Reichart, 2000; Tanvir & Jakobsson, 2007). Current technology has the capability to detect the prompt, and afterglow emission for bright GRBs out to , should GRBs exist at this epoch (Gou et al., 2004; Racusin et al., 2008; Bloom et al., 2009), and they have several advantages over alternative methods for the detection and study of high objects. In the first instance, the intrinsically smooth power-law spectra of the afterglows makes them ideal backlights for absorption diagnostics: not only providing redshifts, but in principle chemical enrichment, hydrogen column densities (e.g., Vreeswijk et al., 2004; Prochaska et al., 2007; Fynbo et al., 2009), extinction and dust laws in the hosts (e.g., Zafar et al., 2011a; Schady et al., 2012), and even probing the state of the intergalactic medium (IGM) (e.g, Miralda-Escude, 1998; McQuinn et al., 2008). Secondly, they pinpoint the positions of their hosts, and once the afterglow has faded we can search for the host galaxy with a redshift in hand from spectroscopic (or photometric) observations of the afterglow. Finally, long-duration GRBs are produced during core-collapse events (e.g., Hjorth et al., 2003a; Stanek et al., 2003; Pian et al., 2006), and so trace the locations of at least some component of massive star formation. Importantly, GRBs allow absorption redshift measurements for galaxies at times too faint to be seen in deep imaging even with the Hubble Space Telescope (HST ) (e.g., Berger et al., 2002; Hjorth et al., 2003b; Thöne et al., 2010).
The early populations of massive stars and the proto-galaxies in which they reside are thought to be major producers of ionizing photons, and also give rise to GRBs. Hence, mapping GRB space density as a function of cosmic time should trace this early star formation and so provide a key to assessing its contribution to the reionization of the IGM at . Since GRB progenitors are individual stellar systems, their hosts should sample the whole (star-forming) galaxy luminosity function (LF), rather than just the bright end, avoiding the limitation inherent in flux limited samples (e.g., Jakobsson et al., 2005). This is particularly important at very high-redshift, when galaxies were small and faint, and only the tip of the LF can be probed directly.
However, GRB-based studies are subject to their own difficulties. As with any sources beyond , in addition to the increasing luminosity distance, we have to contend with the difficulties of working in the nIR. In addition, because GRB afterglows fade there is only a narrow window of opportunity in which observations can be pursued, so signal-to-noise cannot be built up over many nights of observation. Hence, a major constraint in their detection and study at high- is the availability of large aperture telescopes which can respond rapidly with appropriate nIR instrumentation. It is also clear that high-redshift GRBs detectable to the limits of the Swift satellite are rather rare, and therefore many bursts have to be observed to find the few at (e.g., Jakobsson et al., 2012). Finally, studies of GRBs at lower redshift have indicated that they are generally found in small-to-moderate size, low-to-moderate metallicity galaxies with high specific star-formation rates (; e.g., Christensen et al., 2004; Castro Cerón et al., 2006; Modjaz et al., 2008; Chen et al., 2009; Savaglio et al., 2009; Svensson et al., 2010), and rarely in intensively star-forming far-IR-bright galaxies (Tanvir et al., 2004; Le Floc’h et al., 2006; Michałowski et al., 2008). Coupled with theoretical arguments (e.g., Yoon & Langer, 2005; Woosley & Heger, 2006) and spectroscopic studies of their environments (e.g., Fynbo et al., 2009; Levesque et al., 2010a), this has led to the suggestion that GRBs may be more common and/or brighter at relatively low metallicities (e.g., Wolf & Podsiadlowski, 2007). Such a dependence could potentially help explain the apparent increase in GRB-rate to SFR ratio between and seen in various studies (e.g., Natarajan et al., 2005; Yüksel et al., 2008; Robertson & Ellis, 2012). However, the picture is not a simple one: there is a selection bias against finding heavily extinguished afterglows (e.g., Perley et al., 2009; Krühler et al., 2011), and at least some GRBs appear to be produced in very dusty, massive star-bursting galaxies (e.g., Chen et al., 2010; Küpcü Yoldaş et al., 2010; Hashimoto et al., 2010; Svensson et al., 2012), whilst others have been found in solar or even super-solar metallicity environments (Levesque et al., 2010b; Savaglio et al., 2011). Furthermore, comparison of GRB luminosity and host metallicity at reveals no obvious correlation (Levesque et al., 2010c). In any event, it is likely that galaxies with properties similar to typical GRB hosts predominate at early times, and indeed the small number of higher-redshift afterglows for which accurate metallicities have been derived show a range that matches well predictions from galaxy evolution simulations that include no bias in GRB production (Pontzen et al., 2010). Thus, we expect GRBs to be a good tracer of the bulk of high redshift star formation (Fynbo et al., 2006, 2008; Kocevski et al., 2009), and we proceed under that assumption in this paper.
Several very high- bursts have been identified by Swift to date, and have begun to realise their potential as probes of the early universe. The afterglow of GRB 050904 at was brighter than magnitude even a few hours after the burst (Haislip et al., 2006), and spectroscopy would have been routine with a 4–8 m class telescope. Indeed, ultimately the redshift measurement came from a Subaru spectrum taken some 3 days after the event (Kawai et al., 2006). Even the intrinsically rather faint afterglows of GRB 080913 (; Greiner et al., 2009) or GRB 090423 (; Tanvir et al., 2009) allowed for spectroscopic redshifts with 8 m instrumentation, despite the data being acquired more than 12 hours after the burst in the latter case.
Until now, the most distant GRB host detected (with Spitzer) was that of GRB 060510B at (Chary et al., 2007). In this paper we present deep, late-time Hubble Space Telescope (HST) observations of the fields of six of the most distant gamma-ray bursts, all at . Only one host galaxy, that of GRB 060522, could be marginally detected, and the deep limits for the others imply that all lie close to or below the characteristic luminosity, at their respective redshifts. As we show in this paper, the non-detections of the hosts place important constraints on their total luminosities and star formation rates. Since long-duration GRBs trace (at least) some component of star formation, a survey of even a small number of GRBs at high redshifts provides a census of the locations and galactic environments of star formation at early times. This means that GRBs have the potential ultimately to constrain the faint end of the galaxy LF at , which is crucial for understanding the reionization of the Universe, thought to occur predominantly at (Komatsu et al., 2011). UV photons produced by massive stars are widely considered the most likely driving force for reionization (Loeb, 2009; Faucher-Giguère et al., 2009), but even ultra-deep surveys cannot currently quantify the (likely dominant) contribution of intrinsically faint galaxies.
Throughout this paper we use the AB-magnitude system, and adopt a -CDM cosmology with km s-1 Mpc-1 and , .
| GRB | -ref | Obs. summary | Astrometry | Accuracy (″) | |
|---|---|---|---|---|---|
| 060522 | 5.11 | 1 | WFC3:F110W | TNG | 0.06 |
| 060927 | 5.47 | 2 | NIC3:F160W, WFC3:F110W | VLT/FORS2 | 0.07 |
| 050904 | 6.29 | 3 | ACS:F850LP | Gemini-S/GMOS | 0.06 |
| 080913 | 6.73 | 4 | WFC3:F160W | VLT/FORS2 | 0.08 |
| 090423 | 8.23 | 5 | WFC3:F125W,F160W | VLT/HAWK-I | 0.03 |
| 090429B | 9.4* | 6 | WFC3:F105W,F160W | Gemini/NIRI | 0.06 |
2. GRBs in the sample
Our sample comprises six of the most distant bursts detected by Swift, including all five bursts detected to date that have firm spectroscopic redshifts above . They are GRBs 050904 (; Kawai et al., 2006), 060522 (; Cenko et al., 2006), 060927 (; Ruiz-Velasco et al., 2007), 080913 (; Greiner et al., 2009; Patel et al., 2010), 090423 (; Tanvir et al., 2009; Salvaterra et al., 2009) and GRB 090429B (; Cucchiara et al., 2011). Here, we briefly summarise details of each GRB, and the available HST observations of each field, which were mostly obtained after the afterglow should have faded beyond detectability (the possible exception is GRB 050904 as discussed below). The majority of our data comes from the new Wide Field Camera 3 Infrared channel (WFC3 IR). In all of these cases we used the standard flat-fielded observations from the HST archive111archive.stsci.edu, and corrected these for geometric distortion, creating a stack of individual images using multidrizzle. The final pixel scale for these well dithered observations is set as 005 per pixel, with the pixfrac set to 0.7. For observations with ACS we drizzled to the same final pixel scale, which broadly retains the native pixel scale of the instrument. For GRB 060927, we also present NICMOS observations of the host, as detailed below. Cut-outs of the images around the locations of the GRB positions are shown in Fig. 1.
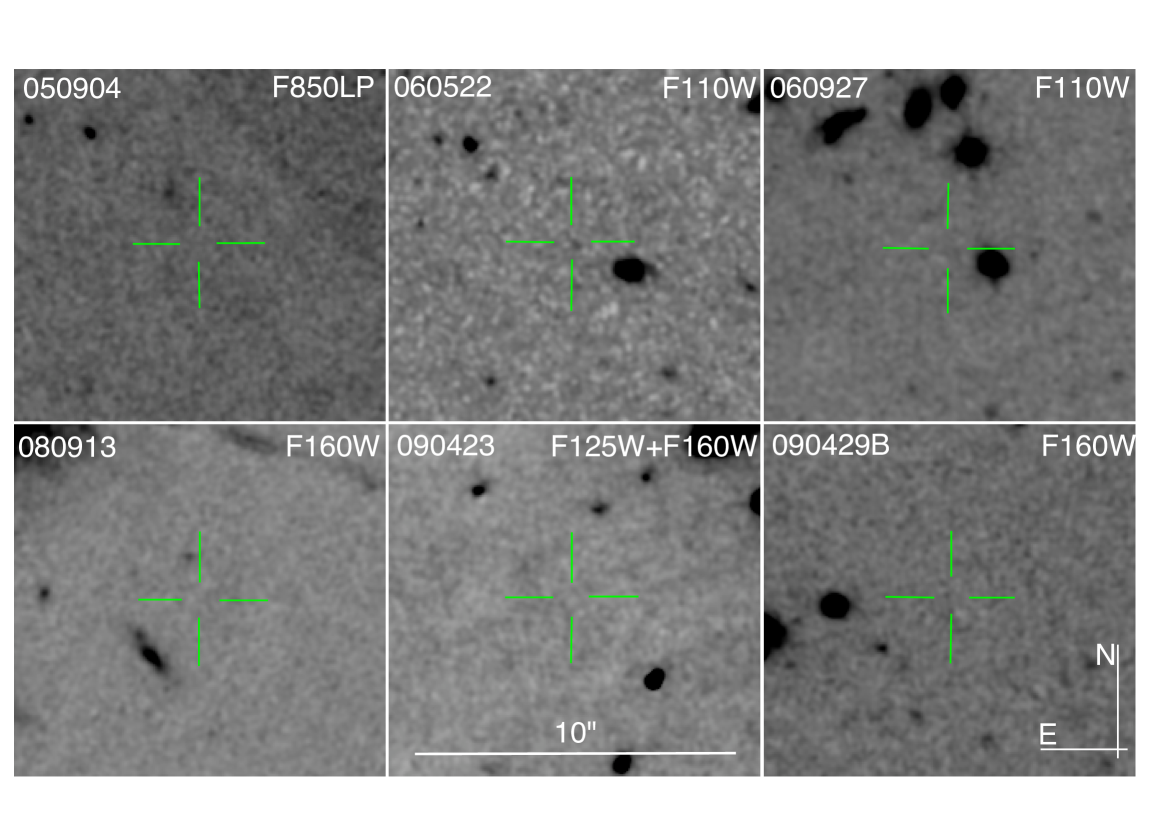
The exact locations of each burst on the HST images were found relative to field sources using ground-based images of their afterglows. Details of the data obtained for each burst and the rms accuracy of the astrometric calibration are summarised in Table 1.
For photometry, following Bouwens et al. (2010a), we employed 04 diameter apertures centred at the locations of the afterglows (for reference, 04 corresponds to a physical scale of kpc at ). We note this is appropriate since GRBs are generally found to be close to the UV-brightest regions of their hosts (Fruchter et al., 2006), and the sizes of high- galaxies are found to be intrinsically small (e.g. 0.70.3 kpc was found for –8 galaxies in the HUDF by Oesch et al., 2010). The prior knowledge of the exact locations of the GRBs allows us to adopt a excess flux as a reasonable detection threshold, which is unlike blind searches where a much higher level of significance is required to both ensure confidence that the source is real and also to reliably constrain the photometric redshift. For comparison to galaxy samples, and GRB hosts at other redshifts, it is relevant to consider the appropriate aperture corrections222i.e. the limits in this table are given by . The aperture corrections are calculated from the encircled energy (e.g. http://www.stsci.edu/hst/wfc3/documents/handbooks/currentIHB/ c07_ir07.html) and have values for WFC3/IR of , for ACS/WFC (Sirianni et al., 2005), and for NICMOS/NIC3 . http://www.stsci.edu/hst/nicmos/documents/handbooks/ current_NEW/c04_imaging.6.5.html , and these are included in the limits shown in Table 2. Our errors are determined in each case from the variance within a set of apertures of equal size to our source aperture, placed at random blank sky locations in the field surrounding the source.
The results of the photometric analysis, and inferred limits on host properties, are given in Table 2. Note that we report the measured sky-subtracted flux densities even when they are not significant detections, or indeed are formally negative. This is to allow comparison with models, as is done in Section 3.
2.1. GRB 060522
Spectroscopy of GRB 060522 was performed by Keck roughly 12.5 hours after the burst, and revealed a strong break Å in the spectrum, interpreted as Ly at (Cenko et al., 2006). A search for the host galaxy with the Spitzer Space Telescope found no detection to flux densities of 0.2 Jy at 3.6 m and 2.4 Jy at 5.8 m, implying that its rest-frame optical luminosity lies substantially below (Chary et al., 2007).
We obtained observations of GRB 060522 with WFC3/IR using the F110W filter. To ascertain the precise location of the burst on our HST image we performed relative astrometry between our WFC3 observations and an image obtained at the Telescopio Nazionale Galileo (TNG) on 22 May 2006 (D’Avanzo et al., 2006). At the location of the afterglow we measure a flux density of nJy, corresponding to a (aperture corrected) magnitude limit of F110W(AB) . Although formally this is a non-detection at it is possible that some host flux is contributing within the aperture. Indeed visually it appears there is a somewhat more significant excess of flux which is offset slightly south-west from the GRB location (by about 03, or kpc at ), and if we increase the aperture size to 06 diameter then the flux density becomes nJy. This would represent a marginal detection, and corresponds to an apparent magnitude of F110W(AB)28.5. While this is a plausible magnitude for a host (corresponding to ), the probability of a chance alignment with an unrelated object at such faint magnitude levels is also non-negligible. Specifically, considering the F110W number galaxy number counts from Thompson et al. (1999) we estimate % of random locations will have a galaxy of magnitude F110W(AB) within 05. Thus in a sample of six, as we have, there is a % chance of an unrelated galaxy being close enough to be possibly mistaken for a host in at least one case. For the sake of consistency with the other bursts we will continue to use the 04 aperture limit in the remainder of the paper.
2.2. GRB 060927
GRB 060927 was detected by Swift, and its optical afterglow was initially found in rapid, but unfiltered Rapid Optical Transient Source Experiment (ROTSE) observations. An extensive follow-up campaign (reported in Ruiz-Velasco et al., 2007) revealed the source to be an -band drop-out, well detected in the -band. A subsequent spectrum obtained at the Very Large Telescope (VLT) showed a faint continuum redward of Å, as well as a weak Si II absorption feature, consistent with a redshift of .
Our HST/NICMOS observations of the field of GRB 060927 were taken using the F160W filter, and were reduced as described in Fynbo et al. (2005). GRB 060927 was additionally re-observed with WFC3/IR using the F110W filter. Astrometry was performed via observations made with the VLT on 30 September 2006. To establish the position on the NICMOS images (which have a narrower field of view than WFC3) we opted to perform relative astrometry directly to the WFC3 images. The resulting rms astrometric accuracy is 001, and so does not impact the overall error in the astrometric solution described above.
At the location of the afterglow the photometry in each of the NICMOS and WFC3/IR observations yields limiting magnitudes of F160W(AB) and F110W(AB) respectively.
2.3. GRB 050904
GRB 050904 was the first GRB at to be located. Its optical/IR afterglow was initially found by Haislip et al. (2006), who derived a photometric redshift of based on the strong spectral break between the and - and -bands, coupled with nIR observations showing a blue spectral slope redward of the break (see also Tagliaferri et al., 2005). The afterglow was intrinsically extremely bright, amongst the brightest observed for any burst, making late time spectroscopy feasible with Subaru. This provided a measurement of the absorption redshift, hydrogen column density, and metallicity of the host (Kawai et al., 2006; Totani et al., 2006). It remains the most distant burst for which all of these diagnostics are available.
A search for the host galaxy of GRB 050904 was conducted by Berger et al. (2007) using both HST and Spitzer, which placed deep limits on any host emission. The first HST epoch, at which time both ACS/F850LP and NICMOS/F160W images were obtained, was carried out only about three weeks post-burst. No significant flux was detected in F850LP, and the faint detection in the F160W image was shown to be due to residual afterglow contamination since it was absent in a later F160W epoch (Berger et al., 2007).
For our analysis, we re-reduced the ACS data for GRB 050904 (since we are primarily interested in the rest-frame UV luminosity close to Ly, this filter is the more relevant). Astrometric tying of the afterglow to field sources was done utilizing a -band image obtained from Gemini-South on 7 September 2005. At the location of the afterglow in the F850LP frame we measure a flux density of nJy, corresponding to a limit of F850LP(AB) (or 27.06 at ). This is in good agreement with the limits reported by Berger et al. (2007). However, since the Ly break lies within the filter bandpass at this redshift, we must account for flux lost due to IGM absorption (i.e., the effective filter width is narrower for this host), and so we conclude a corrected magnitude limit of F850LP(AB) .
2.4. GRB 080913
GRB 080913 was identified as a high redshift candidate based on photometric observations with GROND showing the burst to be an -band drop out (Rossi et al., 2008). Deep, red spectroscopy from the VLT showed a strong spectral break, interpreted as Ly at (Greiner et al., 2009). A further detailed analysis of the spectrum by Patel et al. (2010) revealed a single absorption line of Si II at , and we adopt this as the redshift of GRB 080913.
We obtained HST observations with WFC3/IR in the F160W filter. To tie the astrometry of our HST observations we utilized images obtained from FORS2 at the VLT on 13 September 2008 in the -band, and images taken with NIRI on Gemini-North on 14 September 2008. We used two images independently to confirm the precise location of GRB 080913 on our HST images. For the FORS2 images we identified 9 compact sources in common, while only 6 sources were usable from the Gemini observations. Although the afterglow detections are of low S/N, the errors on their centroids are small in comparison to the errors derived from the fit and hence we are able place the afterglow to a rms accuracy of 008. Again, no host galaxy is visible in our observations to a limit of F160W(AB) .
2.5. GRB 090423
GRB 090423 was first identified as a candidate high-redshift object based on its afterglow being a -band dropout, which implies (Cucchiara et al., 2009). VLT spectroscopy with both ISAAC and SINFONI allowed the identification of the Lyman break, despite low S/N, establishing the redshift (Tanvir et al., 2009). This value is in excellent agreement with the determined from a spectrum obtained at the TNG (Salvaterra et al., 2009).
We obtained our first HST observations of GRB 090423 on 24 January 2010. At this stage we acquired 20 orbits in each of the F125W and F160W filters on WFC3. Unfortunately 15 of these 20 orbits were substantially impacted by persistence from earlier observations of bright field sources. This affected the sensitivity over wide regions of the detector, although does allow us to measure the flux at the location of the GRB host (which was only mildly affected by persistence). Additional observations were obtained in October 2010. All of the available observations in each filter were co-aligned and stacked via multidrizzle. These observations are extremely deep, with limiting magnitudes a factor 1.5 deeper than the WFC3 Early Release Observations of the Chandra Deep Field South/Great Observatories Origins Deep Survey (CDF-S/GOODS) fields, and only another factor of 1.5 shallower than the WFC3 observations of the HUDF (Bouwens et al., 2011c)
The location of the afterglow on our HST images was achieved by tying the astrometry to VLT/HAWK-I observations that were obtained approximately 17 hours post burst. While the afterglow had faded since its first discovery from Hawaii, these deep observations yielded similar signal-to-noise, with the added advantages of a larger field of view, and a greater number of faint sources for comparison.
Within the HST image there is no obvious source at the afterglow location, the measured limiting magnitudes are F125W(AB) , F160W(AB) . Since both filters sample the rest-frame far-UV, we form a weighted average of the two results to provide a combined flux density measure of nJy, which is used to derive the limit on the SFR reported in Table 3. Such a small host is consistent with the non-detection of molecular gas from the GRB location (Stanway et al., 2011).
2.6. GRB 090429B
GRB 090429B is the only host within our sample that does not have a spectroscopically measured redshift. However, the photometric break between the - and -bands, coupled with the blue spectral slope between and provides a best-fit photometric redshift of and a robust lower limit to the redshift of (Cucchiara et al., 2011). As we commented above, the smooth power-law spectra of GRB afterglows makes photometric redshift estimates generally more reliable than they are for galaxies, since the range of intrinsic spectral variation is much less (e.g., Krühler et al., 2011). We obtained observations in F606W (ACS), F105W, and F160W; the non-detection of a host galaxy in these images, including the blue filters, provides additional support for the high- origin for this burst, since the hosts of GRBs at have so-far always been detected in HST optical imaging. Here we consider primarily the F160W observation, since this is the only filter redward of Ly at the best-fit redshift . However, for completeness we also report results for the lower limit, which allows us to use both the F105W and F160W data.
We ascertained the location of the burst on the HST images via relative astrometry between our first epoch -band observations and those obtained with HST. The limiting magnitude at this location is F160W(AB). This is shallower than for the majority of the bursts in our sample, since only a two orbit exposure was obtained. However, despite this the image still probes to faint limits comparable to the likely characteristic galaxy luminosity, , at .
3. Analysis and Discussion
3.1. Limits on host properties
3.1.1 Star formation rates
At the redshifts of the bursts in question our nIR observations probe rest-frame wavelengths roughly in the range 1300-2000 Å. Limits on the UV luminosity at these wavelengths provide direct constraints on the host star-formation rates. A potentially important consideration in the UV is the effect of extinction by dust, which could lead to a significant underestimate of the true SFR if uncorrected. However, observational constraints from GRB afterglows at high redshifts (Greiner et al., 2009; Tanvir et al., 2009; Zafar et al., 2011b) suggest that extinction corrections are likely to be small. Similarly the blue colours of the candidate galaxies identified in the deep HST fields (e.g., Bouwens et al. (2010b), Finkelstein et al. (2011), but see also McLure et al. (2011)) also argue for little dust in most early star-forming galaxies. We therefore assume dust extinction can be neglected.
Following Madau et al. (1998) we estimate the star formation rates based on the UV luminosity at 1500 Å (see also discussion in Bunker et al., 2010):
| (1) |
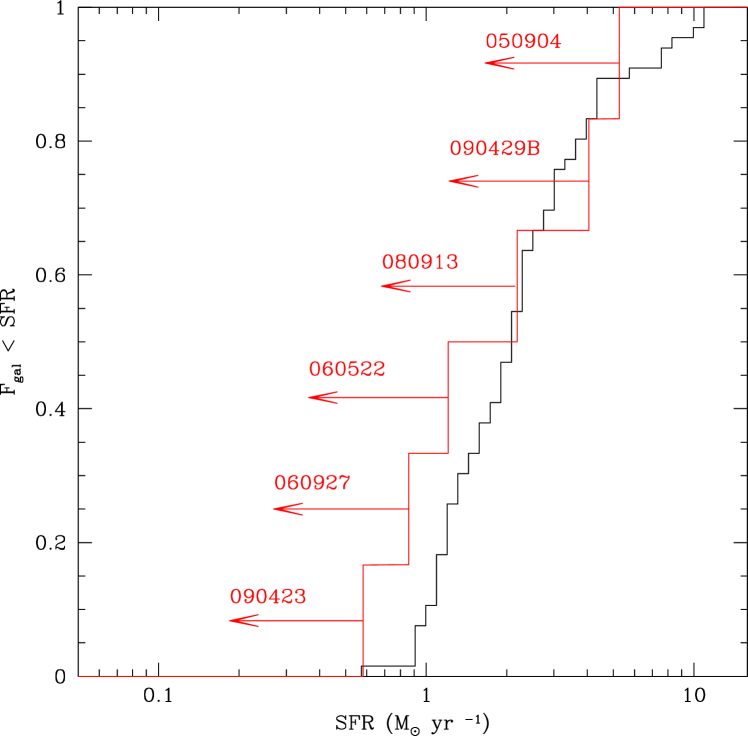
As discussed in Section 2.1, there is a marginal detection of what may be the host of GRB 060522 at , slightly offset from the burst position, but otherwise none of the hosts are significantly detected. The inferred limits on their star formation rates are given in Table 3, and in Figure 2 are plotted as a cumulative histogram of upper limits, compared to the SFRs for a sample of HUDF galaxies from Bouwens et al. (2011c). The limits span the range M⊙ yr-1, and indicate that the total star formation rates in these galaxies are modest. For comparison, the median SFR for GRB hosts at are found to be around 1–2 M⊙ yr-1 (Svensson et al., 2010).
3.1.2 Stacked limits on host galaxy emission
The observations of six high- fields provide the opportunity to stack the resulting data in an attempt to provide either a combined detection, or composite limit on the observed host luminosity. However, this is complicated by the use of different instrument and filter combinations to obtain the imaging. Therefore, we do not attempt to include data taken with different instruments, and consider a stack of only the WFC3 observations. Thus, we omit the observations of GRB 050904, and the NICMOS observations of GRB 060927. To perform the stack we first re-scaled the individual images (taken in different filters) such that the units of each image can be considered equivalent. We then computed the necessary offsets to overlay the burst positions, and re-drizzled onto a single output frame with these offsets applied. Simple aperture photometry at this location was then performed, with our errors based on the scatter in background apertures as before. The mean luminosity distance is 68500 Mpc, corresponding to a mean redshift of . There is no significant excess flux at the afterglow location, and formally the measured stacked flux density is nJy. Hence, the mean flux density of each host galaxy is constrained to be nJy, corresponding to a limit of , equivalent to an absolute magnitude and SFR 0.17 M⊙ yr-1, at this mean redshift.
3.2. Constraints on high redshift galaxy luminosity functions
Although our small sample of high- GRBs does not yet allow us to place strong constraints on the galaxy LF, we can test whether the limits on the host magnitudes are consistent with them having been drawn from the LFs suggested by other studies of galaxy populations with redshifts between 5 and 10.
The recent re-observations of the Hubble Ultra-Deep Field with WFC3/IR have revealed a population of -band and -band dropouts, with colours consistent with galaxies at and respectively (Bunker et al., 2010; McLure et al., 2010; Bouwens et al., 2010a). A single candidate galaxy (-band drop out) has also been identified (Bouwens et al., 2011a). From these samples, assuming they are substantially complete and uncontaminated, it is possible to make some statements about the form and evolution of the galaxy LF from . In particular, these authors fit their data in bins of redshift with the LFs described by a Schechter function (Schechter, 1976):
| (2) |
where , with being the characteristic luminosity of the “knee” of the LF. Here is the power-law slope towards faint luminosities and is a normalisation factor. Of course, there are no strong observational reasons to expect the LF to have this form at high-, but it is supported by theoretical work (Trenti et al., 2010).
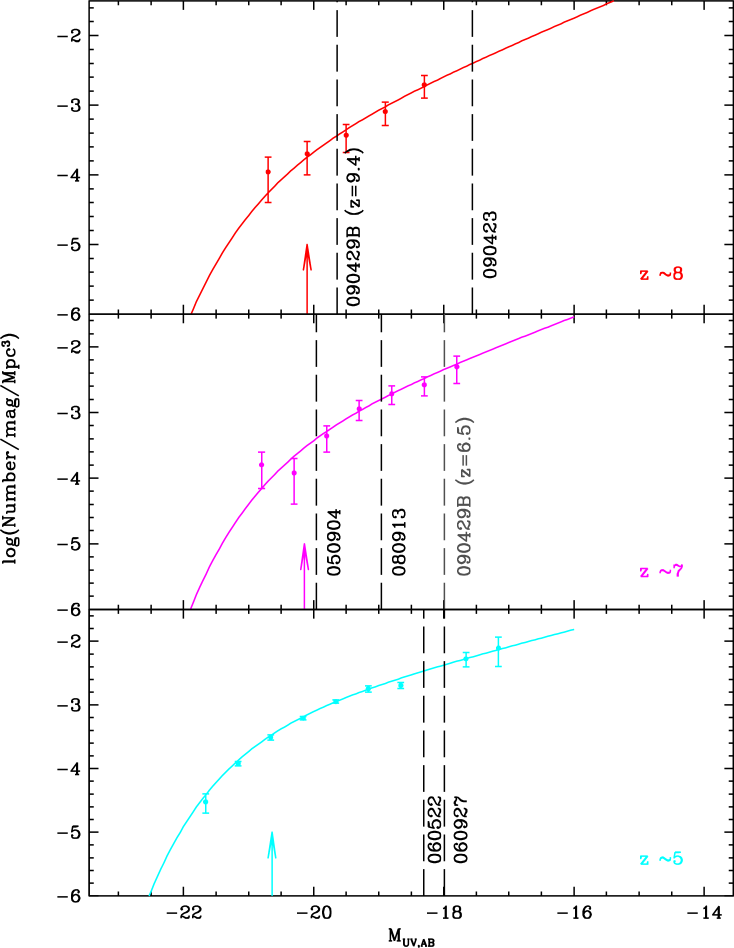
In Figure 3 we show the preferred analytical LF fits of Bouwens et al. (2011c) and the data on which they are based, for samples at , 7 and 8. Their conclusion is that the characteristic knee in the luminosity function, , becomes slowly fainter with increasing redshift from 4–8, and at the same time the faint end slope becomes steeper, reaching a value of by . This is in addition to the overall normalisation, , lowering (but see also McLure et al., 2010, who find a fading and lower but less evidence for a steepening slope). This indicates that an increasing proportion of star formation is occurring in fainter galaxies, and indeed formally the integrated luminosity represented by a Schechter function with diverges without some lower cut-off luminosity. However there are important caveats which pertain to these analyses: firstly, the LF parameters are based on entire samples, and any incompleteness or contamination (particularly difficult to rule out at the faint end) will introduce biases; secondly, even the HUDF is limited to finding galaxies in the top few magnitudes of the LF, so that the conclusions about total star-formation rate (and hence the production rate of ionizing photons) are sensitive to the untested assumption that a Schechter function is the appropriate form, and to the large uncertainties on the measurement of the faint-end slope.
We note that at high redshift the UV luminosity function has limitations as a way of representing the whole population of galaxies, since they are typically only visible when in the starbursting phase, and likely remain in this state for only a short duration based on the typical ages, and apparent availability of molecular gas for star formation within them. However, particularly for understanding the contribution of galaxies to the reionization of the Universe, the measured UV luminosities, which are more representative of star formation occurring with the last Myrs, are the relevant quantities. Furthermore, since the GRB itself is a sign of ongoing massive star formation within the host, one would expect the likelihood that a GRB occurs to scale with the UV luminosity. Indeed, we would expect the region immediately underneath the burst to be extremely UV-bright, as is observed in the more local GRB population (Fruchter et al., 2006). Hence we can meaningfully compare our limits on host emission with the observed galaxy LFs at .
The luminosity limits for the GRB hosts are also shown graphically in relation to the high- galaxy LFs in Figure 3, while their tabulated UV absolute magnitude limits are given in Table 2. As can be seen, all the hosts are apparently below (the AB magnitude corresponding to ) at their respective redshifts, and in the case of our observations of GRB 090423 have the ability to probe to fainter limits than has so far been possible with the Ultra-Deep Field observations. This is because, despite the shallower depth of our images, we have prior knowledge that an object exists at this location, and so can accept a lower formal significance level for detection (since the chances of a random noise fluctuation are lower due to the much smaller area under consideration). Furthermore, since we do not need a blue “veto” filter we make more efficient use of the available exposure time; in contrast to some Lyman break searches which are limited by the depth of their short-wavelength (blueward of Ly) imaging.
These observations of GRB host fields allow us to test the validity of the galaxy LFs that have been derived from deep field observations. We assume that there is no dependence of GRB rate or luminosity on environmental parameters such as metallicity, which, as discussed in Section 1, is certainly plausible at high redshifts when the bulk of star-forming galaxies were generally not highly enriched. We also assume that any dust extinction is minor, as argued in Section 3.1.1. Then the probability that a galaxy produces a GRB in some unit time (the probability of more than one GRB in realistic observing times being negligible) is approximately proportional to its rest-frame UV flux, since massive stars are responsible for producing both: i.e., . Thus, because we would expect GRBs to be drawn randomly from the total stellar UV luminosity, this means that the host galaxies should be drawn from the luminosity-weighted galaxy LF.
In practice, the best fit values for the faint end slope and characteristic luminosity at each redshift considered were determined from the fitting formulae given by Bouwens et al. (2011b), and are summarised in Table 3. We can then calculate a luminosity-weighted luminosity function, which (suitably normalised) we take to be equivalent to a probability density function (PDF) for the intrinsic host luminosity:
| (3) |
where is the luminosity function at redshift . We emphasize again that, since we are going to compare to the fluxes measured in apertures at the exact GRB location, we are also assuming there is no significant offset between the GRB and its parent galaxy.
Hence, the probability of observing a GRB in a galaxy of luminosity can be obtained via the cumulative probability density function (CDF):
| (4) |
Setting a lower limit, , for the integral is physically motivated since small dark halos () at are expected to retain little gas and form few stars (Read et al., 2006). Given the apparent steepness of the faint end slope of the LF at it is also important that the value of be sensibly chosen. It is not feasible to directly measure this lower limit at high redshift since it is well below the detection threshold for deep imaging, and will remain so even in the era of the James Webb Space Telescope (JWST) or ground-based Extremely Large Telescopes (ELTs). However, it is possible to provide estimates via simulations (Read et al., 2006), or from the star formation histories of the lowest mass galaxies in the local universe (e.g. Weisz et al., 2011). This latter approach suggests that the lowest mass galaxies attain total stellar masses of M⊙, over a Hubble time, implying mean star formation rates of M⊙ yr-1. However, star formation is likely to be episodic, and characterized by periods when the SFR is markedly higher than this average, and other times when the star formation is inactive, and the galaxy effectively invisible in the UV. Indeed, the study of Weisz et al. (2011) suggests that the SFR of local dwarfs was somewhat higher in the early Universe than their average SFR over the Hubble time. On the basis of this we adopt a cut-off value of erg s-1Hz-1 which is equivalent to , and is similar to that considered by other recent studies (Bouwens et al., 2011b; Kuhlen & Faucher-Giguère, 2012). This corresponds to a star formation rate of M⊙ yr-1. We note, that when (i.e., for redshifts less than ) the precise choice of has little impact on the results.
3.2.1 Analysis I
We now consider the question: what is the probability that each host individually is fainter than the upper bound we have inferred for its luminosity? To this end, we calculate for each host by setting in Equation 4 equal to this upper bound.
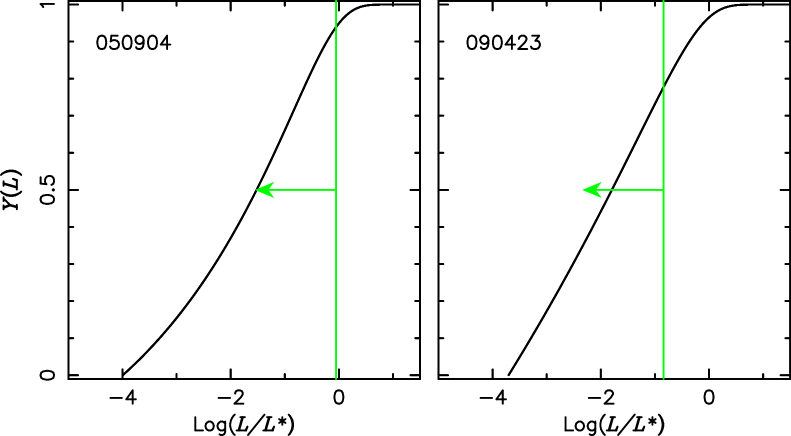
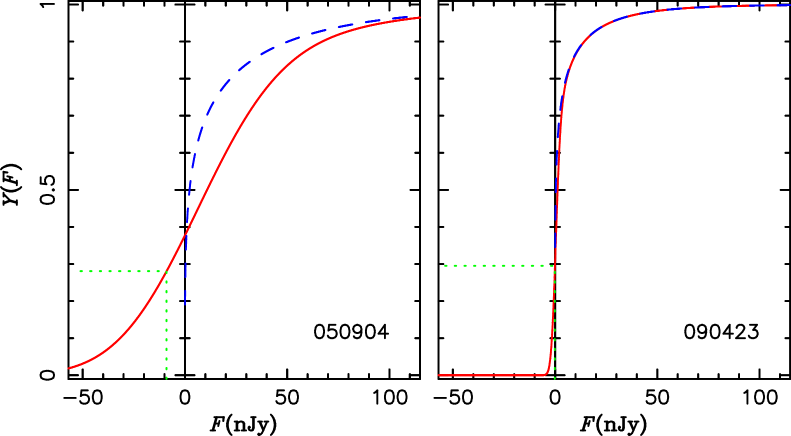
The results are summarised in Table 3 and illustrated in Figure 4, which shows the CDFs for luminosity (expressed relative to at the redshift in question) of two bursts from our sample, together with the detection limits for the corresponding HST frames. We see that, given the above assumptions, it is not surprising to find individual hosts to be undetected since the majority of the likelihood lies below these bounds. However, the joint probability that none of the hosts is detected is only . While not a highly significant result, this does suggest that a non-evolving LF, in which more star formation was taking place in galaxies with luminosities around , would not sit comfortably with the apparent faintness of the GRB hosts.
3.2.2 Analysis II
A weakness of the above approach is that it does not make full use of the joint probability of the formally measured fluxes at the positions of the whole sample of GRB hosts. As an alternative, we perform the following analysis, again with the aim of testing the evolving galaxy LFs proposed by Bouwens et al. (2011b).
As before, we construct a CDF for host luminosity, but now turn this into an equivalent CDF for observed flux density using the cosmological luminosity distance for the given redshift, having accounted for the aperture corrections. The next step is to convolve this with the observational errors appropriate for the given GRB field observation, in order to obtain a CDF for the observed host galaxy flux density:
| (5) |
where is a gaussian with a width dictated by the sky noise in each image, measured from numerous sky apertures of equal radius to the source aperture. is the formal flux measurement at the location of the GRB, and the minimum flux density, , is appropriately scaled from the minimum luminosity, discussed above.
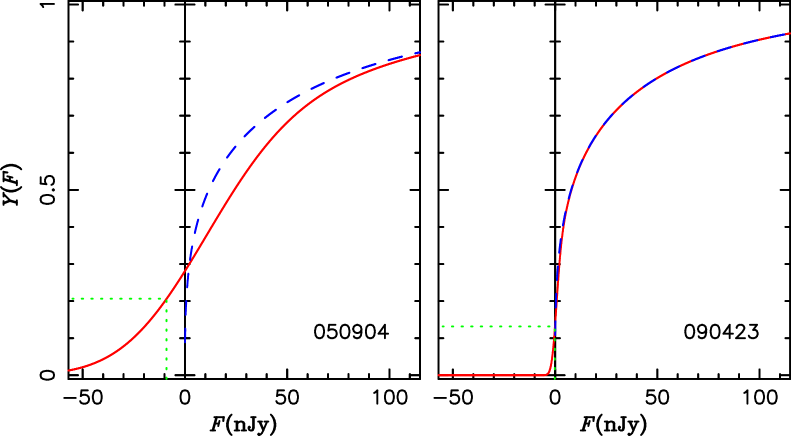
For illustration, the CDFs for two of our bursts are shown in Figure 5 (red curves), along with the CDFs for true host flux for comparison (blue curves). The green lines indicate the formal measured flux density at each GRB position. Note, that for GRB 090423 we take a weighted average of the results for both filters, since they straddle 1500 Å, while in the analysis of GRB 060927 we use the F110W flux density, being the closest match to 1500 Å. If the assumptions we have made are correct, then we would expect these measured flux densities to be drawn randomly and uniformly from 0 to 1 on the cumulative probability axes. We can quantify this by calculating the average value for , consistent with an expected value of from the Central Limit Theorem.
However, we can also repeat the analysis, but this time fix the LF parameters for all the hosts to be that found at lower redshift. Specifically, we first choose and , as measured at by Reddy & Steidel (2009). Thus we are testing here whether the hosts could be drawn from a luminosity function whose shape (but not normalisation) does not evolve from to high redshift. The results in this case for the same two bursts are shown in Figure 6. Now all the measured flux densities at the GRB locations are close to or below the level, with a mean , thus rejecting the model at % confidence (% if we took for the redshift of GRB 090429B and averaged the F105W and F160W limits). An alternative test would be to fix the parameters to those found at –7 by McLure et al. (2010), and . Again, this model is weakly rejected at the % level (%).
Our result is not a highly significant, but does support an evolving galaxy LF, with an increasing proportion of star formation occurring in faint galaxies. It also demonstrates that a larger sample and/or deeper limits on host emission can begin to provide important tests of the high- galaxy LF.
| Date | UT Time | Filter | (Å) | Exp (s) | (nJy) | AB mag limit | Mλ/(1+z) |
|---|---|---|---|---|---|---|---|
| 060522 | |||||||
| 17 Oct 2010 | 10:30 | F110W | 1888 | 8395 | |||
| 060927 | |||||||
| 29 June 2007 | 11:30 | F160W | 2376 | 10240 | |||
| 25 Sept 2010 | 14:30 | F110W | 1782 | 13992 | |||
| 050904 | |||||||
| 26 Sept 2005 | 21:03 | F850LP | 1279† | 4216 | † | ||
| 080913 | |||||||
| 30 Nov 2009 | 16:10 | F160W | 1988 | 7818 | |||
| 090423 | |||||||
| 24 Jan 2010 | 11:34 | F160W | 1665 | 13029 | |||
| 25 Jan 2010* | 14:44 | F160W | 1665 | 13029 | |||
| 26 Jan 2010* | 13:06 | F125W | 1353 | 13029 | |||
| 27 Jan 2010* | 13:04 | F125W | 1353 | 13029 | |||
| 22 Oct 2010 | 18:23 | F125W | 1353 | 13029 | |||
| 27 Oct 2010 | 16:36 | F125W | 1353 | 13029 | |||
| 090429B | |||||||
| 10 Jan 2010 | 21:54 | F160W | 1478 | 2412 | |||
| 22 Feb 2010 | 19:22 | F160W | 1478 | 2412 | |||
| (2049) | |||||||
| 24 Feb 2010 | 03:19 | F105W | 1014 | 2412 | |||
| 28 Feb 2010 | 13:56 | F105W | 1014 | 2412 | |||
| (1407) |
Note. — Log of HST observations of the locations of our sample of bursts giving the details of the observations and the pivot wavelength of the filter at the assumed redshift, . represents the measured (sky-subtracted) residual flux density in an aperture of diameter 04, centred on the position of the afterglow. The point-source limits on apparent magnitude (after aperture correction) and corresponding absolute magnitude for each filter are also given. *Images affected by persistence. †Filter central wavelength and flux density calibration have been corrected for the fact that the Ly break for GRB 050904 falls roughly in the middle of the filter response, and so in effect only the longer wavelength part of the filter passband is actually sensitive to the flux from the host, and the quoted limit is for the flux density redward of Ly. ♠Result if GRB 090429B was actually at the lower limit for its photometric redshift of .
3.3. Implications for reionization
Whether UV radiation from star-forming galaxies is sufficient to bring about and sustain the reionization of the IGM above is a long-standing question (e.g. Loeb, 2009). Recently a number of authors have argued that an increasingly steep faint end to the galaxy LF, motivated by theoretical considerations, may be able to achieve this, without resorting to extremely high Lyman continuum escape fractions (e.g. Bouwens et al., 2011b; Lorenzoni et al., 2011; Kuhlen & Faucher-Giguère, 2012). However, the form, steepness and faint-end cut-off of the galaxy LF at are very poorly constrained by current data, since HST (and even in the longer-term JWST and ground-based 20–40 m class optical/nIR telescopes) can only directly probe the bright end of the LF.
If GRBs are sampling star formation in an unbiased way, as we argue they may be at early times, then they provide an alternative window on the total star formation rate which would ultimately circumvent the necessity to detect the individual galaxies in which the star formation is occurring. Our results, even from the small sample of high-redshift bursts currently available, already support an evolving galaxy LF over a non-evolving one, and therefore suggest that reionization may be brought about primarily from stars born in very faint proto-galaxies.
3.4. Possible biases
It is worth considering further possible physical effects which may be biassing our conclusions. If a significant amount of star formation at high- is actually dust enshrouded, which we believe is unlikely, then it would impact on the observability of GRBs and their hosts, as well as the LBG samples. One would generally expect that the GRBs for which afterglows are detected and redshifts estimated would typically be in the lower dust systems, if there is indeed a wide range, and so in that sense, their hosts could still be compared directly to the (also preferentially dust free) LBG samples. From the point of view of reionization, of course it is the low-dust star formation that is more likely to have a high escape fraction of ionizing radiation, so our conclusions are likely to be valid in that respect.
As discussed in section 1, we should also be concerned about possible GRB metallicity sensitivity. Both theoretical considerations and observational evidence (the blue colours of the LBG samples) argue that few star-forming galaxies at will have high metallicities (e.g. supersolar) and therefore the low rate of GRBs in such systems seen at low redshift is not likely to be an important factor at high-. Of course, it could be that a contrary effect becomes important at some point, for instance if very low metallicity populations produce fewer and/or fainter GRBs. However, if that were the case then we would expect to lose, if anything, the lower mass halos, where any metals produced are most easily lost. Hence, such an effect would seem unlikely to result in finding an unusually faint population of hosts, and so again our basic conclusion would only be strengthened.
4. Conclusions
We have presented HST observations of a sample of six GRB host galaxies beyond . One host, that of GRB 060522 at may be marginally detected, but the others are undetected to deep limits, typically at . If GRBs are good tracers of the locations of star formation at high- our results confirm that much, and probably the majority of, star formation then was taking place in small galaxies that are too faint to be detected even in the various HST deep field surveys. While the sample is small, the joint probability that none of the hosts are detected is consistent with a galaxy LF which is rapidly evolving to higher redshifts, and marginally inconsistent with an LF whose shape does not evolve.
Our analysis does rely on two assumptions: that environmental conditions, such as abundance variations, do not produce appreciable variations in the SFR to GRB-rate ratio from galaxy to galaxy, and that dust content is generally negligible. Both of these are consistent with our current understanding of early galaxies, and of GRBs, but doubtless work is required to further clarify these issues. In terms of the effect of dust, we note that from the point of view of reionization, the un-corrected luminosity function is really what we are interested in, since it is largely the unobscured star formation which will contribute to the inter-galactic UV radiation field. However, if there were significant dust in some GRB hosts, it would weaken the connection between GRB-likelihood and apparent UV luminosity which we have assumed.
This work demonstrates the potential power of GRB-selected galaxy samples to quantify the amount of star formation occurring in faint galaxies at early times, which is essential for understanding the budget of UV photons and their role in reionizing the Universe. In the future, deep imaging of larger samples of GRBs at high-, combined with better understanding of any environmental dependencies of GRB production, could provide much more stringent constraints on the faint-end of the galaxy luminosity function. Specifically, such a sample could in principle be used to fit for all the LF shape parameters, including the minimum cut-off luminosity, or, more empirically, simply determine the relative SFR fraction in bright (detected) galaxies compared to that in faint (undetected) galaxies, without any prior assumption about the form of the LF.
Just as this paper was submitted, two other papers on the same topic appeared as preprints. Basa et al. (2012) have reported deep VLT observations of three high- fields, of GRBs 060522, 060927 and 080913. The point-source magnitudes reached are rather shallower than the HST limits, and their non-detections therefore consistent with our results. Trenti et al. (2012) instead performed a theoretical analysis, aimed at predicting the fraction of GRB hosts expected to be detected in deep HST imaging at different redshifts, under various model assumptions. For example, they predict that 50% of GRB hosts at should be detected in a survey reaching , consistent with our possible detection of the GRB 060522 host. To the same rest-frame limit, they predict fewer than 20% of hosts should be detected at , again, in agreement with our findings.
Traditional blank-field imaging surveys, while potentially finding larger samples of candidate galaxies, are limited to detecting just the relatively brightest examples at the most extreme redshifts. This may be true even in the era of the JWST, especially given the apparent dearth of candidates located so far in the HUDF (Oesch et al., 2012), which could be indicating an even more rapid evolution of the galaxy LF parameters. The approach we, and the other studies mentioned above, have adopted provides a crucial complementary insight into early galaxy evolution.
| Burst | UV,AB | (nJy) | / | SFR(M⊙yr-1) | |||||
|---|---|---|---|---|---|---|---|---|---|
| 060522 | 5.11 | -20.59 | 1.80 | 26.22 | 118 | 0.55 | 0.47 | ||
| 060927 | 5.47 | -20.49 | 1.81 | 26.43 | 97 | 0.55 | 0.43 | ||
| 050904 | 6.29 | -20.26 | 1.85 | 26.83 | 67 | 0.94 | 0.28 | ||
| 080913 | 6.73 | -20.14 | 1.88 | 27.33 | 43 | 0.82 | 0.44 | ||
| 090423 | 8.23 | -19.72 | 1.95 | 27.97 | 24 | 0.78 | 0.30 | ||
| 090429B | 9.4 | -19.39 | 2.01 | 28.59 | 13 | 0.96 | 0.82 | ||
| (6.5)♠ | (-20.20) | (1.87) | (26.68) | (77) | (0.71) | (0.46) |
Note. — Columns 3–6 give the galaxy luminosity function parameters assumed at the redshifts of each GRB obtained from the fitting formulae of Bouwens et al. (2011b), both in absolute terms and translated to apparent values (including correction to finite aperture). Columns 7–8 list the limits on host luminosity and star-formation rate; in the case of GRB 060927 based on just the F110W image, and for GRB 090423 based on the weighted average of both filters, as described in the text. Finally, columns 9–10 give the calculated probability that the host would be below this limit, and the position in the cumulative probability density function of the observed flux density, , based on an evolving galaxy LF (Section 3.2). The combined probability of the upper limits, the product of the figures in column 9, is 0.17. ♠Result if GRB 090429B was actually at the lower limit for its photometric redshift of .
References
- Basa et al. (2012) Basa, S., Cuby, J. G., Savaglio, S., Boissier, S., Clement, B., Flores, H., Le Borgne, D., & Mazure, A. 2012, ArXiv e-prints
- Berger et al. (2002) Berger, E., et al. 2002, ApJ, 581, 981
- Berger et al. (2007) —. 2007, ApJ, 665, 102
- Bloom et al. (2009) Bloom, J. S., et al. 2009, ApJ, 691, 723
- Bouwens et al. (2010a) Bouwens, R. J., et al. 2010a, ApJ, 709, L133
- Bouwens et al. (2010b) —. 2010b, ApJ, 708, L69
- Bouwens et al. (2011a) —. 2011a, Nature, 469, 504
- Bouwens et al. (2011b) —. 2011b, ArXiv e-prints
- Bouwens et al. (2011c) —. 2011c, ApJ, 737, 90
- Bunker et al. (2010) Bunker, A. J., et al. 2010, MNRAS, 409, 855
- Castro Cerón et al. (2006) Castro Cerón, J. M., Michałowski, M. J., Hjorth, J., Watson, D., Fynbo, J. P. U., & Gorosabel, J. 2006, ApJ, 653, L85
- Cenko et al. (2006) Cenko, S. B., Berger, E., Djorgovski, S. G., Mahabal, A. A., & Fox, D. B. 2006, GRB Coordinates Network, 5155, 1
- Chary et al. (2007) Chary, R., Berger, E., & Cowie, L. 2007, ApJ, 671, 272
- Chen et al. (2009) Chen, H.-W., et al. 2009, ApJ, 691, 152
- Chen et al. (2010) —. 2010, ApJ, 723, L218
- Christensen et al. (2004) Christensen, L., Hjorth, J., & Gorosabel, J. 2004, A&A, 425, 913
- Cucchiara et al. (2009) Cucchiara, A., Fox, D. B., & Berger, E. 2009, GRB Coordinates Network, 9209, 1
- Cucchiara et al. (2011) Cucchiara, A., et al. 2011, ApJ, 736, 7
- D’Avanzo et al. (2006) D’Avanzo, P., Piranomonte, S., Magazzu, A., & Mainella. 2006, GRB Coordinates Network, 5151, 1
- Faucher-Giguère et al. (2009) Faucher-Giguère, C., Lidz, A., Zaldarriaga, M., & Hernquist, L. 2009, ApJ, 703, 1416
- Finkelstein et al. (2011) Finkelstein, S. L., et al. 2011, ArXiv e-prints
- Fruchter et al. (2006) Fruchter, A. S., et al. 2006, Nature, 441, 463
- Fynbo et al. (2008) Fynbo, J. P. U., Prochaska, J. X., Sommer-Larsen, J., Dessauges-Zavadsky, M., & Møller, P. 2008, ApJ, 683, 321
- Fynbo et al. (2005) Fynbo, J. P. U., et al. 2005, ApJ, 633, 317
- Fynbo et al. (2006) —. 2006, A&A, 451, L47
- Fynbo et al. (2009) —. 2009, ApJS, 185, 526
- Gou et al. (2004) Gou, L. J., Mészáros, P., Abel, T., & Zhang, B. 2004, ApJ, 604, 508
- Greiner et al. (2009) Greiner, J., et al. 2009, ApJ, 693, 1610
- Haislip et al. (2006) Haislip, J. B., et al. 2006, Nature, 440, 181
- Hashimoto et al. (2010) Hashimoto, T., et al. 2010, ApJ, 719, 378
- Hjorth et al. (2003a) Hjorth, J., et al. 2003a, Nature, 423, 847
- Hjorth et al. (2003b) —. 2003b, ApJ, 597, 699
- Jakobsson et al. (2005) Jakobsson, P., et al. 2005, MNRAS, 362, 245
- Jakobsson et al. (2012) —. 2012, ArXiv e-prints
- Kawai et al. (2006) Kawai, N., et al. 2006, Nature, 440, 184
- Kocevski et al. (2009) Kocevski, D., West, A. A., & Modjaz, M. 2009, ApJ, 702, 377
- Komatsu et al. (2011) Komatsu, E., et al. 2011, ApJS, 192, 18
- Krühler et al. (2011) Krühler, T., et al. 2011, A&A, 526, A153
- Kuhlen & Faucher-Giguère (2012) Kuhlen, M., & Faucher-Giguère, C.-A. 2012, ArXiv e-prints
- Küpcü Yoldaş et al. (2010) Küpcü Yoldaş, A., Greiner, J., Klose, S., Krühler, T., & Savaglio, S. 2010, A&A, 515, L2
- Lamb & Reichart (2000) Lamb, D. Q., & Reichart, D. E. 2000, ApJ, 536, 1
- Le Floc’h et al. (2006) Le Floc’h, E., Charmandaris, V., Forrest, W. J., Mirabel, I. F., Armus, L., & Devost, D. 2006, ApJ, 642, 636
- Levesque et al. (2010a) Levesque, E. M., Berger, E., Kewley, L. J., & Bagley, M. M. 2010a, AJ, 139, 694
- Levesque et al. (2010b) Levesque, E. M., Kewley, L. J., Graham, J. F., & Fruchter, A. S. 2010b, ApJ, 712, L26
- Levesque et al. (2010c) Levesque, E. M., Soderberg, A. M., Kewley, L. J., & Berger, E. 2010c, ApJ, 725, 1337
- Loeb (2009) Loeb, A. 2009, JCAP, 3, 22
- Lorenzoni et al. (2011) Lorenzoni, S., Bunker, A. J., Wilkins, S. M., Stanway, E. R., Jarvis, M. J., & Caruana, J. 2011, MNRAS, 414, 1455
- Madau et al. (1998) Madau, P., Pozzetti, L., & Dickinson, M. 1998, ApJ, 498, 106
- McLure et al. (2010) McLure, R. J., Dunlop, J. S., Cirasuolo, M., Koekemoer, A. M., Sabbi, E., Stark, D. P., Targett, T. A., & Ellis, R. S. 2010, MNRAS, 403, 960
- McLure et al. (2011) McLure, R. J., et al. 2011, MNRAS, 1787
- McQuinn et al. (2008) McQuinn, M., Lidz, A., Zaldarriaga, M., Hernquist, L., & Dutta, S. 2008, MNRAS, 388, 1101
- Michałowski et al. (2008) Michałowski, M. J., Hjorth, J., Castro Cerón, J. M., & Watson, D. 2008, ApJ, 672, 817
- Miralda-Escude (1998) Miralda-Escude, J. 1998, ApJ, 501, 15
- Modjaz et al. (2008) Modjaz, M., et al. 2008, AJ, 135, 1136
- Mortlock et al. (2011) Mortlock, D. J., et al. 2011, Nature, 474, 616
- Natarajan et al. (2005) Natarajan, P., Albanna, B., Hjorth, J., Ramirez-Ruiz, E., Tanvir, N., & Wijers, R. 2005, MNRAS, 364, L8
- Oesch et al. (2010) Oesch, P. A., et al. 2010, ApJ, 709, L21
- Oesch et al. (2012) —. 2012, ApJ, 745, 110
- Ono et al. (2012) Ono, Y., et al. 2012, ApJ, 744, 83
- Patel et al. (2010) Patel, M., Warren, S. J., Mortlock, D. J., & Fynbo, J. P. U. 2010, A&A, 512, L3
- Perley et al. (2009) Perley, D. A., et al. 2009, AJ, 138, 1690
- Pian et al. (2006) Pian, E., et al. 2006, Nature, 442, 1011
- Pontzen et al. (2010) Pontzen, A., et al. 2010, MNRAS, 402, 1523
- Prochaska et al. (2007) Prochaska, J. X., et al. 2007, ApJS, 168, 231
- Racusin et al. (2008) Racusin, J. L., et al. 2008, Nature, 455, 183
- Read et al. (2006) Read, J. I., Pontzen, A. P., & Viel, M. 2006, MNRAS, 371, 885
- Reddy & Steidel (2009) Reddy, N. A., & Steidel, C. C. 2009, ApJ, 692, 778
- Robertson & Ellis (2012) Robertson, B. E., & Ellis, R. S. 2012, ApJ, 744, 95
- Rossi et al. (2008) Rossi, A., Greiner, J., Krüher, T., Yoldas, A., Klose, S., & Yoldas, A. K. 2008, GRB Coordinates Network, 8218, 1
- Ruiz-Velasco et al. (2007) Ruiz-Velasco, A. E., et al. 2007, ApJ, 669, 1
- Salvaterra et al. (2009) Salvaterra, R., et al. 2009, Nature, 461, 1258
- Savaglio et al. (2009) Savaglio, S., Glazebrook, K., & Le Borgne, D. 2009, ApJ, 691, 182
- Savaglio et al. (2011) Savaglio, S., et al. 2011, MNRAS, 2038
- Schady et al. (2012) Schady, P., et al. 2012, A&A, 537, A15
- Schechter (1976) Schechter, P. 1976, ApJ, 203, 297
- Sirianni et al. (2005) Sirianni, M., et al. 2005, PASP, 117, 1049
- Stanek et al. (2003) Stanek, K. Z., et al. 2003, ApJ, 591, L17
- Stanway et al. (2011) Stanway, E. R., Bremer, M. N., Tanvir, N. R., Levan, A. J., & Davies, L. J. M. 2011, MNRAS, 410, 1496
- Svensson et al. (2010) Svensson, K. M., Levan, A. J., Tanvir, N. R., Fruchter, A. S., & Strolger, L. 2010, MNRAS, 405, 57
- Svensson et al. (2012) Svensson, K. M., et al. 2012, MNRAS, 421, 25
- Tagliaferri et al. (2005) Tagliaferri, G., et al. 2005, A&A, 443, L1
- Tanvir & Jakobsson (2007) Tanvir, N. R., & Jakobsson, P. 2007, Royal Society of London Philosophical Transactions Series A, 365, 1377
- Tanvir et al. (2004) Tanvir, N. R., et al. 2004, MNRAS, 352, 1073
- Tanvir et al. (2009) —. 2009, Nature, 461, 1254
- Thompson et al. (1999) Thompson, R. I., Storrie-Lombardi, L. J., Weymann, R. J., Rieke, M. J., Schneider, G., Stobie, E., & Lytle, D. 1999, AJ, 117, 17
- Thöne et al. (2010) Thöne, C. C., et al. 2010, A&A, 523, A70
- Totani et al. (2006) Totani, T., Kawai, N., Kosugi, G., Aoki, K., Yamada, T., Iye, M., Ohta, K., & Hattori, T. 2006, PASJ, 58, 485
- Trenti et al. (2012) Trenti, M., Perna, R., Levesque, E. M., Shull, J. M., & Stocke, J. T. 2012, ApJ, 749, L38
- Trenti et al. (2010) Trenti, M., Stiavelli, M., Bouwens, R. J., Oesch, P., Shull, J. M., Illingworth, G. D., Bradley, L. D., & Carollo, C. M. 2010, ApJ, 714, L202
- Vanzella et al. (2011) Vanzella, E., et al. 2011, ApJ, 730, L35
- Vreeswijk et al. (2004) Vreeswijk, P. M., et al. 2004, A&A, 419, 927
- Weisz et al. (2011) Weisz, D. R., et al. 2011, ApJ, 743, 8
- Wijers et al. (1998) Wijers, R. A. M. J., Bloom, J. S., Bagla, J. S., & Natarajan, P. 1998, MNRAS, 294, L13
- Wolf & Podsiadlowski (2007) Wolf, C., & Podsiadlowski, P. 2007, MNRAS, 375, 1049
- Woosley & Heger (2006) Woosley, S. E., & Heger, A. 2006, ApJ, 637, 914
- Yoon & Langer (2005) Yoon, S.-C., & Langer, N. 2005, A&A, 443, 643
- Yüksel et al. (2008) Yüksel, H., Kistler, M. D., Beacom, J. F., & Hopkins, A. M. 2008, ApJ, 683, L5
- Zafar et al. (2011a) Zafar, T., Watson, D., Fynbo, J. P. U., Malesani, D., Jakobsson, P., & de Ugarte Postigo, A. 2011a, A&A, 532, A143
- Zafar et al. (2011b) Zafar, T., Watson, D. J., Tanvir, N. R., Fynbo, J. P. U., Starling, R. L. C., & Levan, A. J. 2011b, ApJ, 735, 2