-titleThe 2011 Hadron Collider Physics symposium (HCP-2011),Paris, France, November 14-18 2011 11institutetext: CNRS-IN2P3/LLR-École Polytechnique, Palaiseau, France
Standard Model Higgs Combination from CMS with up to 1.7 of data
Abstract
The combination is presented of searches for a standard model (SM) Higgs boson in eight decay modes: , , , , , , , and . The searches were performed by the CMS Collaboration using 1.1–1.7 of integrated luminosity, depending on the analysis. No excess compatible with a SM Higgs signal has been observed; the largest excursion of the observed data from the expected background has a probability of 0.4 after taking into account the look-elsewhere effect. The SM Higgs boson is excluded at 95% C.L. in three mass ranges 145–216, 226–288, and 310–400 , while the expected exclusion range is 130–440 .
1 Introduction
Understanding of the mechanism of electroweak symmetry breaking is one of the main goals of the CMS physics program. In the standard model (SM) the electroweak symmetry breaking is described by so-called Higgs mechanism which leads to prediction of one scalar particle - a Higgs boson (H) Englert:1964et ; Higgs:1964ia ; Higgs:1964pj ; Guralnik:1964eu ; Higgs:1966ev ; Kibble:1967sv . So far, experimental searches for this particle have given negative results allowing to exclude its mass below 114.4 (LEP experiments Barate:2003sz ) and for 100–108 and 156–177 (Tevatron experiments CDFandD0:2011aa ). Indirect searches using fits to precise measurements predict relatively light Higgs boson with 158 :2010vi .
In this report combination is presented of searches for the Higgs boson in eight decay modes: , , , , , , , and .
The cross sections for Higgs boson production, its decay branching fractions, and their uncertainties are taken from the report prepared by LHC Higgs Cross Section group Dittmaier:2011ti .
2 Channels used in the combined search
The combination presented in this report bases on eight analyses corresponding to main decay modes of the Higgs boson as summarised in Table 1.
| channel | mass range | lumi. | no. of | type of |
|---|---|---|---|---|
| [ ] | [ ] | sub-chan. | analysis | |
| 110–150 | 1.7 | 8 | mass shape (unbinned) | |
| 110–140 | 1.1 | 6 | mass shape (binned) | |
| 110–135 | 1.1 | 5 | cut & count | |
| 110–600 | 1.5 | 5 | cut & count | |
| 110–600 | 1.7 | 3 | mass shape (unbinned) | |
| 180–600 | 1.1 | 8 | mass shape (unbinned) | |
| 250–600 | 1.6 | 2 | cut & count | |
| 226–600 | 1.6 | 6 | mass shape (unbinned) |
In the following subsections a brief description is provided of each individual analysis.
2.1 channel CMS-PAS-11-021
The analysis is a search for a narrow peak in the di-photon mass distribution on top of a large falling background. It is the most sensitive channel at low masses despite a small branching fraction ().
All events are divided into eight categories based on whether the transverse momentum of the di-photon system 40 , whether both photons are in the central part of the CMS detector, and whether both photons are unconverted (have compact electromagnetic showers). The categorisation is motivated by different resolution in each category (1-3%).
The background under the expected signal peak is derived from sidebands without use of Monte Carlo simulation.
2.2 channel CMS-PAS-11-009
In this analysis a broad excess in the visible di-tau mass distribution is looked for (resolution of 20%).
Three di-tau final states are used: , , ( stands for a decaying hadronically). Each of of these three categories is further divided into two mutually exclusive sub-categories: events with the Vector Boson Fusion (VBF) signature (two jets separated in pseudorapidity with no additional jets in between), and events with less than two jets or with exactly two jets that fail VBF requirements.
The main irreducible background is with normalisation taken from the cross section measurement and shape of modelled using simulated events. The reducible backgrounds (W+jets, QCD, , ) are evaluated basing on data.
2.3 channel CMS-PAS-11-011
The search exploits the Higgs boson production in association with W or Z bosons (V). The following W and Z boson decay modes are considered: and (). It is required that the system of two b-tagged jets (a Higgs boson decay candidate) is boosted in the transverse plane, which reduces background and improves the di-jet mass resolution.
The result of the analysis bases on event count in signal regions defined by the output of a multivariate analysis classifier (MVA). The classifier was trained for a number of Higgs boson masses.
The rates of the main backgrounds V+jets, , and are estimated from control samples and then applied to simulation. The WZ and ZZ backgrounds with , and the single-top background are modelled with Monte Carlo simulation.
2.4 channel CMS-PAS-11-014
The signature of the signal is the presence of exactly two opposite sign, isolated leptons and significant . There is no signal mass pick due to escaping energy due to presence of two neutrinos from W decays. The search is based on event counting.
Events are split into three categories basing on a jet multiplicity in the event (0, 1 or 2 jets) with different signal-to-background ratios. For the 0-jet category the main background is the electroweak WW production; for the 1-jet category the WW and processes. Both the 0- and 1-jet categories are further split into same-flavour and opposite-flavour di-lepton sub-channels, since different contribution of the Drell-Yan background. The 2-jet category is optimised to take advantage of the VBF production signature (jets separation in pseudorapidity). The main background for this category is .
To separate the signal from the electroweak WW background the scalar nature of the Higgs boson is explored.
Contributions from all main backgrounds are estimated basing on data.
2.5 channel CMS-PAS-11-015
The analysis is a search for a four-lepton mass peak over the continuum background. Three final states 4e, 4, 2e2 are considered separately, as each of them has a different resolution of and a different composition of background with jets faking leptons.
The dominant irreducible background is the electroweak ZZ production. Its contribution is modelled using simulation and normalised using the measured yield of events scaled by the ratio of ZZ and Z cross sections. The reducible backgrounds with jets faking leptons (Z+jets, , ) are evaluated from data using control regions. Their contribution was found to be small.
2.6 channel CMS-PAS-11-013
In the search, the presence is required of one di-lepton pair (ee or ) forming an on-shell Z boson. Then a second Z boson is required to decay to -pair, with one of the following four decay modes: , , , ( stands for a decaying hadronically). It makes eight exclusive sub-channels. In the analysis, the mass of two leptons and visible products of two tau decays (without accounting for missing neutrinos) is a final observable.
The dominant background is the electroweak ZZ production which is taken from simulation and normalised using the measured yield of events scaled by the ratio of ZZ and Z cross sections. The sub-leading backgrounds with jets faking tau come from Z+jets (including ZW) and , are evaluated from data using fake-rate method.
2.7 channel CMS-PAS-11-016
In the analysis, events with one di-lepton pair (ee or ) consistent with an on-shell Z boson, and significant are selected. Then the transverse mass from the di-lepton pair momenta and is constructed assuming that arises from the decay111. Finally, events are counted in a dependent window in the distribution.
The main ZZ and WZ backgrounds are taken from simulation, while all other backgrounds are evaluated from control samples.
2.8 channel CMS-PAS-11-017
The analysis is a search for a peak in the mass of the di-lepton plus di-jet system (). There are six exclusive final states used in the search with the lepton pair in one of two possible flavours (ee or ) and the jet pair with 0, 1 or 2 b-tags. Both lepton and jet pairs are required to be consistent with the Z boson mass. Background is further suppressed by employing a multivariate angular likelihood constructed from the kinematic variables of the two leptons and the two jets.
The background distribution is obtained using control regions in data.
3 Statistical methodology
The modified frequentist construction CLs Read:2000ru ; Junk:1999kv is used for calculations of exclusion limits presented in this report. To completely define the method, one needs to make a choice of test statistic and of treatment of the systematic uncertainties in the construction of the test statistic and in generating pseudo-data. Here the LHC Higgs Combination Group prescription LHC-HCG-Report:2011 is followed.
The likelihood used to construct the test statistic is defined as follows:
| (1) |
where is the Poisson probability to observe “data”, assuming signal and background models, and , that depend on some nuisance parameters . The free parameter is a common signal strength modifier affecting signal event yields in all production modes (). Nuisance parameters correspond with independent sources of systematic uncertainties. The probability of “measuring” which is best known estimate of true value is and describes the scale of the systematic uncertainty.
Then, the test statistics is definied as:
| (2) |
where “data” stands either for the real observation or pseudo-data. Both the denominator and numerator are maximized. In the numerator, is fixed and only the nuisance parameters can float. Their values at which reaches the maximum are denoted as . In the denominator, both and are allowed to float in the fit, and and are parameters at which reaches its global maximum. The lower constraint on () is imposed as the signal rate cannot be negative; the upper constraint () forces the limit to be one-sided. The value of the test statistic for the real observation is denoted as .
In the next step, the values of the nuisance parameters and best describing the observed data (maximizing ) are obtained for the background-only and signal+background hypotheses, respectively. Using these best-fit values of the nuisance parameters, toy Monte Carlo pseudo-data is generated to construct the test statistic sampling distributions for the both signal+background hypothesis (with signal strength ) and for the background-only hypothesis (=0). The “measurements” are also randomized in each pseudo-data.
With signal+background and background-only sampling distributions for the test statistic one can find the probability to obtain a test statistic value as high as, or higher than, the one observed in data, under the signal+background hypothesis, and obtain CLs() from the ratio
| (3) |
The for a given means that the signal with strenth is excluded at the () confidence level (C.L.). To quote the 95% C.L. upper limit on , we adjust until we reach .
To quantify an excess of events the alternative test statistic is used:
| (4) |
This test statistic allows to evaluate significances (Z) and p-values () from the asymptotic formula:
| (5) |
| (6) |
where is the observed test statistic for = 0.
4 Result of combined search
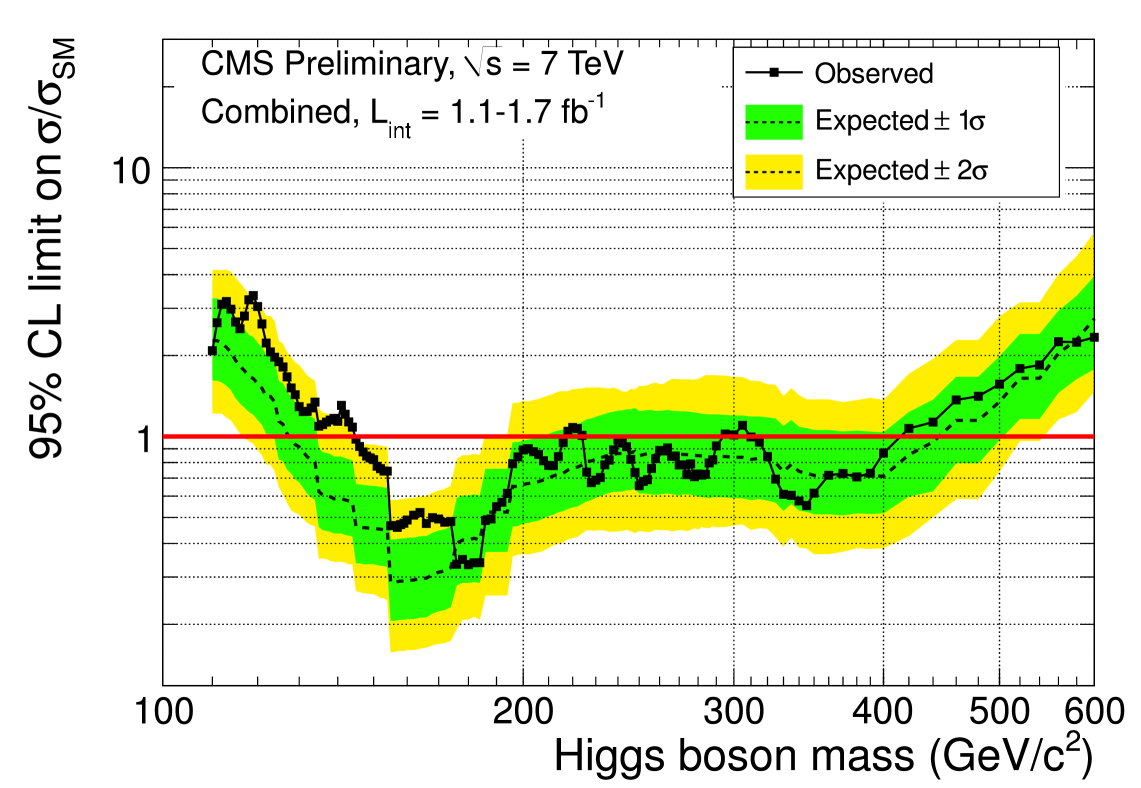
The combined result of the search for the SM boson is presented in Figure 1 which shows the combined 95% C.L. upper limits on the signal strength modifier () as a function of the Higgs boson mass. The dashed line stands for the median expected results for the background-only hypothesis, while the green (yellow) bands indicate the range of 68% (95%) deviation from the median. The observed limit is indicated by the solid line with points. The SM Higgs boson is excluded at 95% C.L. in three mass ranges 145–216, 226–288, and 310–400 , while the expected exclusion range is 130–440 .
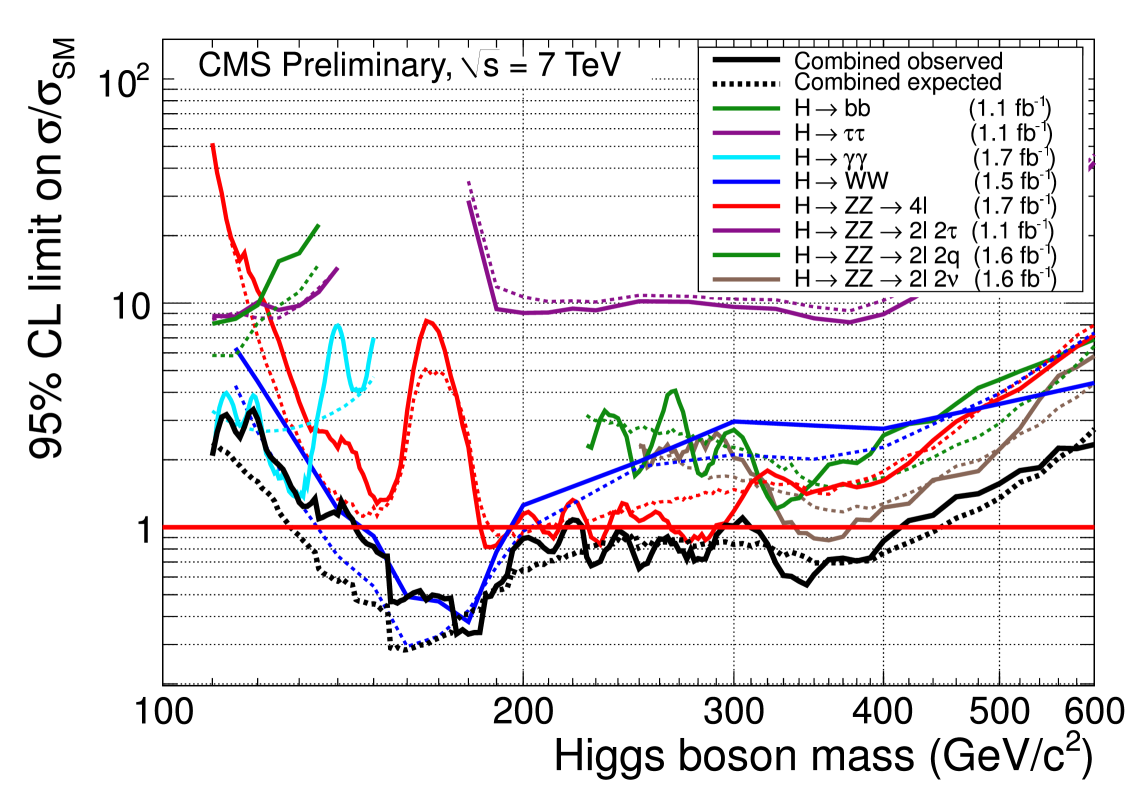
A contribution of each individual Higgs decay mode to the combined result is illustrated in Figure 2. For high masses (200 ) the exclusion is driven by the decay channels, for an intermediate range 130–200 the exclusion is dominated by the mode, while for low masses (130 ) is the most significant contributor.
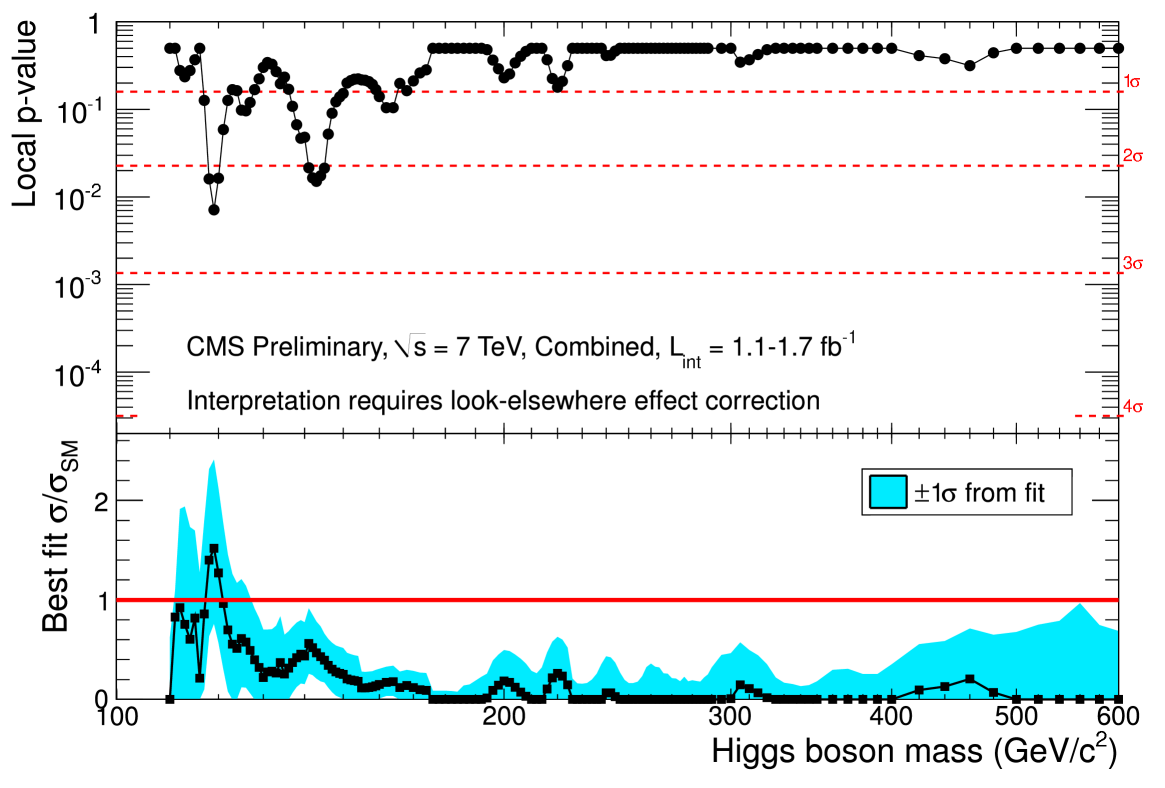
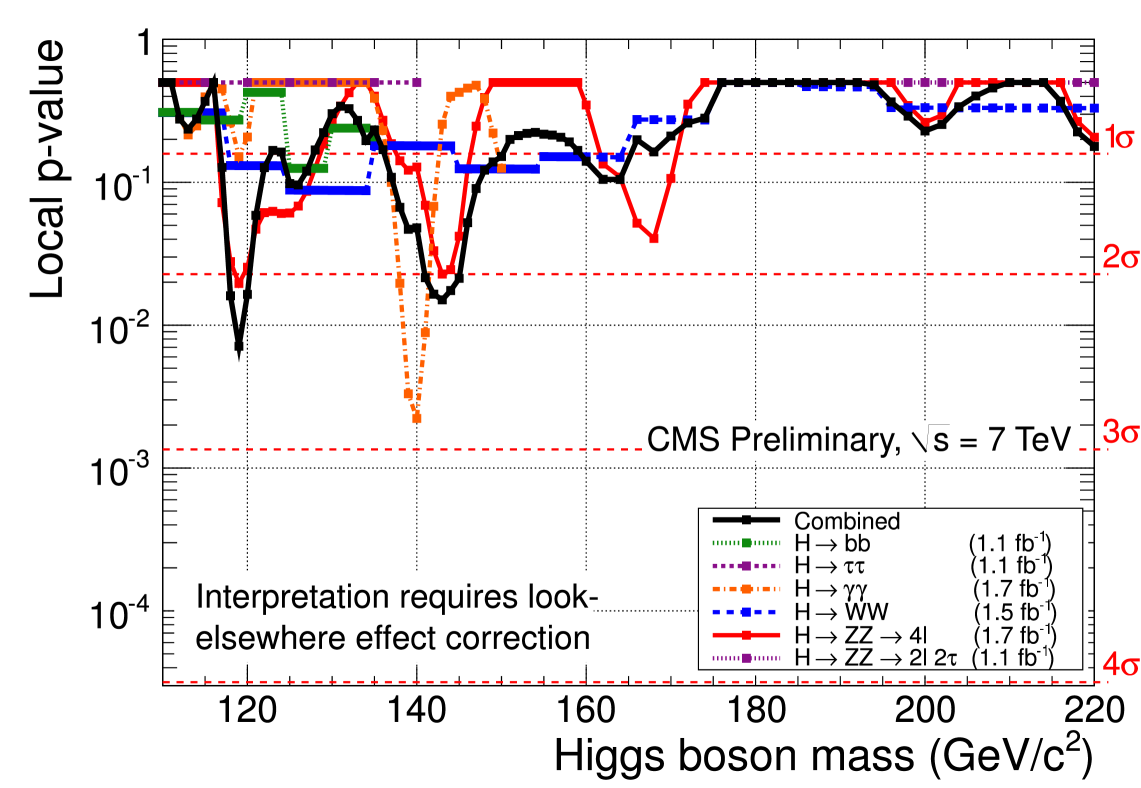
The differences between the observed and expected limits are consistent with statistical fluctuations, as the observed limits lie within the 68% and 95% bands. For the low Higgs boson mass range, we observe an excess of events which leads to weaker observed limit than expected in the absence of the SM Higgs boson. The observed local p-value which quantifies the consistency of the observed excesses with the background-only hypothesis, is shown in Figure 3 (top panel) for the combined search, and split into individual decay modes in Figure 4. A broad offset for low masses, of about 1, corresponds to the excesses seen in the channel characterised by poor mass resolution. The excesses observed in the and the channels result two narrow minima of the p-value. The minimal p-value is , but after accounting for the look-elsewhere effect which is important for this study, it is reduced to a global probability . The look-elsewhere effect was esimeted for the whole explored mass range 110–600 .
The best-fit value of is also presented in Figure 3 (bottom panel). The best-fit value is a factor by which the SM Higgs boson cross section has to be rescaled to best describe observed data. In the mass range between 115 and 125 the best-fit value agrees within uncertainty with 1 (), but as discussed above, with the analysed amount of data the excess is not significant. More data will increase the statistical accuracy of the search thus improve its sensitivity.
5 Conclusions
The combined search for the standard model Higgs boson performed by the CMS Collaboration with up to 1.7 of data was presented. The expected exclusion mass range is 130–440 . The observed data allowed to exclude the SM Higgs boson at 95% C.L. in three mass ranges 145–216, 226–288, and 310–400 . The largest excursion of the observed data from the expected background has a probability of 0.4 after taking into account the look-elsewhere effect for the whole explored mass range (110–600 ).
References
- (1) F. Englert and R. Brout, Phys. Rev. Lett. 13 (1964) 321.
- (2) P. W. Higgs, Phys. Lett. 12 (1964) 132.
- (3) P. W. Higgs, Phys. Rev. Lett. 13 (1964) 508.
- (4) G. S. Guralnik, C. R. Hagen and T. W. B. Kibble, Phys. Rev. Lett. 13 (1964) 585.
- (5) P. W. Higgs, Phys. Rev. 145 (1966) 1156.
- (6) T. W. B. Kibble, Phys. Rev. 155 (1967) 1554.
- (7) R. Barate et al. [LEP Working Group for Higgs boson searches and ALEPH and DELPHI and L3 and OPAL Collaborations], Phys. Lett. B 565 (2003) 61
- (8) [TEVNPH (Tevatron New Phenomina and Higgs Working Group) and CDF and D0 Collaborations], arXiv:1107.5518 [hep-ex].
- (9) [ALEPH and CDF and D0 and DELPHI and L3 and OPAL and SLD and LEP Electroweak Working Group and Tevatron Electroweak Working Group and SLD Electroweak and Heavy Flavour Groups Collaborations], arXiv:1012.2367 [hep-ex]
- (10) S. Dittmaier et al. [LHC Higgs Cross Section Working Group Collaboration], arXiv:1101.0593 [hep-ph].
- (11) CMS Collaboration, CMS PAS HIG-11-021 (2011)
- (12) CMS Collaboration, CMS PAS HIG-11-009 (2011)
- (13) CMS Collaboration, CMS PAS HIG-11-012 (2011)
- (14) CMS Collaboration, CMS PAS HIG-11-014 (2011)
- (15) CMS Collaboration, CMS PAS HIG-11-015 (2011)
- (16) CMS Collaboration, CMS PAS HIG-11-013 (2011)
- (17) CMS Collaboration, CMS PAS HIG-11-016 (2011)
- (18) CMS Collaboration, CMS PAS HIG-11-017 (2011)
- (19) A. L. Read, In *Geneva 2000, Confidence limits* 81-101
- (20) T. Junk, Nucl. Instrum. Meth. A 434 (1999) 435 [hep-ex/9902006]
- (21) ATLAS and CMS Collaborations and LHC Higgs Combination Group, ATL-PHYS-PUB-2011-11, CMS NOTE-2011/005 (2011)